
Circular Economy Startups Dashboard in Excel is a professionally designed analytics tool built to help emerging sustainability-focused businesses monitor, measure, and optimize their circular economy performance. Whether you are running a green startup, managing an eco-innovation venture, or advising sustainability-driven companies, this interactive Excel dashboard transforms complex environmental and operational data into clear, actionable insights — without needing expensive BI software.
Startups operating in the circular economy space face unique challenges — from tracking material recovery rates to monitoring waste diversion and resource efficiency across multiple product lines. This dashboard solves that challenge by providing a centralized performance hub where founders, sustainability managers, and investors can instantly assess how effectively a startup is implementing circular economy principles.
With dynamic slicers, interactive charts, and automated pivot-table-driven calculations, this Excel dashboard template delivers enterprise-grade reporting capabilities at a fraction of the cost. Simply update your raw data, refresh the pivots, and your entire dashboard updates automatically.
🔑 Key Features of Circular Economy Startups Dashboard in Excel
♻️ Comprehensive Circular Economy Analytics — Track startup performance across waste diversion, recycling rates, resource efficiency, and sustainability impact metrics all from one powerful dashboard.
📊 Interactive Multi-Page Dashboard — Navigate through five visually rich analysis pages covering overview KPIs, material flow analysis, sustainability trends, operational efficiency, and regional performance breakdowns.
🎯 Dynamic Slicer Filters — Filter your dashboard instantly by startup name, material category, region, time period, and business model to focus on the metrics that matter most.
📈 Automated Pivot Table Engine — All charts and KPI cards are powered by Excel pivot tables that refresh automatically when you update the data sheet — zero manual calculations required.
🔹 Professional Card-Based KPI Layout — Key metrics are displayed in visually appealing card formats showing totals, percentages, and trend indicators at a glance.
⚡ No Macros or VBA Required — The entire dashboard runs on native Excel formulas, pivot tables, and conditional formatting — making it compatible with Excel 2016 and later versions.
🔧 Fully Customizable Structure — Easily add new KPIs, modify chart types, adjust color themes, and expand the data model to match your specific circular economy tracking requirements.

📦 What’s Inside the Circular Economy Startups Dashboard in Excel
This professionally structured Excel workbook includes seven organized worksheets designed for complete startup performance visibility:
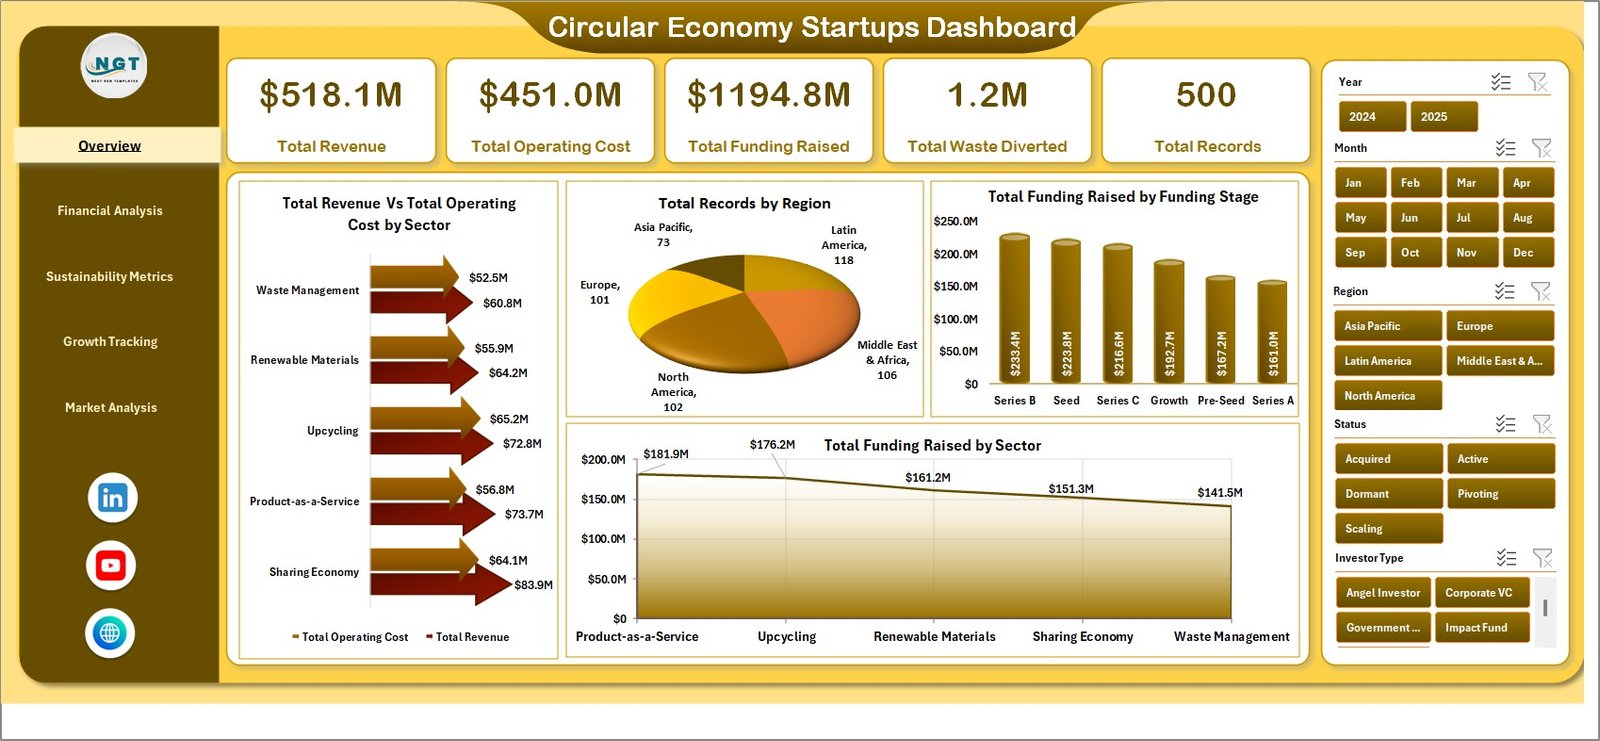
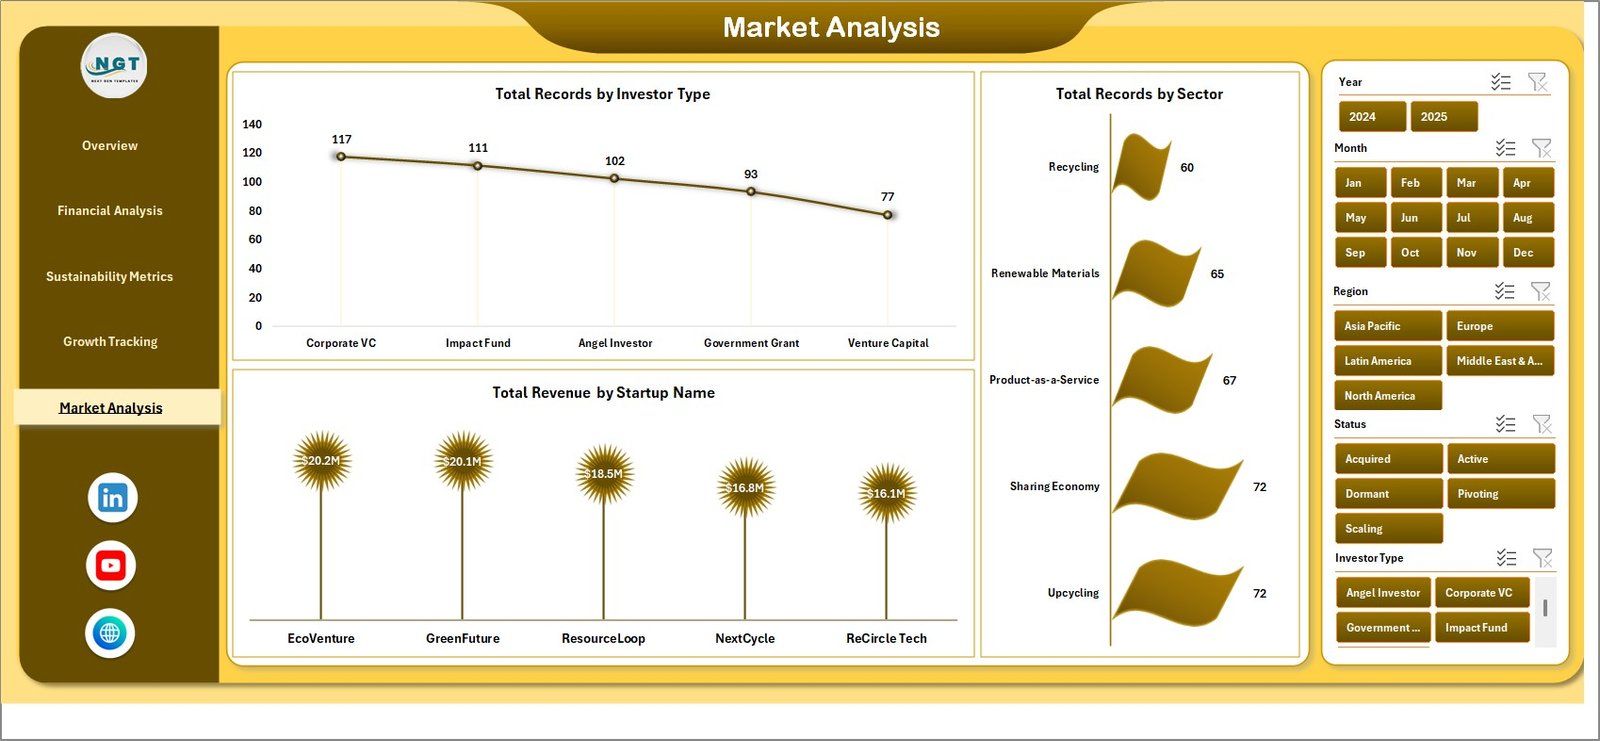
📊 1 — Overview Page — The main dashboard displaying high-level KPI cards including Total Revenue, Waste Diverted, Recycling Rate, Carbon Savings, Active Startups, and Resource Recovery Rate. Multiple interactive charts visualize performance across key dimensions with slicers for instant filtering.
📈 2 — Material Flow Analysis — Deep-dive analysis showing material recovery by category, waste composition breakdown, recycling efficiency by material type, and resource utilization trends across startup operations.
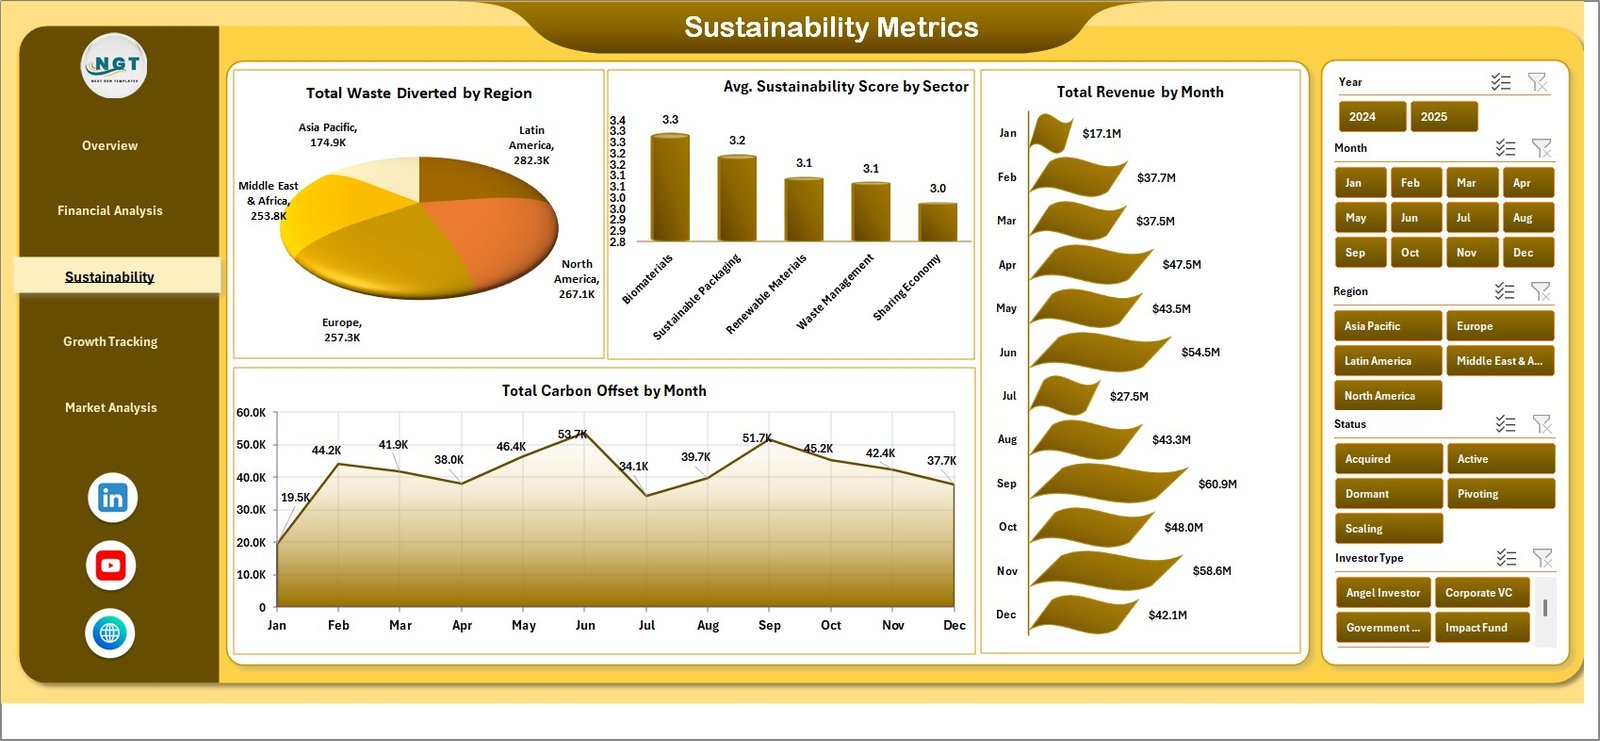
🔍 3 — Sustainability Impact Analysis — Track carbon emission reductions, water conservation metrics, energy savings, and environmental impact scores by startup and region with comparative trend charts.
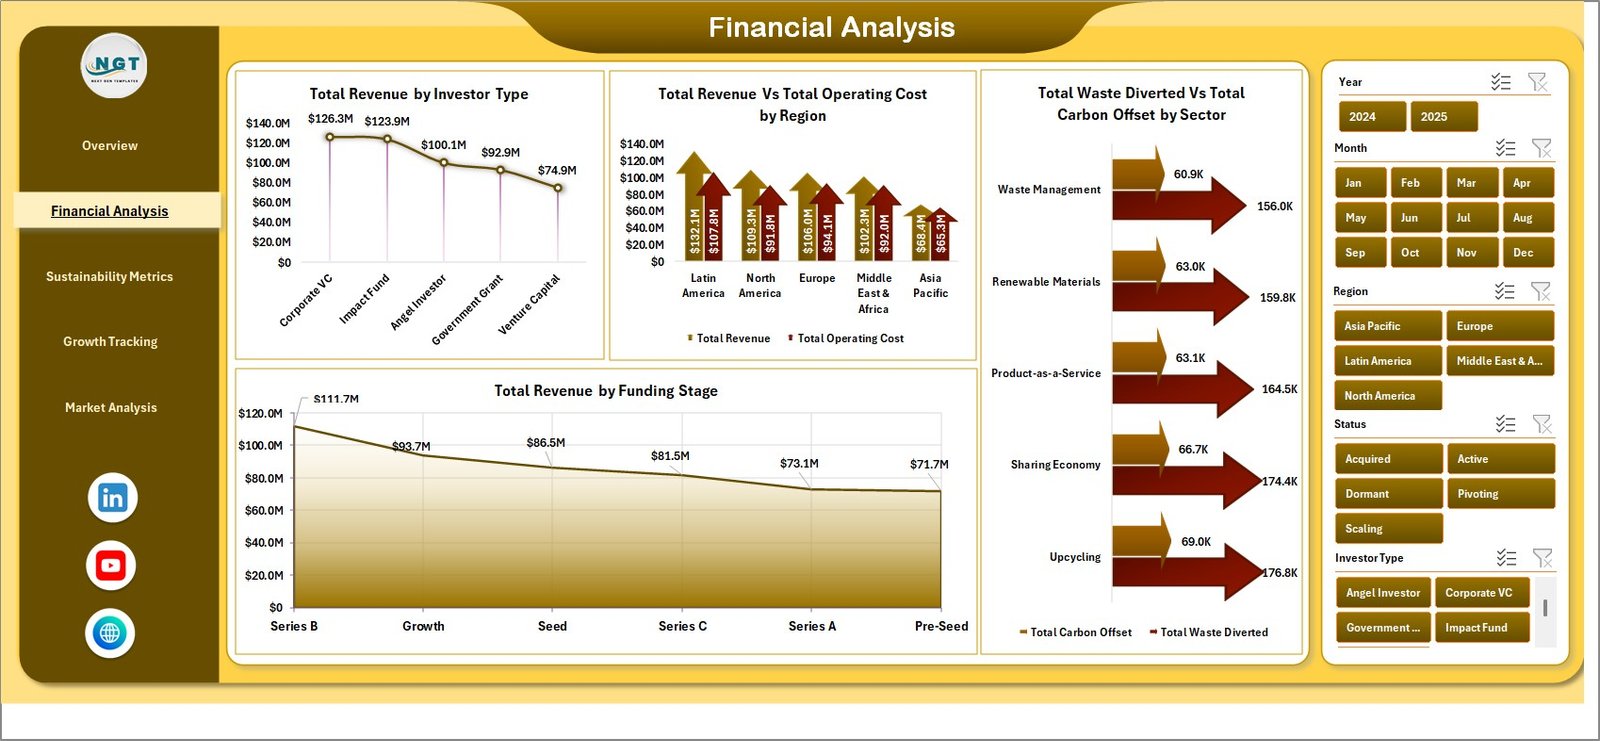
⚙️ 4 — Operational Efficiency Analysis — Monitor operational KPIs including production waste rates, supply chain circularity, product lifecycle metrics, and cost savings from circular practices.
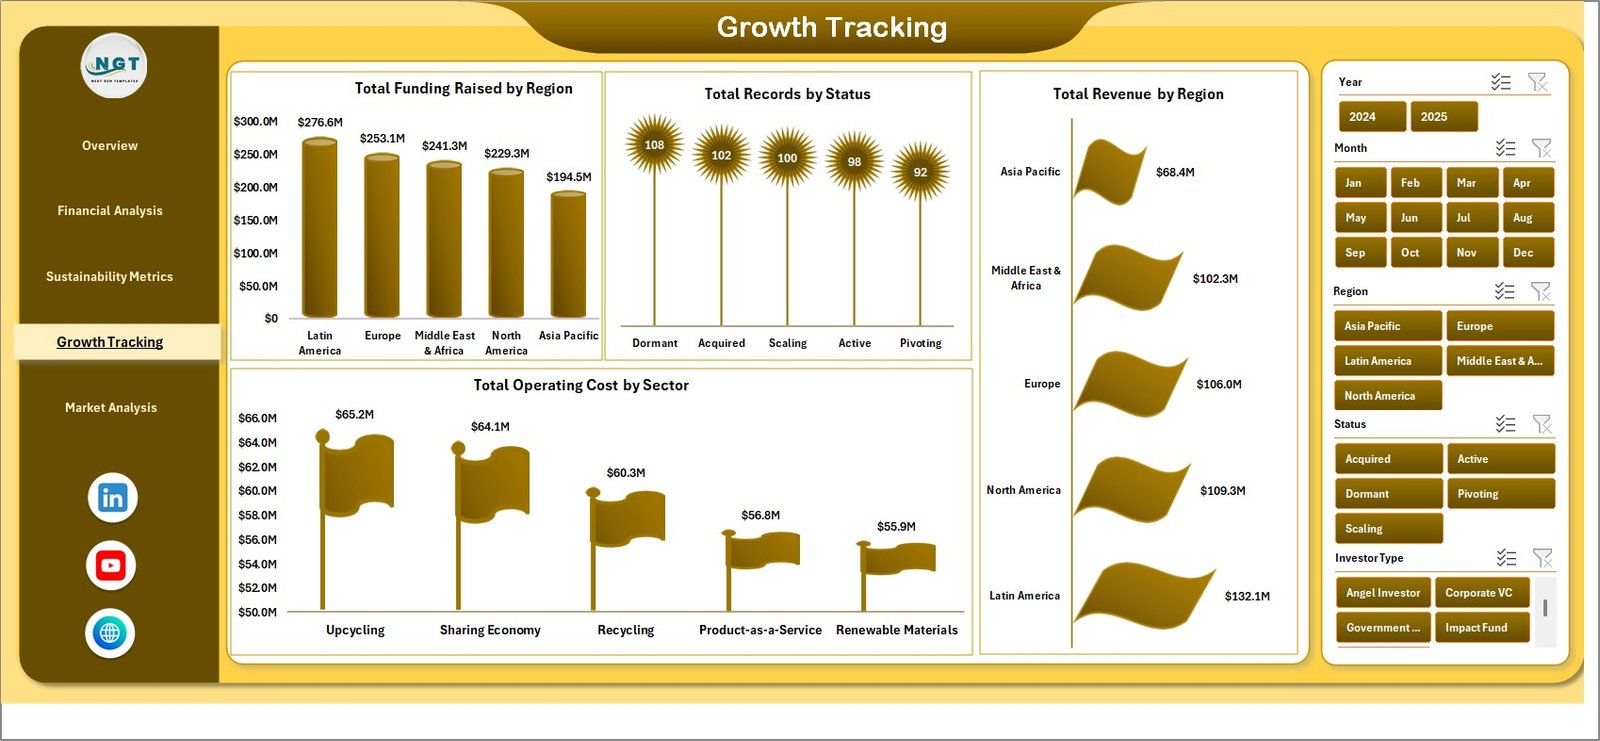
🌍 5 — Regional Performance Analysis — Geographic breakdown of startup performance showing sustainability metrics by location, market penetration, and regional circular economy adoption rates.
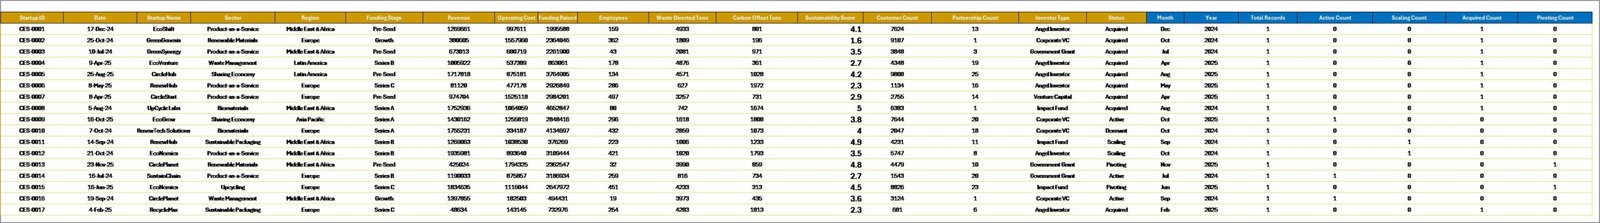
📋 6 — Data Sheet — The central data repository where you enter your raw startup data. Simply update this sheet and refresh all pivots to update the entire dashboard instantly.
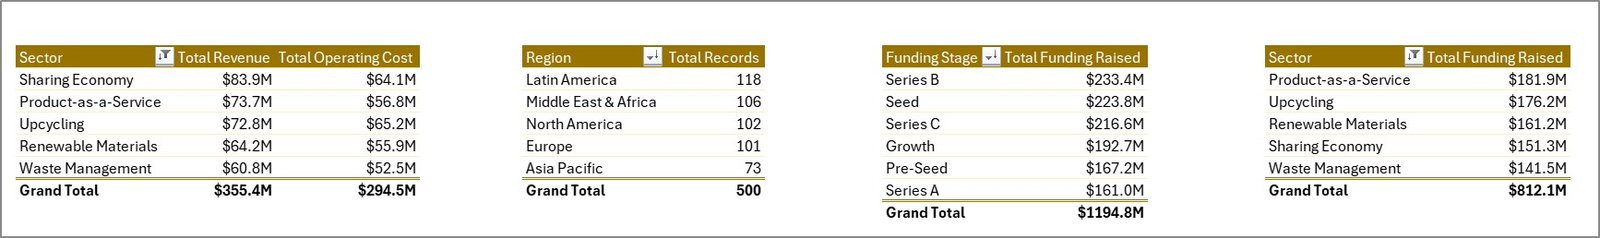
🔧 7 — Support Sheet — Contains all pivot tables that power the dashboard charts and KPI calculations. Keep this sheet hidden during presentations for a cleaner view.
⚙️ How to Use the Circular Economy Startups Dashboard in Excel
1️⃣ Open the Excel file and navigate to the Data Sheet tab
2️⃣ Replace the sample data with your actual startup performance data in the same format
3️⃣ Go to the Data tab in the Excel Ribbon and click Refresh All to update all pivot tables
4️⃣ Navigate through the five dashboard pages to explore your analysis
5️⃣ Use the slicers on each page to filter data by startup, region, category, or time period
6️⃣ Customize KPIs, colors, and chart formats to match your branding and reporting needs
👥 Who Can Benefit from This Circular Economy Startups Dashboard in Excel
🌱 Circular Economy Startup Founders monitoring operational sustainability
📊 Sustainability Managers tracking environmental KPIs across startup portfolios
💼 Impact Investors evaluating startup sustainability performance
🏢 Incubators and Accelerators managing cohort-level circular economy metrics
🔬 ESG Analysts benchmarking startup environmental impact
📈 Business Consultants advising green startups on data-driven decisions
🎓 Academic Researchers studying circular economy business models
By combining powerful Excel analytics with a user-friendly design, the Circular Economy Startups Dashboard in Excel empowers sustainability-driven organizations to track performance, identify improvement opportunities, and accelerate their transition to a fully circular business model — all within a familiar spreadsheet environment.
📖 Click here to read the Detailed Blog Post
🎥 Visit our YouTube channel to learn step-by-step video tutorials
👉 YouTube.com/@NextGenTemplates


Reviews
There are no reviews yet.