



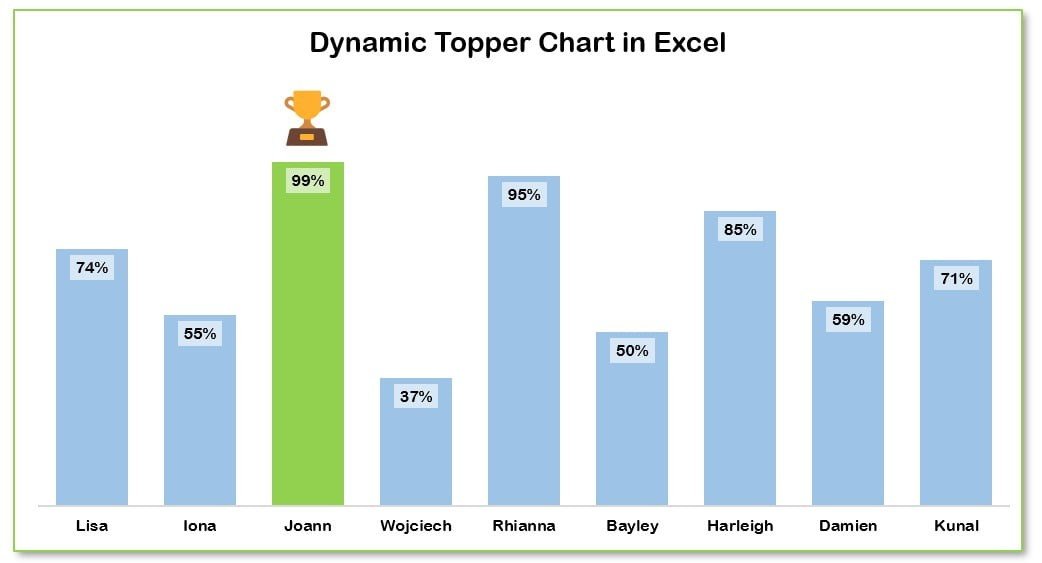
The Dynamically Highlight Topper Student Chart in Excel is a fantastic tool designed to track and visually represent the academic performance of students, automatically highlighting the top-performing students. This chart allows educators, administrators, and school management to easily identify the highest achievers and track their progress over time. With its dynamic features, the chart updates automatically to reflect any changes in student scores, ensuring you always have up-to-date insights.
Whether you’re analyzing student performance across different subjects or tracking overall scores, this chart helps you display results in an interactive, easy-to-understand format. Customizable to fit your needs, this tool is perfect for schools, universities, or any educational institution that wants to visualize student performance effectively.
Key Features of the Dynamically Highlight Topper Student Chart
📌 Dynamic Highlighting of Top Students
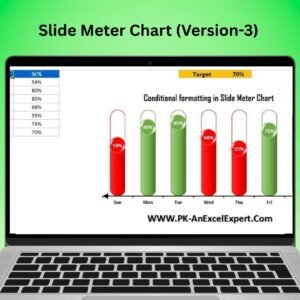
This chart automatically highlights the top-performing student(s) in a visual format, making it easy to identify academic excellence. Whether you’re tracking individual subjects or overall performance, the chart uses color coding to emphasize the highest achievers.
🛠 Customizable Categories and Metrics
You can easily customize the chart to include the specific metrics and categories that matter to your institution. Track subjects, overall scores, or other performance metrics, and adjust the data inputs as needed.
💡 Real-Time Data Updates
As you update student scores or performance data, the chart dynamically adjusts in real-time to reflect those changes. This ensures that you always have the most current and accurate information at your fingertips.
🔢 Easy-to-Understand Visual Representation
The chart uses simple, color-coded visuals to clearly represent student performance. The color coding helps to quickly distinguish between top-performing students and others, making the chart intuitive and easy to understand.
🚀 Multiple Data Sets Comparison
Track and compare the performance of multiple students across different subjects or time periods. This feature allows you to see how students are performing relative to each other and monitor trends over time.
📊 Customizable Design
The design of the chart can be fully customized to fit the specific needs of your institution. Adjust colors, labels, and chart elements to reflect your school’s branding or style.
⚙ Simple Setup and Customization
Setting up the Dynamically Highlight Topper Student Chart is straightforward, even for those with minimal Excel experience. The template includes clear instructions for customization, ensuring that anyone can get started in no time.
🚀 Why You’ll Love the Dynamically Highlight Topper Student Chart
✅ Automatic Highlighting – The top student(s) are automatically highlighted, making it easy to identify top performers. ✅ Customizable to Your Needs – Tailor the chart to track specific subjects, scores, or performance metrics. ✅ Real-Time Data Updates – The chart updates automatically as new data is entered. ✅ Simple and Clear Visualization – Color-coded visuals make it easy to interpret and present results. ✅ Easy Setup – Quick and simple setup with clear instructions for customization.
📂 What’s Inside the Dynamically Highlight Topper Student Chart?
- Top Student Highlighting: A dynamic chart that automatically highlights the top-performing student(s).
- Customizable Performance Metrics: Track specific metrics such as subject scores, total performance, or other indicators.
- Real-Time Updates: The chart adjusts automatically as student data is entered or changed.
- Simple Color-Coding: Visual indicators to easily differentiate top performers.
- Clear Setup Instructions: Easy-to-follow steps for customizing and implementing the chart.
🔍 How to Use the Dynamically Highlight Topper Student Chart
1️⃣ Download the Template – Instant access to the Excel file upon purchase. 2️⃣ Enter Student Data – Input student names, subjects, and scores. 3️⃣ Customize the Chart – Modify labels, colors, and other chart elements to match your needs. 4️⃣ Monitor Student Performance – Use the chart to track and visualize student performance over time. 5️⃣ Present and Share – Use the chart to present student performance in meetings, reports, or presentations.
🎯 Who Can Benefit from the Dynamically Highlight Topper Student Chart? 🔹 Teachers
🔹 School Administrators
🔹 Education Institutions
🔹 HR and Learning Managers
🔹 Educational Consultants
🔹 Anyone looking to track and visualize student performance
Enhance your student performance tracking with the Dynamically Highlight Topper Student Chart in Excel. With real-time updates, automatic highlighting, and easy-to-understand visuals, this chart makes it easy to monitor and present student achievements.
Click here to read the Detailed blog post
https://www.pk-anexcelexpert.com/dynamically-highlight-topper-student-chart/
Visit our YouTube channel to learn step-by-step video tutorials
Watch the step-by-step video tutorial:
Compatibility and Requirements
- Works in Microsoft Excel desktop (Excel 2016 or later, or Microsoft 365).
- The top student is picked out with color coding. Microsoft explains color rules in Use conditional formatting to highlight information.
Frequently Asked Questions
How does the chart pick the topper?
It highlights the top-performing student automatically and uses color coding to set that student apart from the rest.
Does the chart update when scores change?
Yes. When you update student scores, the chart adjusts and the highlight moves to the new top performer.
Can I track different subjects?
Yes. You enter student names, subjects and scores, and you can switch the metric to subject scores or total performance.
Can I change the colors and labels?
Yes. Colors, labels and other chart elements can be changed to match your school’s style.
Related Student and Chart Templates
- Student Progress Tracker Checklist in Excel: follow each student’s progress in Excel
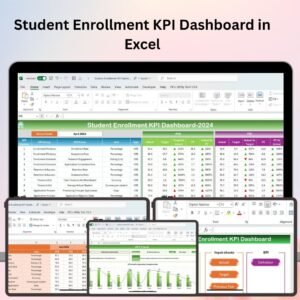
- Student Enrollment KPI Dashboard in Excel: enrollment KPIs for schools
- Student Academic Performance Dashboard in Google Sheets: student results on a dashboard in Google Sheets
- Stylish Progress Bar Chart in Excel: another chart for showing progress
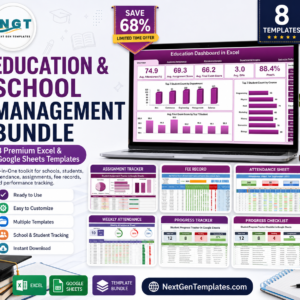
- Education & School Management Bundle: 8 school templates in one download
Browse all Excel chart templates or the Excel education templates.






Reviews
There are no reviews yet.