



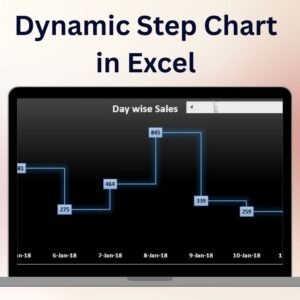
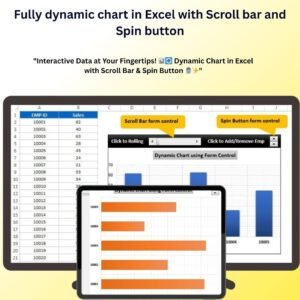
The Fully Dynamic Chart in Excel with Scroll Bar and Spin Button is a powerful tool that allows you to visualize and interact with your data like never before. This chart enables real-time data manipulation, offering a unique interactive experience with the use of a scroll bar and spin button. Whether you are tracking sales, monitoring KPIs, or analyzing financial data, this dynamic chart gives you the flexibility to adjust your data inputs and instantly see the impact on your visualizations.
Designed for ease of use, the Fully Dynamic Chart provides real-time updates as you adjust data points using the scroll bar or spin button, allowing for efficient analysis and data presentation. This template is fully customizable, ensuring that you can tailor it to suit your specific needs.

Key Features of the Fully Dynamic Chart in Excel with Scroll Bar and Spin Button
📌 Real-Time Data Interaction
With the scroll bar and spin button, you can interact with your data in real-time. Adjust values and watch the chart update instantly, making it easy to analyze different scenarios and quickly make data-driven decisions.
🛠 Fully Customizable Chart
The chart is fully customizable, allowing you to adjust labels, colors, and other design elements to match your preferences. Whether you’re creating a performance dashboard, financial report, or project tracker, the dynamic chart adapts to your unique needs.
💡 Scroll Bar and Spin Button Integration
The integration of the scroll bar and spin button allows for an interactive and engaging experience. You can adjust data inputs quickly by either dragging the scroll bar or using the spin button, providing an easy and efficient way to explore data variations.
🔢 Instant Data Updates
As you make changes to your data using the scroll bar or spin button, the chart automatically updates to reflect those changes. This real-time functionality ensures that your analysis is always up-to-date, saving you time and effort.
🚀 Multiple Use Cases
This dynamic chart is perfect for tracking multiple data points, such as sales progress, project milestones, financial goals, and other KPIs. Whether you need to monitor performance over time or compare multiple data sets, this chart provides a clear, visual representation.
📊 Clear and Visual Data Representation
The chart offers a clean, intuitive design that clearly displays trends, progress, and comparisons. With visually engaging charts and real-time updates, you can quickly grasp important insights and present data in a way that’s easy to understand.
⚙ Simple Setup and Customization
The template is user-friendly and easy to set up, even for Excel beginners. With clear instructions and customizable options, you can have the dynamic chart up and running in no time.
🚀 Why You’ll Love the Fully Dynamic Chart in Excel with Scroll Bar and Spin Button
✅ Interactive Data Visualization – Adjust data in real-time with the scroll bar and spin button. ✅ Real-Time Updates – Watch the chart automatically adjust as you modify the data. ✅ Fully Customizable Design – Tailor the chart to your specific needs and preferences. ✅ Multiple Use Cases – Ideal for tracking sales, KPIs, financial goals, and more. ✅ Simple Setup – Quick to implement with easy-to-follow instructions.
📂 What’s Inside the Fully Dynamic Chart in Excel with Scroll Bar and Spin Button?
- Interactive Chart: A dynamic chart that updates instantly as you adjust data using the scroll bar and spin button.
- Customizable Design: Adjust colors, labels, and chart types to fit your needs.
- Real-Time Data Updates: The chart automatically updates as new data is entered.
- Clear Setup Instructions: Easy-to-follow steps to customize and set up the chart.
🔍 How to Use the Fully Dynamic Chart in Excel with Scroll Bar and Spin Button
1️⃣ Download the Template – Instant access to the Excel file upon purchase. 2️⃣ Input Your Data – Enter your data and interact with it using the scroll bar or spin button. 3️⃣ Customize the Chart – Modify labels, colors, and chart elements to match your preferences. 4️⃣ Track and Monitor Data – Use the dynamic chart to track progress, compare data points, and monitor KPIs. 5️⃣ Present and Share – Use the interactive chart in reports, dashboards, or presentations.
🎯 Who Can Benefit from the Fully Dynamic Chart in Excel with Scroll Bar and Spin Button? 🔹 Project Managers
🔹 Sales Teams
🔹 Financial Analysts
🔹 Marketing Teams
🔹 Business Analysts
🔹 Anyone who needs to visualize and track data dynamically
Track, compare, and present your data with the Fully Dynamic Chart in Excel with Scroll Bar and Spin Button. This interactive tool helps you make data-driven decisions by providing real-time updates and easy-to-use customization.
Click here to read the Detailed blog post
https://www.pk-anexcelexpert.com/fully-dynamic-chart-in-excel-with-scroll-bar-and-spin-button/
Visit our YouTube channel to learn step-by-step video tutorials
Watch the step-by-step video tutorial:
Compatibility and Requirements
- Works in Microsoft Excel desktop (Excel 2016 or later, or Microsoft 365).
- The scroll bar and spin button are standard Excel form controls.
- New to Excel charts? Microsoft explains the basics in Create a chart from start to finish.
Frequently Asked Questions
What do the scroll bar and spin button do?
They change the values feeding the chart, and the chart redraws as you drag the scroll bar or click the spin button.
Can I change the chart design?
Yes. You can change labels, colors, chart elements and chart types.
What can I use it for?
Sales progress, project milestones, financial goals and other KPIs in reports, dashboards or presentations.
Is there a similar chart with only a scroll bar?
Yes. See the Dynamic Chart with Form Control Scrollbar.
Related Dynamic Chart Templates
- Dynamic Chart with Form Control Scrollbar: a scroll bar driven chart
- Target Vs Actual Sales Dynamic Chart: compare sales against target
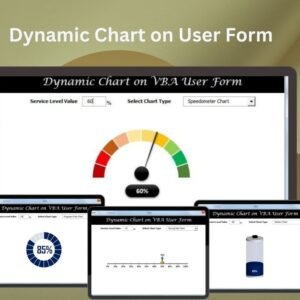
- Dynamic Chart on User Form in Excel: a chart shown inside a user form
- Dynamic Chart with Slicer for Employees Count by Age group: a slicer driven chart
- Data Analyst’s Chart & Visualization Pack: ten chart templates in one download
Browse all Excel charts or the Excel dashboards.








Reviews
There are no reviews yet.