


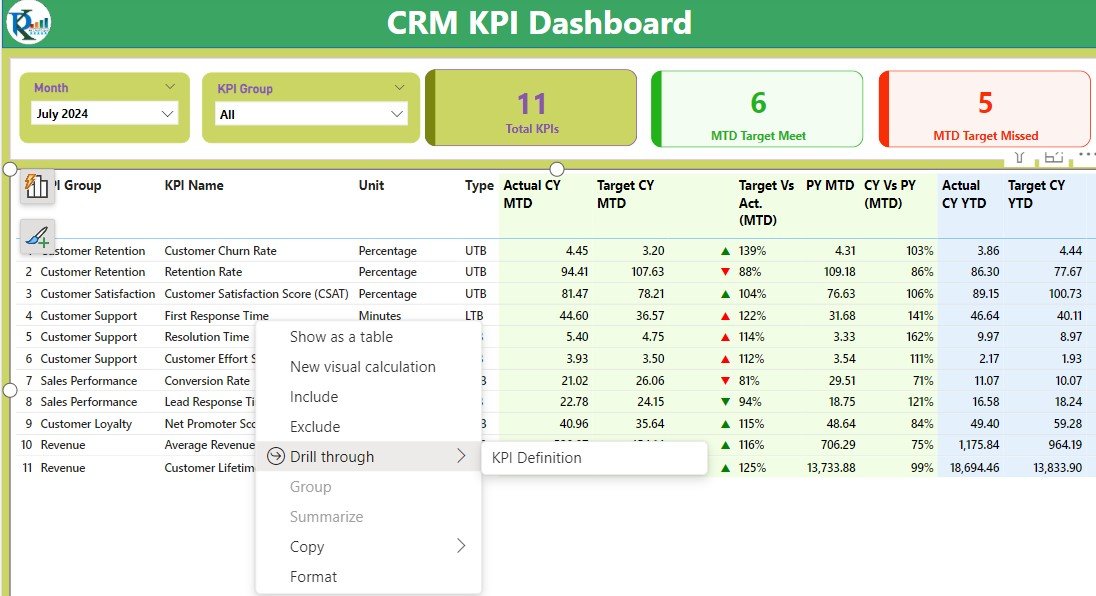

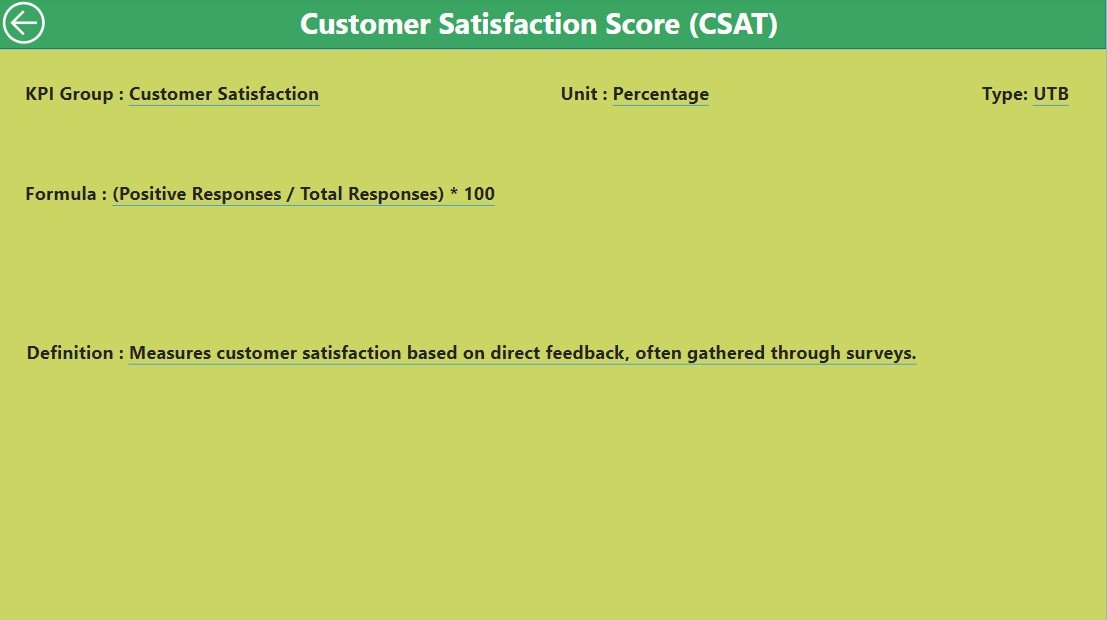
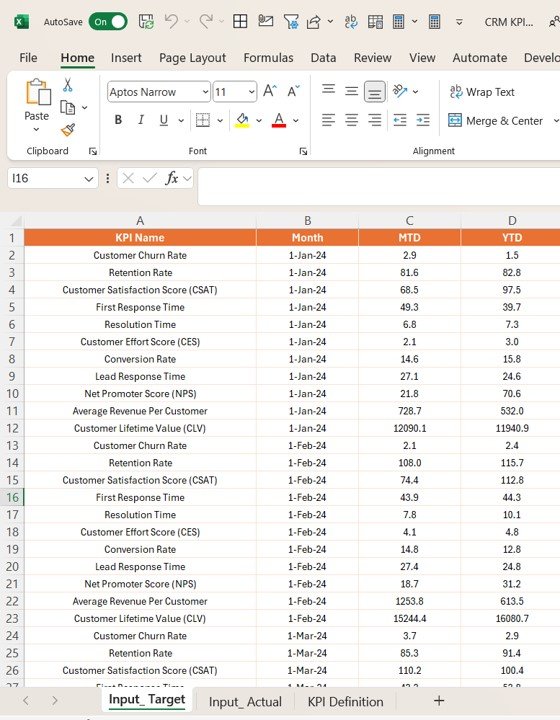
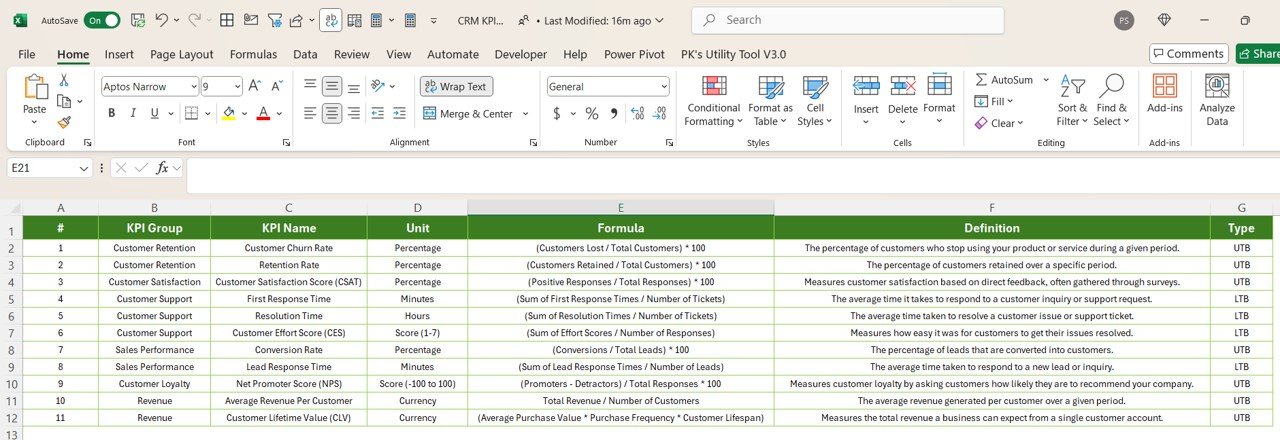
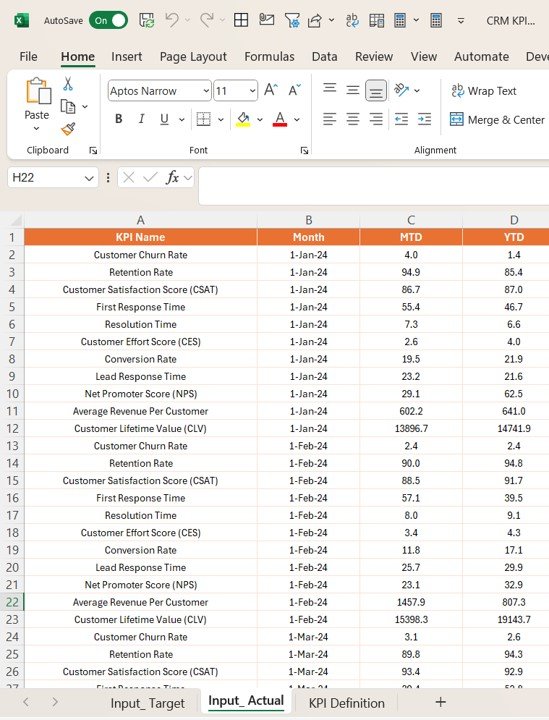

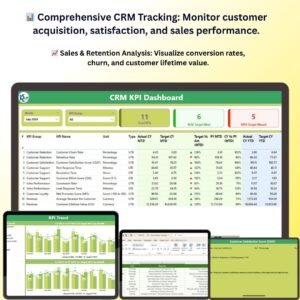
The CRM KPI Dashboard in Power BI is a powerful tool designed for sales managers, marketing teams, and business owners who want to track, analyze, and optimize their customer relationship management (CRM) efforts. This customizable dashboard helps you monitor key performance indicators (KPIs) related to customer acquisition, retention, satisfaction, and sales performance, allowing you to gain insights into your customer data and drive business growth.
With real-time data integration, this Power BI dashboard provides a comprehensive view of your CRM performance, enabling you to make data-driven decisions, optimize customer interactions, and improve customer lifetime value (CLV). Whether you’re managing a small customer base or overseeing large-scale CRM operations, this dashboard is a must-have tool for enhancing customer relationships and boosting business performance.
Key Features of the CRM KPI Dashboard in Power BI
📊 Comprehensive CRM Performance Tracking
Track essential CRM KPIs such as customer acquisition cost (CAC), churn rate, customer lifetime value (CLV), customer satisfaction, and sales performance. Gain a clear overview of your CRM strategy’s effectiveness.
⚡ Real-Time Customer Insights
Monitor customer interactions, sales pipeline, and retention metrics in real time. Use these insights to identify opportunities for improving customer relationships and optimizing sales processes.
📈 Sales & Customer Relationship Insights
Analyze sales performance, customer satisfaction, and engagement levels to identify trends, uncover growth opportunities, and enhance customer experiences.
📅 Customizable CRM KPIs
Easily adjust the dashboard to track KPIs specific to your CRM strategy, whether it’s focusing on lead conversion, customer retention, or sales forecasting.
🖥️ Interactive & User-Friendly Interface
Designed for ease of use, the Power BI dashboard features interactive charts, slicers, and filters that allow you to drill down into your data, gaining deeper insights into customer behavior and CRM performance.
Why You’ll Love the CRM KPI Dashboard in Power BI

✅ Track Key CRM Metrics
Monitor KPIs such as customer acquisition cost, churn rate, CLV, and sales performance to gain a clear picture of your CRM efforts and customer relationship strategy.
✅ Improve Customer Retention
Track customer satisfaction and engagement metrics to optimize your customer retention strategies and reduce churn, ensuring long-term customer loyalty.
✅ Boost Sales Performance
Analyze sales performance and customer interactions to identify opportunities for improving lead conversion rates and increasing revenue generation.
✅ Enhance Customer Relationships
Leverage real-time insights to build stronger, data-driven relationships with customers, ultimately improving customer satisfaction and lifetime value.
✅ Make Data-Driven CRM Decisions
Leverage the dashboard’s insights to make informed decisions about customer acquisition, retention strategies, sales forecasting, and CRM process optimization.
What’s Inside the CRM KPI Dashboard Template?
- Customer Acquisition & Retention Monitoring: Track customer acquisition cost, churn rate, and customer lifetime value.
- Sales & Conversion Performance: Visualize sales pipeline, conversion rates, and deal closure rates.
- Customer Satisfaction Tracking: Monitor customer satisfaction, engagement, and feedback across different touchpoints.
- Customizable KPIs: Adjust the dashboard to track specific CRM KPIs based on your business goals.
- Interactive Reporting: Use filters and charts to explore your CRM data and gain deeper insights into customer behavior and sales performance.
How to Use the CRM KPI Dashboard in Power BI
1️⃣ Download the Template: Get instant access to the CRM KPI Dashboard in Power BI.
2️⃣ Input CRM Data: Enter customer, sales, and engagement data into the dashboard.
3️⃣ Track & Monitor KPIs: Use the dashboard to monitor CRM performance and customer relationship metrics in real time.
4️⃣ Analyze & Optimize: Leverage insights from the dashboard to optimize your CRM strategy, improve customer retention, and boost sales performance.
Who Can Benefit from the CRM KPI Dashboard in Power BI?
🔹 Sales Managers & Directors
🔹 Marketing Teams & Customer Success Managers
🔹 Business Owners & Entrepreneurs
🔹 Customer Relationship Management Teams
🔹 Data Analysts & Business Intelligence Professionals
🔹 Anyone Looking to Optimize CRM Strategy & Performance
Track, analyze, and optimize your CRM efforts with the CRM KPI Dashboard in Power BI. Monitor key performance metrics, improve customer relationships, and drive business growth with this essential tool for CRM management.
Click here to read the Detailed blog post
Visit our YouTube channel to learn step-by-step video tutorials
Youtube.com/@PKAnExcelExpert













Reviews
There are no reviews yet.