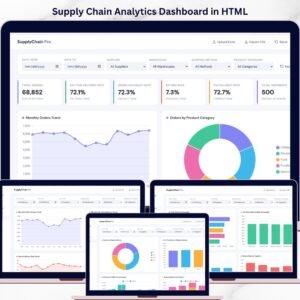
Take control of your operations with the Supply Chain Analytics Dashboard in HTML — a modern, interactive, and ready-to-use solution designed to simplify complex supply chain reporting. In today’s fast-moving business world, companies manage suppliers, warehouses, shipping methods, fulfillment performance, and product categories all at the same time. However, when this data is spread across multiple spreadsheets, it becomes difficult to identify problems, track trends, and make smart decisions quickly. That is exactly why this dashboard is so valuable. It transforms raw supply chain data into clear, visual, and actionable insights through a sleek HTML-based interface. Instead of wasting time on manual reporting, you can monitor key KPIs, compare supplier performance, analyze shipping efficiency, and uncover bottlenecks in one centralized dashboard. If you want a smarter, faster, and more professional way to manage your supply chain, this dashboard is the perfect solution.
Key Feature of Supply Chain Analytics Dashboard in HTML
📦 Interactive HTML Dashboard – Built with modern web technology to deliver a smooth, professional, and engaging analytics experience.
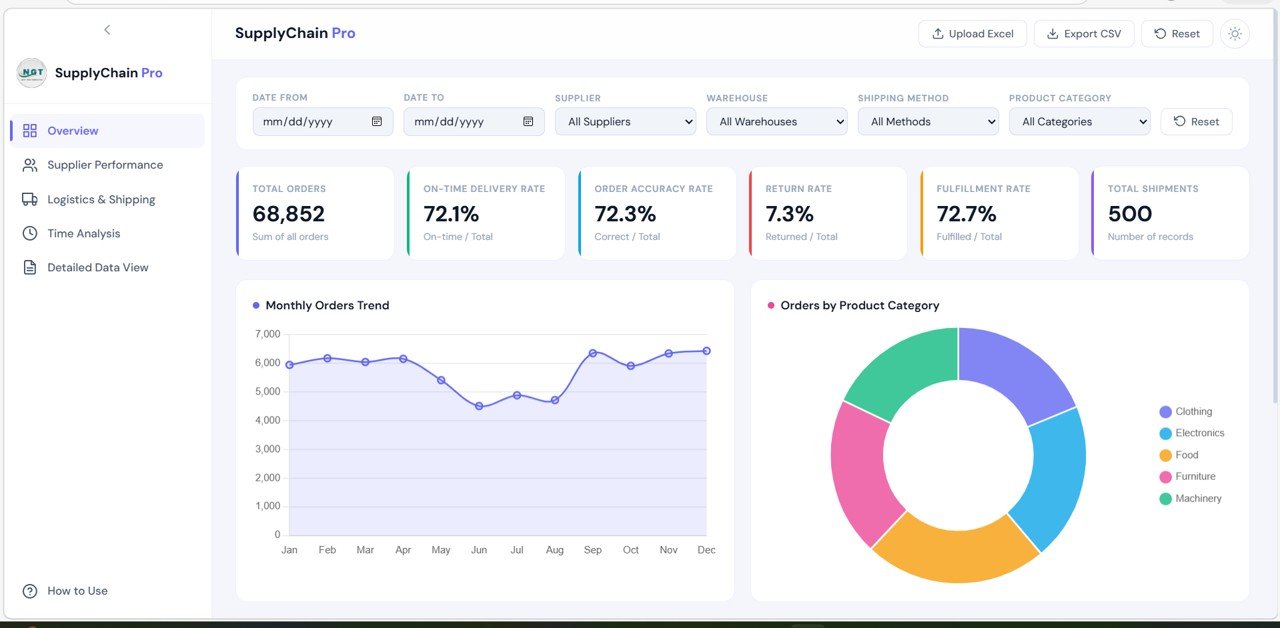
📊 Powerful KPI Cards – Track Total Orders, On-Time Delivery Rate, Order Accuracy Rate, Return Rate, Fulfillment Rate, and Total Shipments instantly.
📈 Overview Page Insights – Get a high-level summary of your complete supply chain performance with charts and KPI highlights.
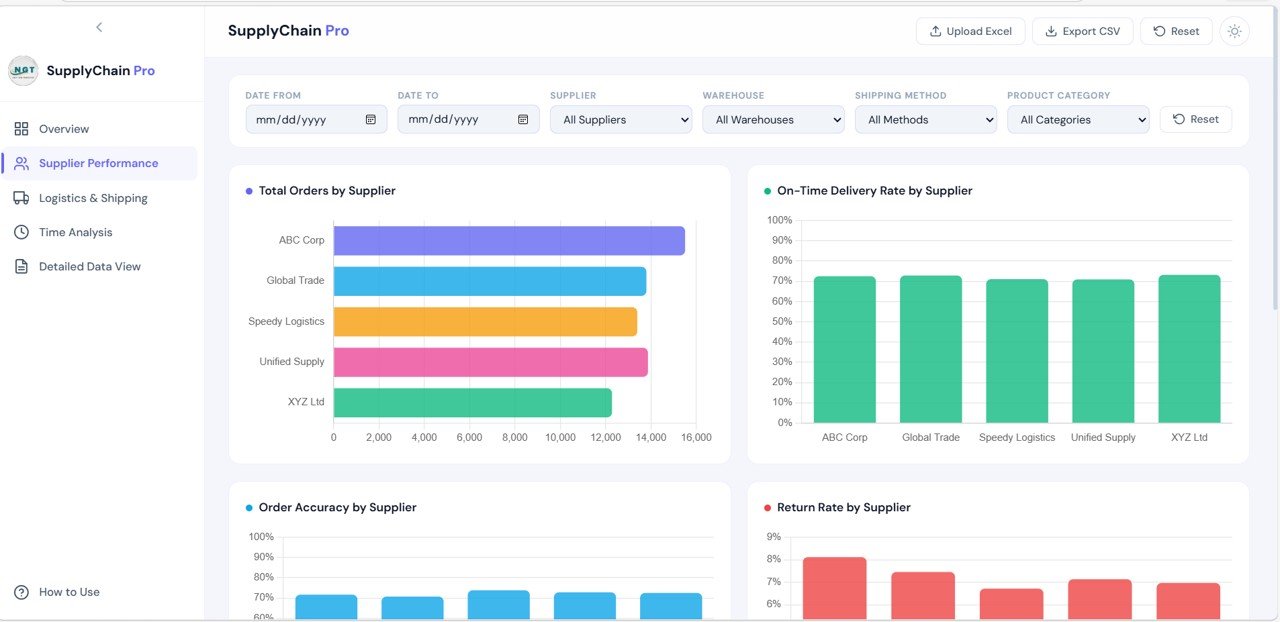
🏭 Supplier Performance Analysis – Compare suppliers using Total Orders, On-Time Delivery Rate, Order Accuracy, Return Rate, and a Supplier Performance Radar Chart.
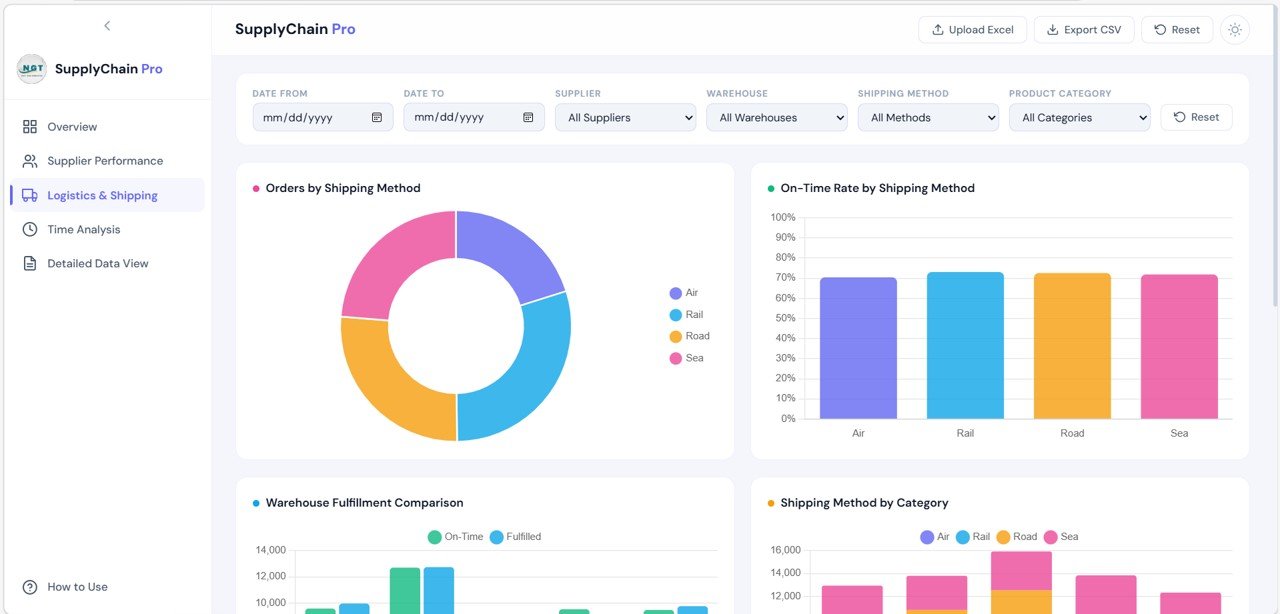
🚚 Logistics & Shipping Analysis – Monitor shipping efficiency by analyzing orders by shipping method, on-time delivery, warehouse fulfillment, and product category movement.
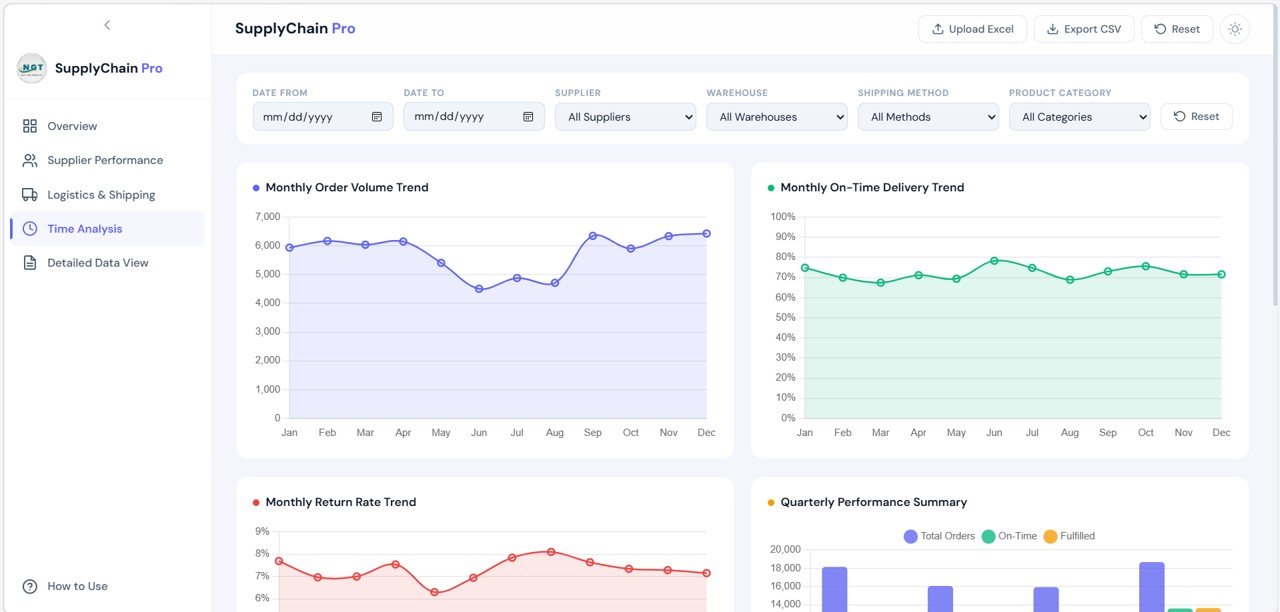
📅 Time Analysis Page – Understand monthly and quarterly performance with trends for order volume, on-time delivery, return rates, and category performance.
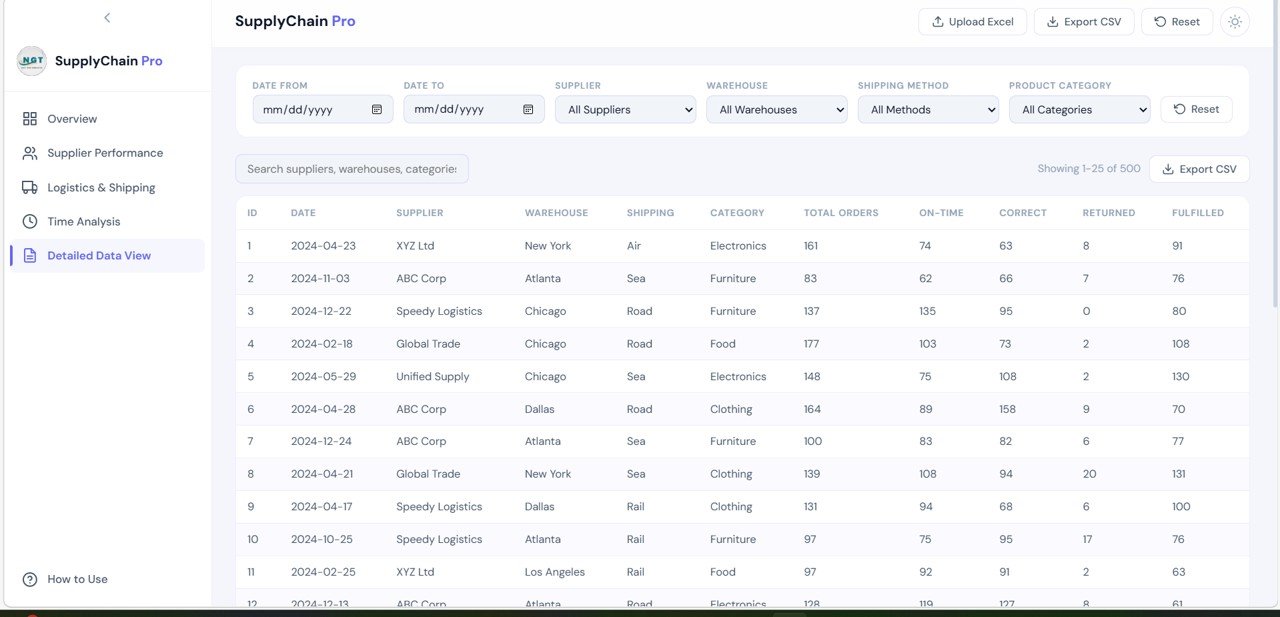
📋 Detailed Data View – Access a full tabular report with search functionality, sortable columns, pagination, and CSV export options.
🔍 Real-Time Filtering and Analysis – Use dynamic filters to focus on suppliers, warehouses, product categories, shipping methods, and time periods.
📘 Built-In How to Use Section – The dashboard includes guidance for required data structure, upload process, and navigation support.
⚡ Fast and Visual Decision-Making – Turn complex supply chain data into meaningful insights that help improve performance and reduce inefficiencies.
What’s Inside the Supply Chain Analytics Dashboard in HTML
Inside this digital product, you get a complete HTML-based supply chain analytics dashboard designed to centralize your reporting and improve operational visibility. It is structured to help businesses monitor and optimize every major area of supply chain performance through interactive visuals and easy-to-use analytics pages.
The Overview Page works as the main summary area of the dashboard. It includes KPI cards and charts that give users a quick understanding of total orders, delivery performance, order accuracy, fulfillment rates, and shipment activity.
The Supplier Performance Page helps businesses evaluate how individual suppliers are performing. This is especially useful for identifying the most reliable suppliers and spotting vendors that may be causing delays or return issues.
The Logistics & Shipping Section focuses on transportation and warehouse performance. It helps users compare shipping methods, warehouse fulfillment, and delivery effectiveness across categories.
The Time Analysis Page provides trend-based insights. It helps users study monthly order volume, return rates, on-time delivery trends, and quarterly summaries so they can make better future plans.
The Detailed Data View offers a searchable and sortable table where users can explore records in detail, review filtered results, and export data to CSV when needed.
The dashboard also includes a How to Use Section that explains the required dataset format, important columns, upload process, and dashboard navigation instructions. As a result, users can start working with the dashboard quickly and confidently.
How to Use the Supply Chain Analytics Dashboard in HTML
🚀 Start by preparing your dataset in the required format. Your data should include fields such as Record ID, Date, Supplier Name, Warehouse Location, Shipping Method, Product Category, Total Orders, On-Time Deliveries, Correct Orders, Returned Orders, and Fulfilled Orders.
📂 Upload or connect your dataset to the dashboard based on the provided instructions in the built-in guide.
📊 Open the Overview Page to review your high-level KPIs and performance charts.
🏭 Move to the Supplier Performance Section to compare vendors and identify strengths or weaknesses in supplier reliability.
🚚 Use the Logistics & Shipping Section to analyze shipping methods, warehouse performance, and fulfillment efficiency.
📅 Review the Time Analysis Page regularly to monitor monthly and quarterly trends and understand seasonal changes in operations.
📋 Use the Detailed Data View for record-level analysis, quick filtering, sorting, and CSV export.
💡 Apply filters consistently to focus on important trends, identify bottlenecks quickly, and support better decision-making in meetings and reviews.
Who Can Benefit from This Supply Chain Analytics Dashboard in HTML
🏢 Supply Chain Managers who need complete visibility into orders, suppliers, and delivery performance
🚚 Logistics Teams who want to improve shipping and fulfillment efficiency
📦 Warehouse Managers who monitor warehouse-level order performance
📊 Operations Managers who need quick insights for smarter decisions
🛒 E-commerce Businesses managing orders, fulfillment, and returns
🏭 Manufacturing Companies tracking supplier and warehouse operations
💼 Business Analysts who need clear and interactive reporting tools
📈 Growing Businesses looking for a modern dashboard to improve efficiency and reduce costs
This dashboard is more than just a reporting page. It is a smart business tool that helps you improve performance, reduce manual work, and make supply chain decisions with more clarity and confidence. If you want to transform your supply chain data into a practical and professional decision-making system, this product is an excellent investment.
Click hare to read the Detailed blog post
Read the detailed blog post to explore the dashboard features, structure, use cases, and best practices in more depth.