Take your clinical trial reporting to the next level with the Clinical Trials Management KPI Dashboard in Power BI — a smart, interactive, and ready-to-use solution built to simplify complex trial performance tracking. In the healthcare and pharmaceutical industry, managing clinical trials involves handling huge volumes of data across patients, sites, timelines, targets, and compliance measures. When this information is spread across manual spreadsheets and disconnected systems, it becomes difficult to track progress, identify delays, and make timely decisions. That is exactly why this dashboard is such a valuable tool. It brings your most important clinical trial KPIs into one centralized Power BI dashboard, helping you monitor performance clearly, improve efficiency, and make data-driven decisions with confidence. If you want a faster, smarter, and more professional way to manage trial analytics, this dashboard is the perfect solution.
Key Feature of Clinical Trials Management KPI Dashboard in Power BI
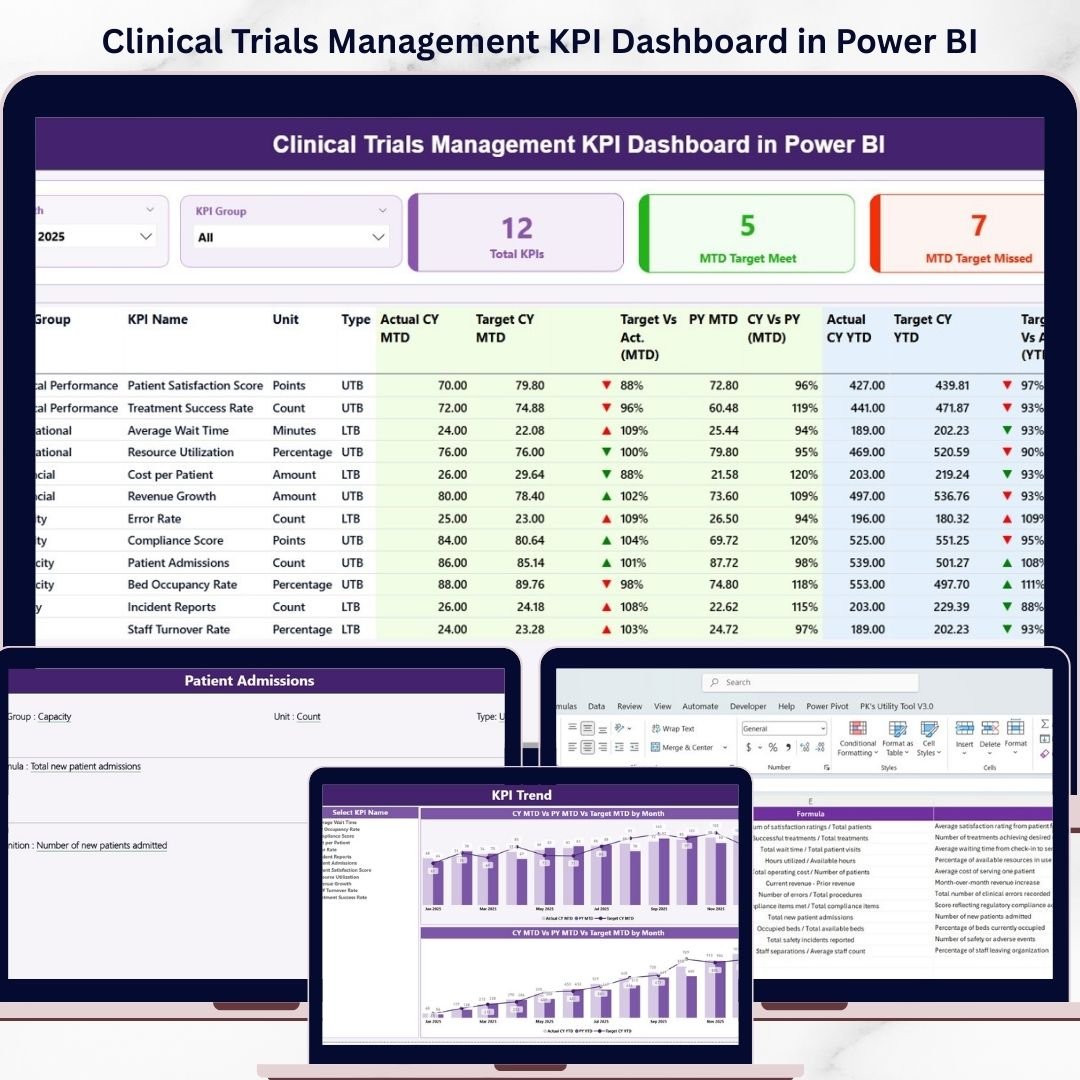
📊 3 Powerful Dashboard Pages – This dashboard includes three professionally designed pages: Summary Page, KPI Trend Page, and KPI Definition Page.
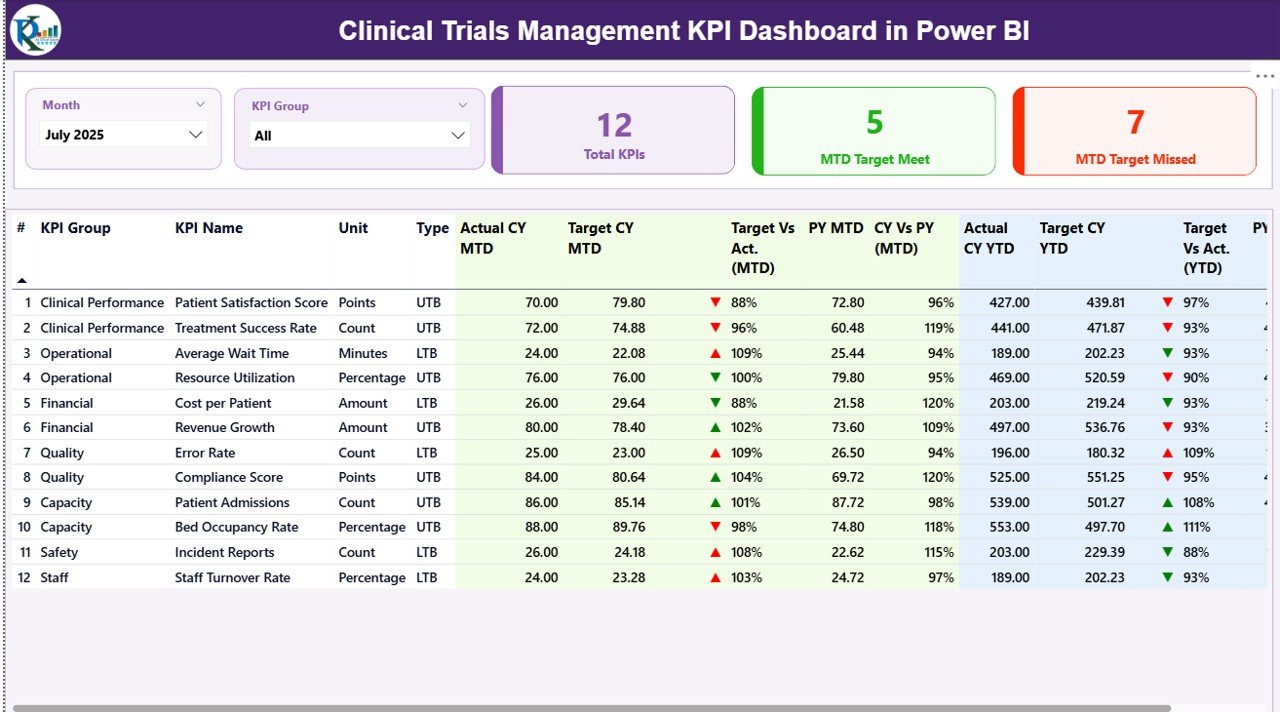
🎯 Complete KPI Summary Page – The Summary Page gives you a full performance snapshot with easy-to-use Month slicer and KPI Group slicer.
📌 Important KPI Cards – Instantly monitor Total KPIs Count, MTD Target Met Count, and MTD Target Missed Count for quick performance reviews.
📋 Detailed KPI Table – Review KPI Number, KPI Group, KPI Name, Unit, KPI Type, Actual CY MTD, Target CY MTD, Previous Year MTD, Actual CY YTD, Target CY YTD, and more in one place.
📈 MTD and YTD Performance Tracking – Compare target vs actual results and current year vs previous year performance using status icons and percentage indicators.
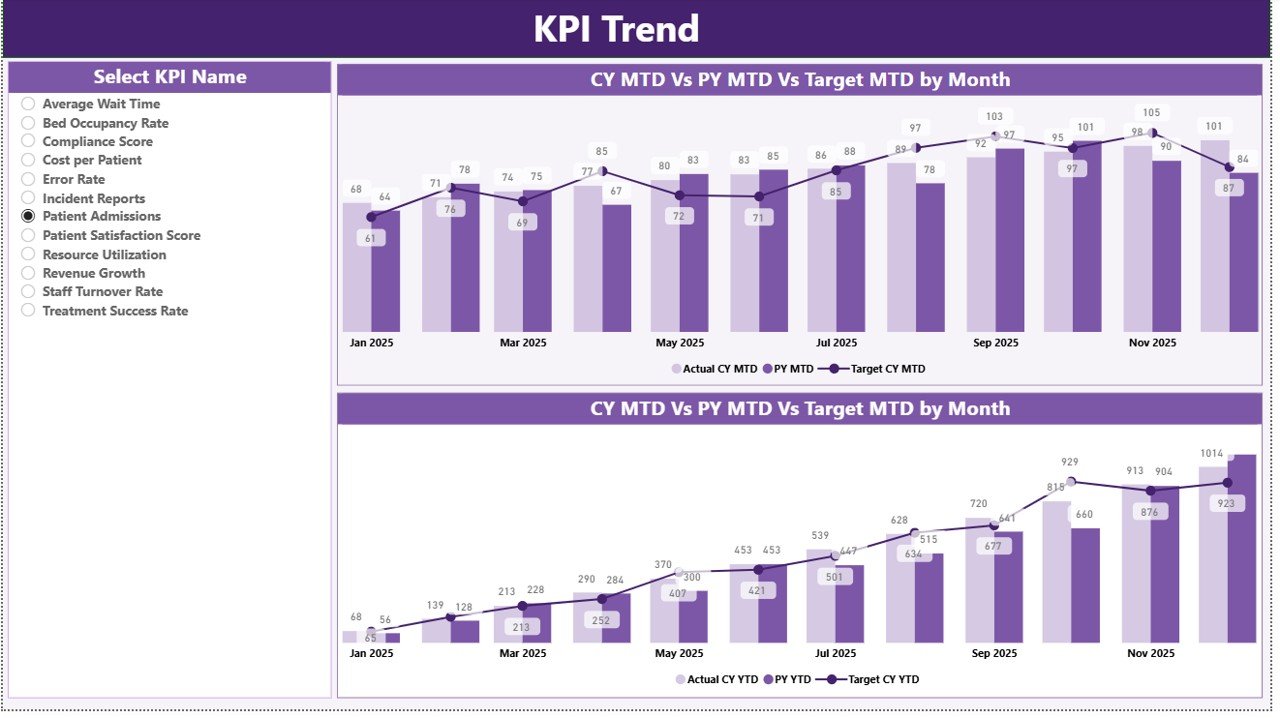
📉 KPI Trend Analysis Page – Study KPI movement over time with two combo charts designed for MTD and YTD comparison.
🔍 KPI Name Slicer – Focus on one KPI at a time and understand its trend, target achievement, and yearly comparison in detail.
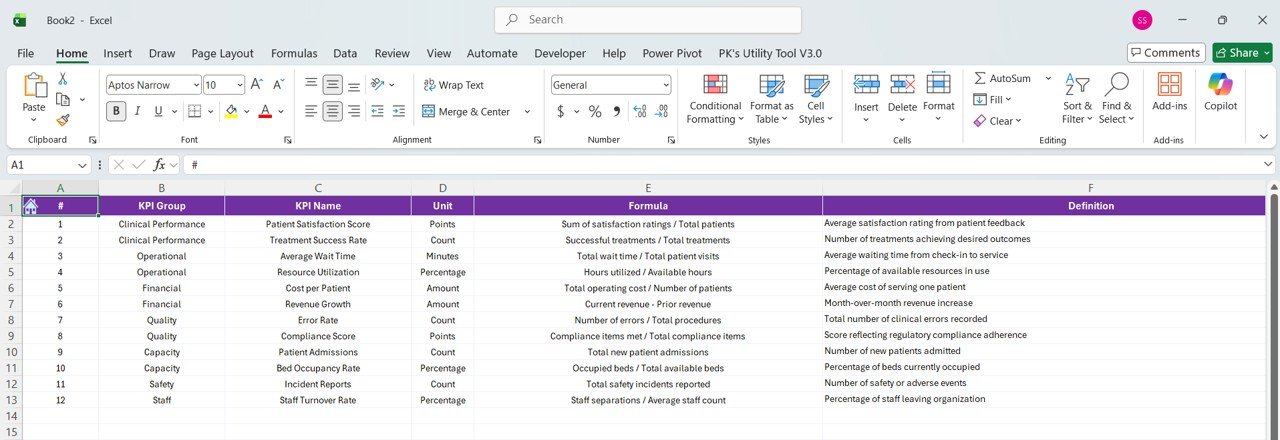
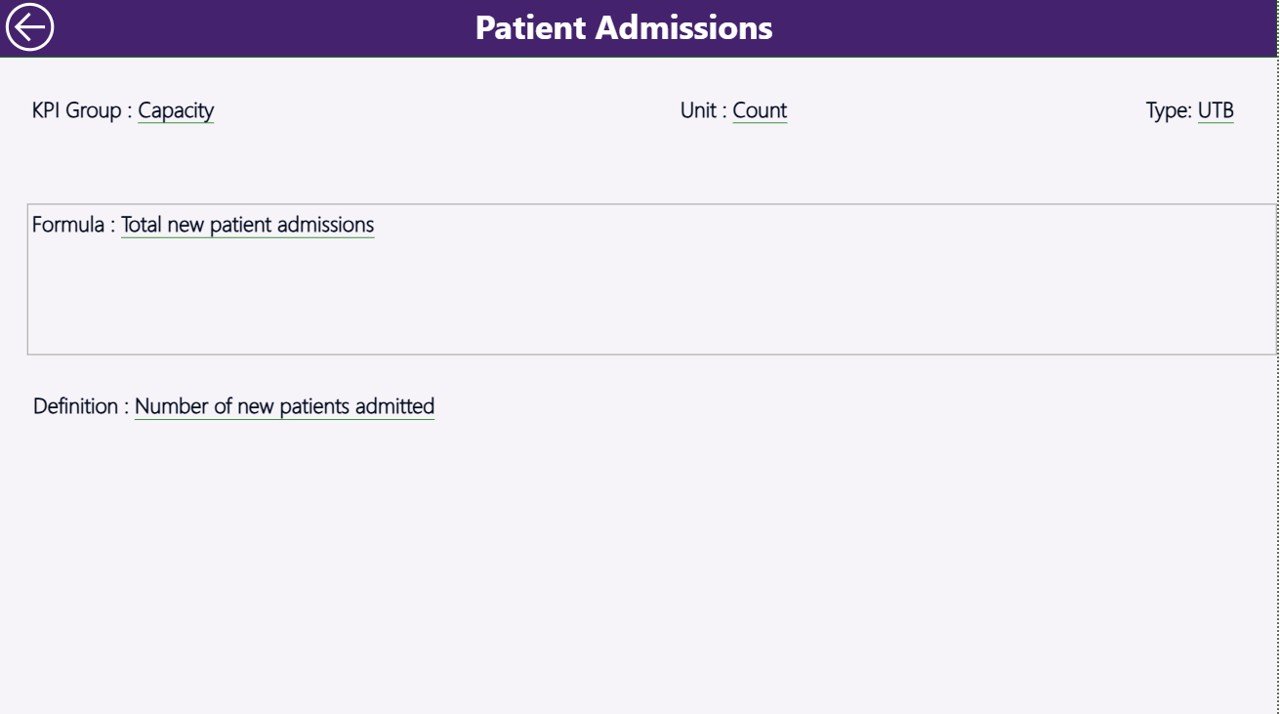
📘 KPI Definition Drill-Through Page – Access KPI formula, definition, and KPI type for complete transparency and understanding.
⚡ Interactive Power BI Features – Use slicers, drill-through navigation, and dynamic visuals for faster and better analysis.
What’s Inside the Clinical Trials Management KPI Dashboard in Power BI
Inside this digital product, you get a fully structured KPI dashboard designed to monitor and analyze clinical trial performance with clarity and speed. It is built to help pharmaceutical companies, CROs, research teams, and healthcare organizations track key clinical trial indicators in one centralized reporting environment.
The dashboard includes three powerful analytical pages.
The Summary Page acts as the main control center where users can filter by month and KPI group while reviewing KPI cards and a detailed KPI table with MTD and YTD performance metrics.
The KPI Trend Page helps users analyze trends over time with two combo charts that compare current year actuals, previous year actuals, and target values.
The KPI Definition Page is a hidden drill-through page that provides KPI formula, KPI definition, and KPI type details, helping users clearly understand how each metric is calculated.
This dashboard uses a structured Excel-based source file with:
-
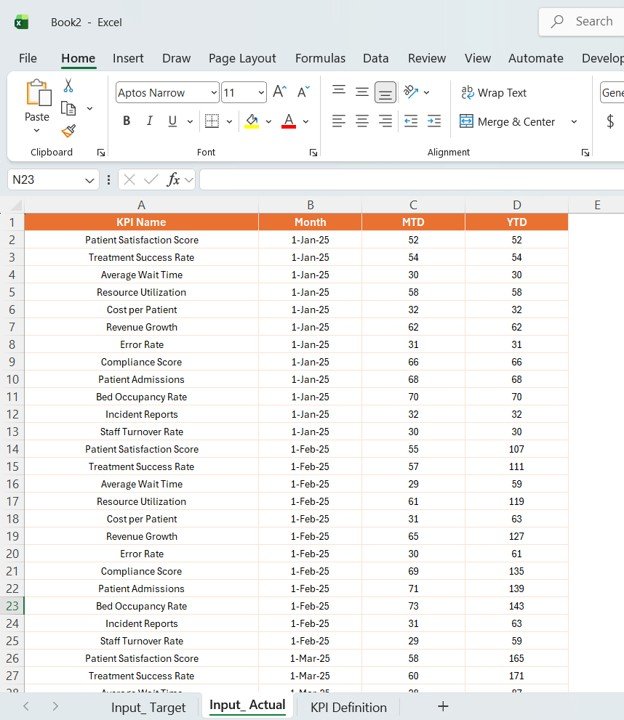
Input_Actual Sheet for actual KPI values
-
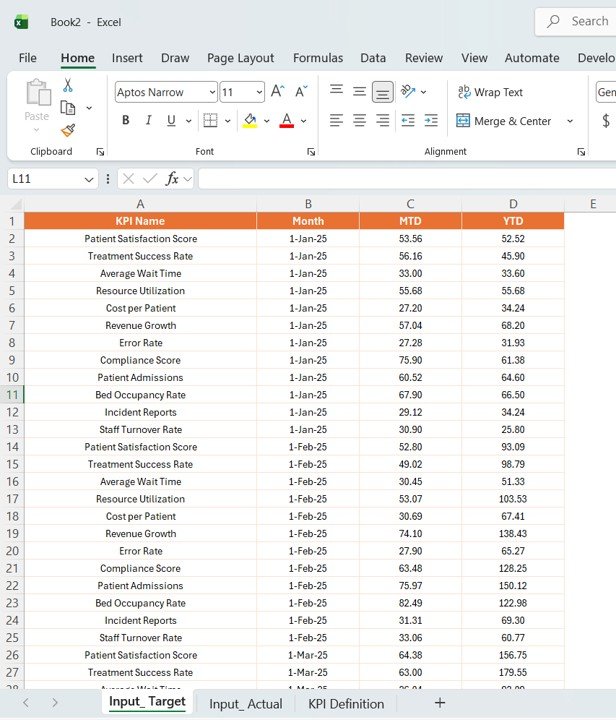
Input_Target Sheet for target KPI values
-
KPI Definition Sheet for KPI setup, definitions, units, formulas, and KPI type
As a result, you get a practical and well-organized reporting tool that simplifies complex clinical trial data analysis.
How to Use the Clinical Trials Management KPI Dashboard in Power BI
🚀 Start by entering your data into the Excel source file. Add actual KPI values into the Input_Actual sheet, target values into the Input_Target sheet, and KPI setup details into the KPI Definition sheet.
📊 Load or refresh the Power BI dashboard so all visuals, cards, and charts update automatically.
🎛️ Use the Month slicer and KPI Group slicer on the Summary Page to focus on specific time periods or KPI categories.
📈 Open the KPI Trend Page to review how selected KPIs perform over time against target values and previous year performance.
📘 Use the drill-through option from the Summary Page to access the KPI Definition Page and understand the formula, KPI logic, and KPI type behind each metric.
💡 Use this dashboard in management meetings, compliance reviews, operational planning sessions, and performance monitoring discussions to make better and faster decisions.
Who Can Benefit from This Clinical Trials Management KPI Dashboard in Power BI
🔬 Clinical Trial Managers who need better visibility into trial performance
🏥 Healthcare Organizations managing complex research and reporting processes
💊 Pharmaceutical Companies looking to monitor progress, targets, and compliance
📊 Clinical Data Analysts who need clear and interactive KPI reporting
🧠 Decision-Makers and Executives who want accurate trial insights in one place
📋 Research Operations Teams who track efficiency, timelines, and risk indicators
🤝 Contract Research Organizations (CROs) that manage multiple study activities
📈 Quality and Compliance Teams who want a more structured way to review clinical KPIs
This dashboard is more than just a report. It is a practical management tool designed to reduce manual effort, improve KPI visibility, and strengthen decision-making across clinical trial operations. If you want clearer reporting, smarter analysis, and stronger operational control, this dashboard is a powerful investment.
Click hare to read the Detailed blog post
Read the complete blog post to explore the full dashboard structure, KPI logic, benefits, and use cases in detail.


