Scale your startup insights like never before with the Avatar Tech Startups Dashboard in Power BI 💡. In today’s fast-growing tech ecosystem, managing data across funding, revenue, employees, churn, and industry performance can be overwhelming.
However, this powerful dashboard simplifies everything. It transforms complex startup data into interactive visuals, real-time insights, and clear performance metrics—all in one place.
With this ready-to-use Power BI solution, you can monitor your startup ecosystem, track growth trends, and make faster, smarter, and data-driven decisions 🚀.
🚀 Key Feature of Avatar Tech Startups Dashboard in Power BI
✅ 📊 Interactive Power BI Dashboard
Experience dynamic charts, slicers, and real-time insights.
✅ 📈 Complete Startup KPI Tracking
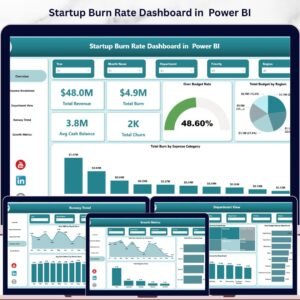
Track revenue, funding, employee count, churn rate, and valuation.
✅ 📅 Multi-Page Analytical Dashboard
Explore insights across 5 structured pages for deep analysis.
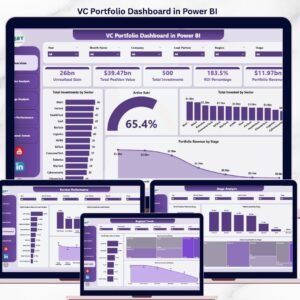
✅ 🌍 Region & Industry Insights
Analyze performance across regions and industry sectors.
✅ 💰 Funding Round Analysis
Understand investment trends and funding efficiency.
✅ 📉 Churn & Growth Monitoring
Identify risks early and track business performance.
✅ ⚡ Real-Time Data Visualization
Make faster decisions with instant data updates.
📦 What’s Inside the Avatar Tech Startups Dashboard in Power BI
This dashboard includes 5 powerful analytical pages:
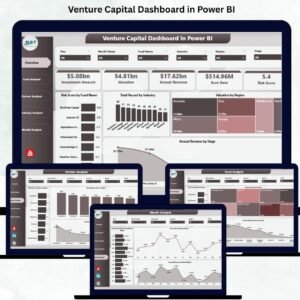
📊 Overview Page – Snapshot of key KPIs with slicers and KPI cards
💰 Funding Round Analysis – Analyze funding trends and investment stages
🌍 Region Analysis – Compare performance across different locations
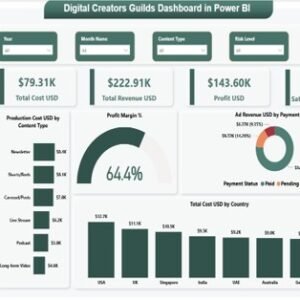
🏭 Industry Sector Analysis – Evaluate startup performance by sector
📅 Month Analysis – Track trends, valuation, and growth over time
Each page is designed to give you a complete 360° view of your startup ecosystem.
⚙️ How to Use the Avatar Tech Startups Dashboard in Power BI
Getting started is simple:
👉 Connect your data source (Excel, SQL, or cloud)
👉 Load data into Power BI
👉 Use slicers to filter by region, industry, or funding round
👉 Analyze KPI cards and charts
👉 Explore trends across multiple pages
Within minutes, you can turn raw startup data into powerful business intelligence 📊.
👨💼 Who Can Benefit from This Avatar Tech Startups Dashboard in Power BI
This dashboard is perfect for:
🚀 Startup Founders – Track growth and performance
💼 Investors & Venture Capitalists – Analyze funding and trends
📊 Business Analysts – Evaluate startup metrics
📈 Finance Teams – Monitor financial performance
📉 Data Analysts – Generate actionable insights
🌍 Consultants – Provide strategic recommendations
Anyone involved in startup growth and investment decisions will benefit from this tool.
🔗 Click hare to read the Detailed blog post
Explore the full guide with detailed features, use cases, and best practices.
👉 Visit our YouTube channel to learn step-by-step video tutorials:
https://youtube.com/@PKAnExcelExpert