The creator economy has transformed how content is produced, shared, and monetized across digital platforms. Today, digital creators produce videos, podcasts, blogs, live streams, and educational content while collaborating within creator guilds and communities. However, managing the financial and operational performance of these creator guilds can quickly become complex.
Guild administrators must track multiple revenue streams, monitor production expenses, evaluate platform engagement, analyze sponsorship income, and measure overall profitability. When this information is managed through scattered spreadsheets or manual reports, it becomes difficult to identify trends or make strategic decisions.
The Digital Creators Guilds Dashboard in Power BI solves this challenge by providing a powerful and interactive business intelligence solution that transforms creator economy data into actionable insights.
This ready-to-use Power BI dashboard converts raw creator data into dynamic KPI cards, visual charts, and interactive reports that help guild managers monitor financial performance, track engagement trends, and evaluate profitability across platforms.
With Power BI’s advanced data visualization capabilities, administrators can analyze key metrics such as production costs, advertising revenue, sponsorship performance, engagement rates, and profit margins. Instead of spending hours preparing manual reports, decision-makers can instantly view important performance insights and make data-driven decisions.
Whether you manage a creator guild, operate a content production agency, or oversee digital content operations, the Digital Creators Guilds Dashboard in Power BI provides a centralized analytics platform to monitor creator performance and optimize business strategies.
🚀 Key Feature of Digital Creators Guilds Dashboard in Power BI
The Digital Creators Guilds Dashboard in Power BI includes powerful analytical features designed to monitor financial and operational performance in the creator economy.
📊 Interactive KPI Overview Dashboard
Monitor creator guild performance through KPI cards displaying total costs, revenue, profit, and satisfaction scores.
📅 Dynamic Dashboard Filters
Use slicers to filter data by categories and analyze performance for different segments easily.
📈 Production Cost Analysis
Track production costs by content type, platform, and country to understand where resources are being used.
💰 Revenue Monitoring
Analyze advertising revenue, sponsorship income, and profitability across platforms.
📉 Profit Margin Tracking
Measure financial performance through profit margin analysis to ensure sustainable growth.
📊 Platform Performance Insights
Identify which platforms generate the most revenue and engagement.
📍 Geographic Cost Distribution
Evaluate operational expenses across different countries.
📈 Monthly Performance Trends
Monitor engagement, costs, and profit trends across months to identify seasonal patterns.
📂 What’s Inside the Digital Creators Guilds Dashboard in Power BI
The dashboard contains five analytical pages designed to provide a complete view of creator guild operations.
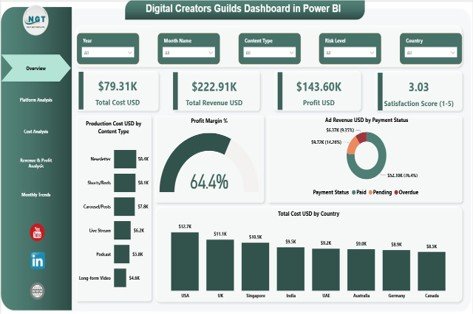
1️⃣ Overview Page
The Overview Page serves as the central monitoring dashboard.
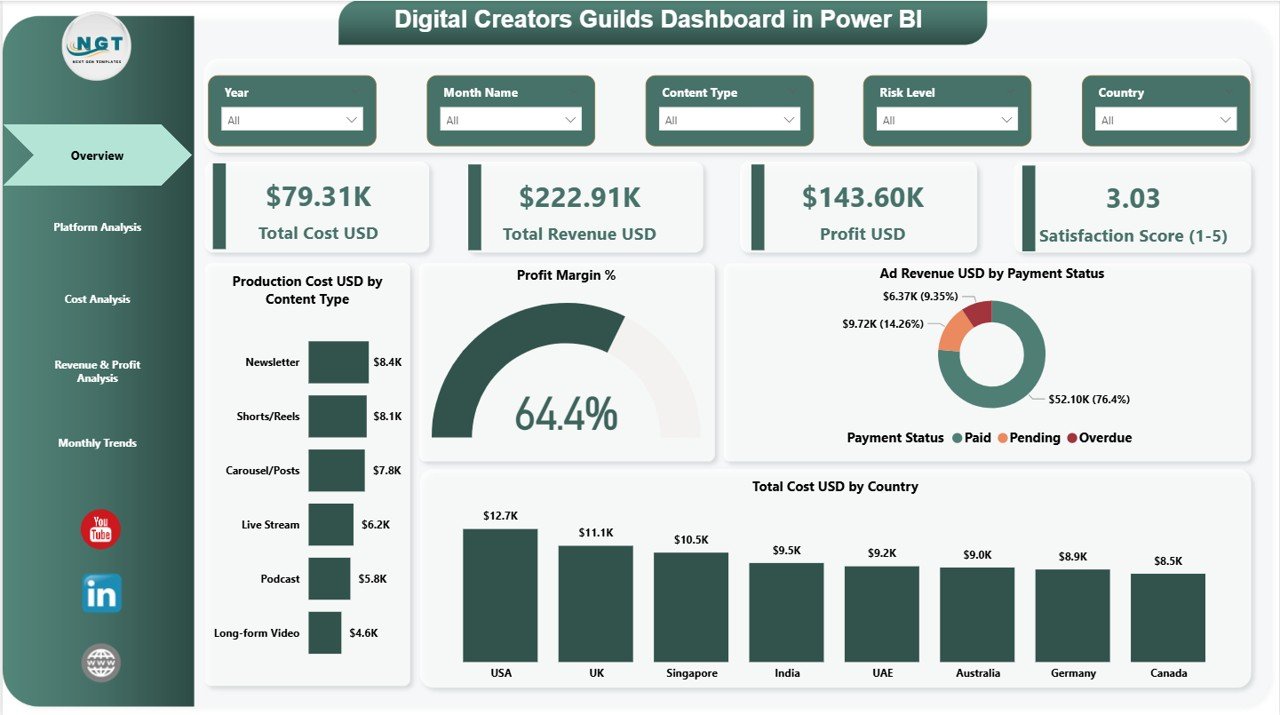
It includes four KPI cards:
• Total Cost (USD)
• Total Revenue (USD)
• Profit (USD)
• Satisfaction Score (1–5)
Additionally, the page contains four analytical charts:
• Production Cost USD by Content Type
• Profit Margin %
• Ad Revenue USD by Payment Status
• Total Cost USD by Country
These visuals provide a high-level overview of guild financial and operational performance.
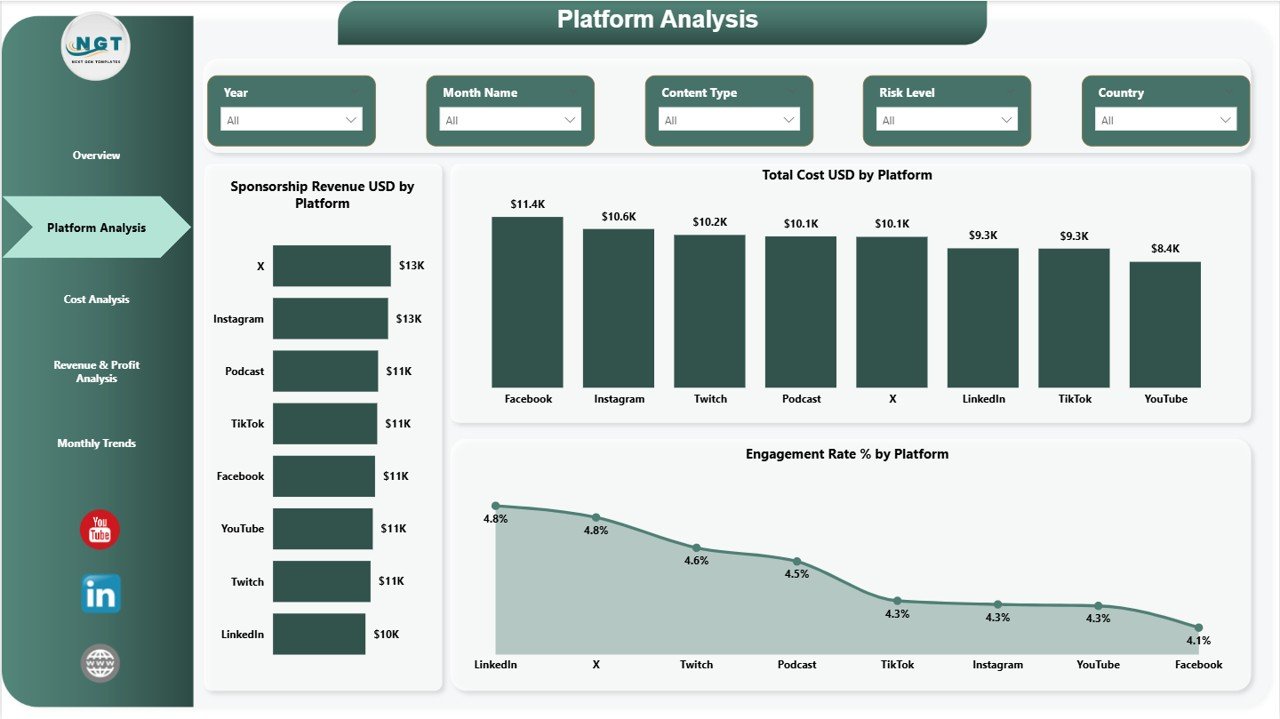
2️⃣ Platform Analysis Page
The Platform Analysis Page evaluates performance across digital platforms.
Charts on this page include:
• Sponsorship Revenue USD by Platform
• Total Cost USD by Platform
• Engagement Rate % by Platform
These insights help managers identify the most profitable platforms and understand audience engagement patterns.
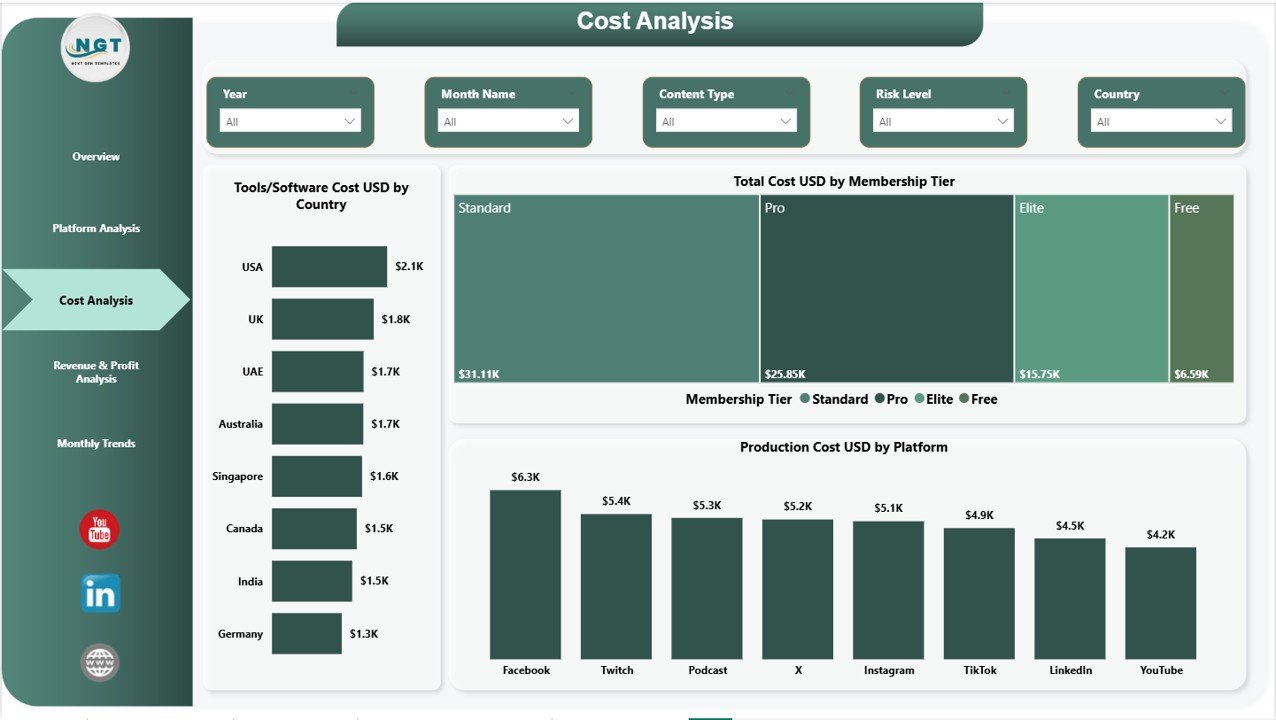
3️⃣ Cost Analysis Page
The Cost Analysis Page focuses on operational expense analysis.
Charts include:
• Tools/Software Cost USD by Country
• Total Cost USD by Membership Tier
• Production Cost USD by Platform
This page helps organizations identify cost drivers and optimize resource allocation.
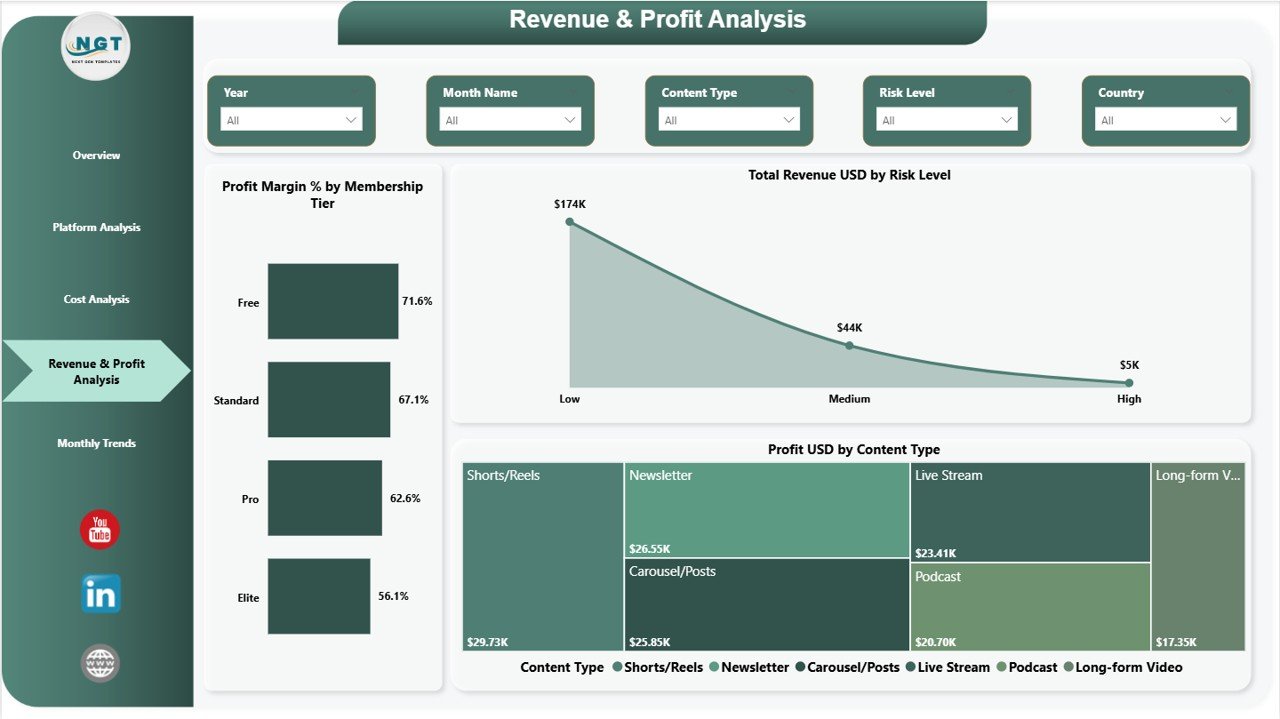
4️⃣ Revenue & Profit Analysis Page
This page analyzes financial performance and profitability.
Charts include:
• Profit Margin % by Membership Tier
• Total Revenue USD by Risk Level
• Profit USD by Content Type
These insights help guild managers evaluate which content types and membership tiers generate the highest profits.
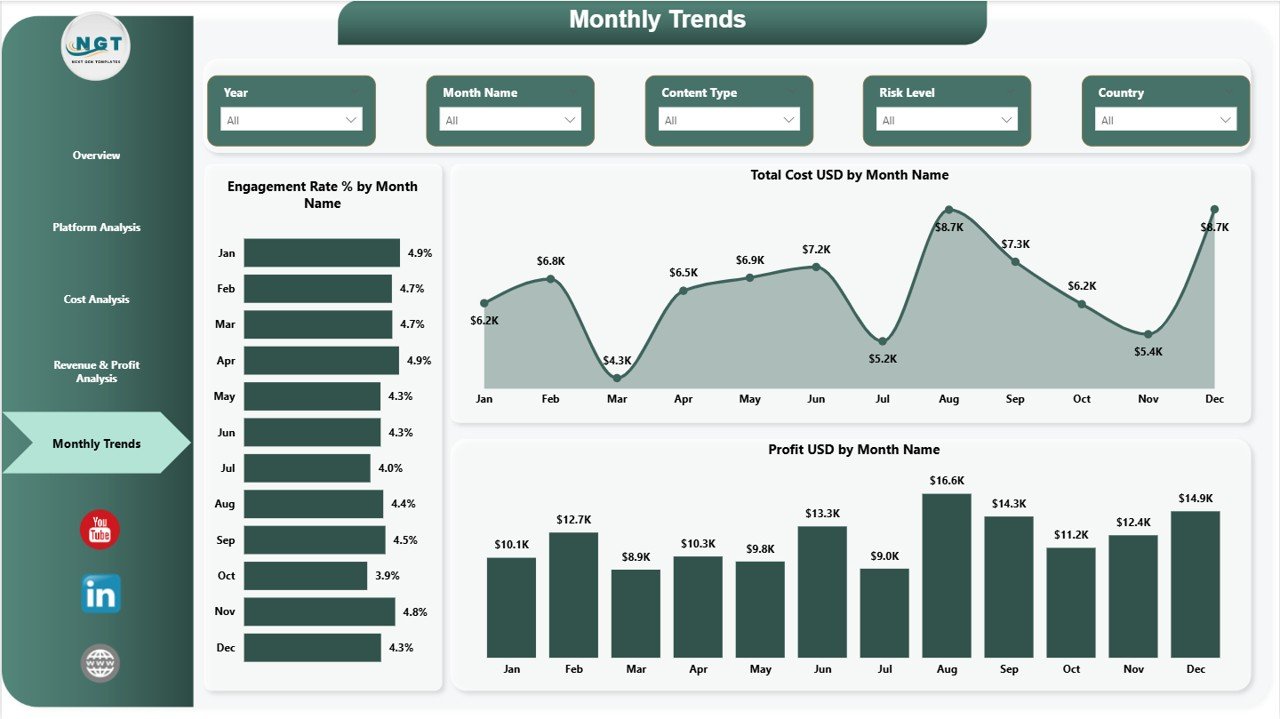
5️⃣ Monthly Trends Page
The Monthly Trends Page analyzes performance patterns over time.
Charts include:
• Engagement Rate % by Month Name
• Total Cost USD by Month Name
• Profit USD by Month Name
This page helps managers identify seasonal engagement patterns, cost fluctuations, and profit trends.
⚙️ How to Use the Digital Creators Guilds Dashboard in Power BI
Using this dashboard is simple and requires only basic Power BI knowledge.
First, connect the dashboard to your data source such as Excel or other databases containing creator guild data.
Once the data is loaded, the dashboard automatically converts raw data into interactive visuals and KPI indicators.
Users can apply filters and slicers to analyze specific platforms, content types, or financial metrics.
Managers can also use different analytical pages to evaluate costs, revenue streams, engagement metrics, and monthly performance trends.
By reviewing these insights regularly, guild administrators can make better decisions about platform investments, sponsorship strategies, and content production planning.
👥 Who Can Benefit from This Digital Creators Guilds Dashboard
The Digital Creators Guilds Dashboard in Power BI is ideal for organizations operating within the creator economy.
🎥 Digital Creator Guild Managers – Monitor financial performance and creator engagement.
📊 Content Production Agencies – Track production costs, revenue streams, and profitability.
💼 Creator Economy Platforms – Analyze performance across multiple creators and platforms.
📈 Marketing & Media Agencies – Monitor content engagement and sponsorship performance.
🎙 Podcast Networks & Streaming Teams – Evaluate platform performance and audience engagement.
🚀 Digital Business Strategists – Use analytics insights to grow creator ecosystems.
By using this dashboard, organizations gain better financial visibility, stronger strategic insights, and improved creator collaboration.
Click here to read the Detailed blog post
Visit our YouTube channel to learn step-by-step video tutorials
https://youtube.com/@PKAnExcelExpert