Artificial Intelligence is rapidly transforming modern organizations. Businesses now rely on AI models for fraud detection, customer service automation, predictive analytics, marketing optimization, and strategic decision-making. However, as AI adoption increases, organizations must also manage AI risks, compliance requirements, data sensitivity, and governance policies.
Without proper monitoring, AI models may introduce ethical risks, regulatory violations, biased decisions, or financial exposure. Therefore, companies require a structured governance system to monitor AI performance, risk levels, and compliance metrics effectively.
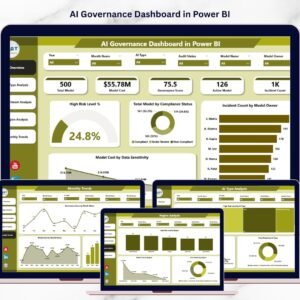
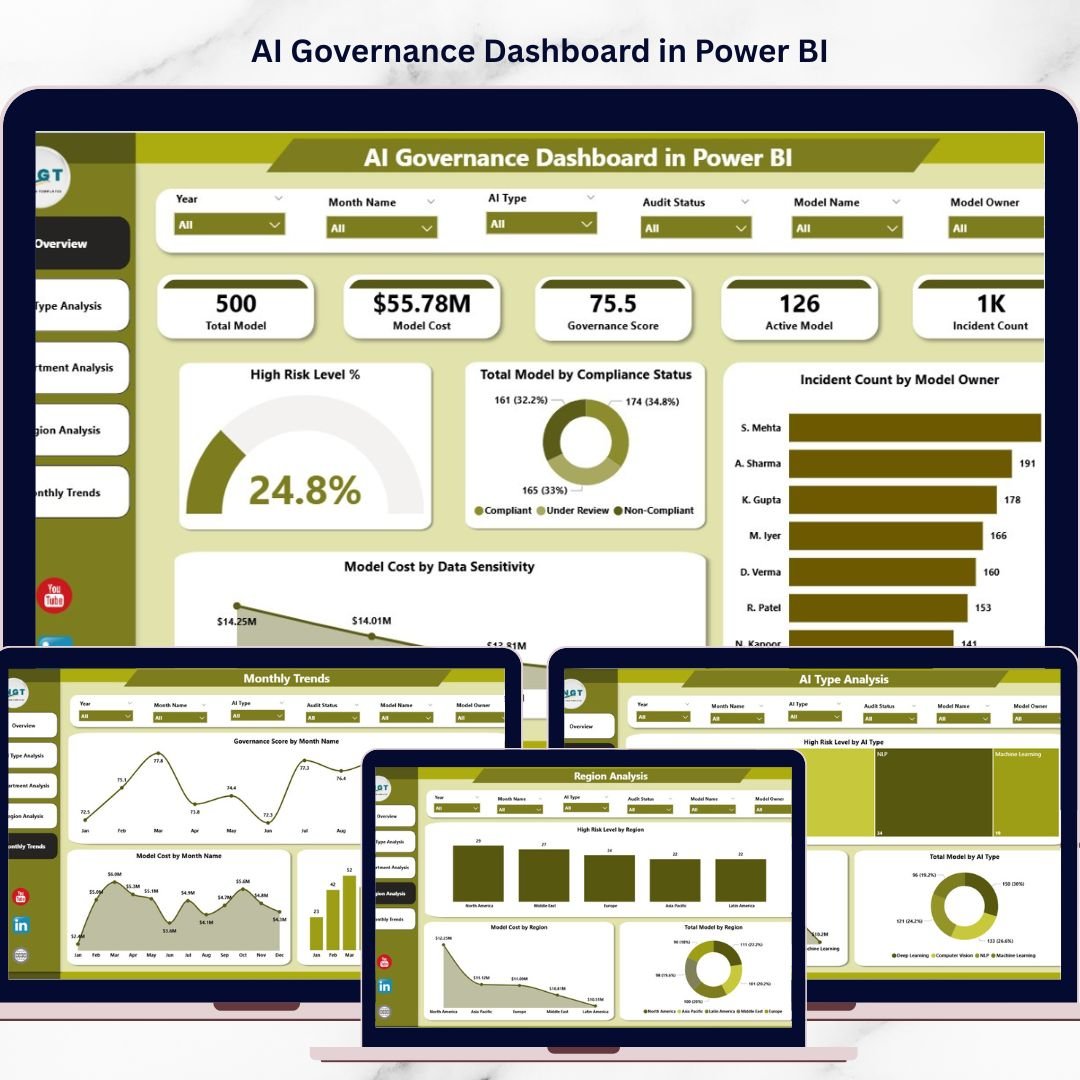
This is exactly where the AI Governance Dashboard in Power BI becomes extremely valuable.
The AI Governance Dashboard in Power BI is a powerful business intelligence solution designed to track AI model governance, compliance status, risk levels, operational costs, and incident trends using interactive visual analytics. Instead of reviewing scattered spreadsheets or reports, organizations can monitor everything through a centralized Power BI dashboard.
Because Power BI provides interactive charts, slicers, dynamic filtering, and real-time analytics, decision-makers can easily identify governance risks, compliance gaps, and operational inefficiencies.
As a result, organizations can maintain transparency, accountability, and responsible AI management.
🤖 Key Feature of AI Governance Dashboard in Power BI
The dashboard includes powerful analytics features designed to help organizations manage AI governance effectively.
📊 Centralized AI Governance Monitoring – Track AI models, compliance status, and governance metrics in a single dashboard.
⚠️ AI Risk Level Monitoring – Identify high-risk AI models across departments and regions.
📋 Compliance Status Tracking – Monitor compliant, under-review, and non-compliant AI systems.
💰 AI Model Cost Analysis – Evaluate operational costs of AI models based on usage and data sensitivity.
🏢 Department-Level Governance Insights – Track AI adoption and governance compliance across departments.
🌍 Regional AI Governance Analysis – Evaluate governance performance across geographic regions.
🤖 AI Type Performance Monitoring – Analyze governance metrics across different AI technologies.
📅 Monthly Governance Trend Analysis – Track governance scores, model deployment growth, and cost trends over time.
📊 Interactive KPI Cards and Visual Charts – Monitor governance indicators instantly.
⚡ Dynamic Filtering and Slicers – Drill down into governance insights quickly.
These features help organizations reduce AI risks, maintain regulatory compliance, and improve governance transparency.
📦 What’s Inside the AI Governance Dashboard in Power BI
The dashboard includes five analytical pages, each designed to monitor a different aspect of AI governance performance.
Overview Page – Central Governance Monitoring
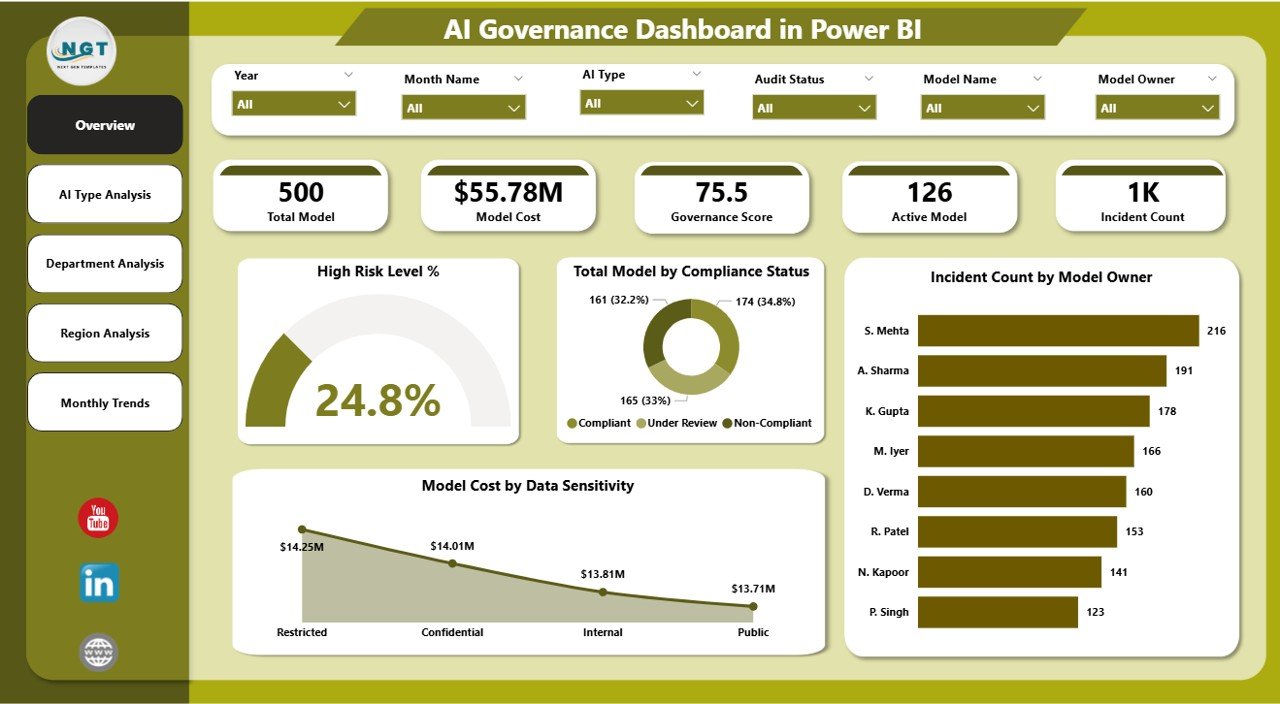
The Overview Page serves as the main control panel for monitoring AI governance metrics.
This page contains interactive slicers that allow users to filter data by department, region, or AI model type.
KPI Cards on the Overview Page
The dashboard displays important governance indicators including:
• High Risk Level %
• Total Model by Compliance Status
• Incident Count by Model Owner
• Model Cost by Data Sensitivity
These KPI cards allow leadership teams to quickly evaluate AI governance health and risk exposure.
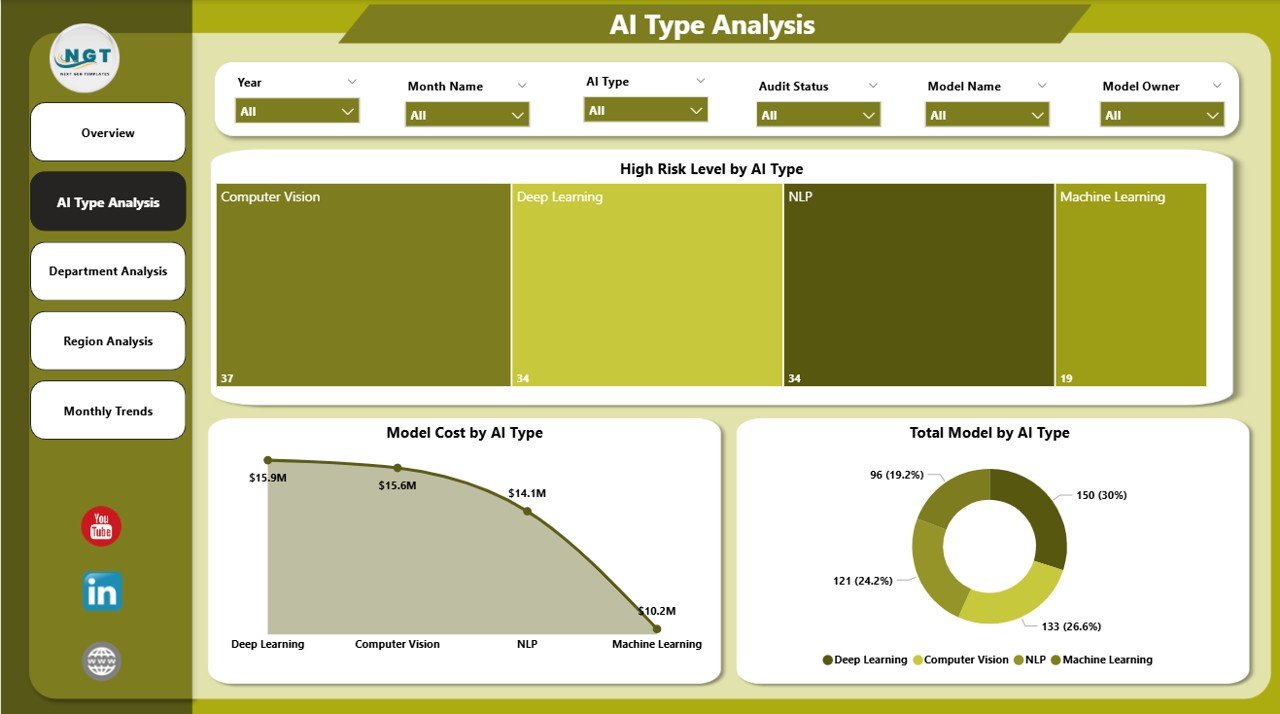
AI Type Analysis – Monitoring AI Technology Risk
Organizations deploy different types of AI technologies, such as:
• Machine Learning
• Natural Language Processing
• Computer Vision
• Recommendation Engines
Charts Included
• High Risk Level by AI Type
• Model Cost by AI Type
• Total Model by AI Type
This page helps organizations identify:
• AI technologies with higher governance risks
• AI categories with higher operational costs
• AI technologies requiring stronger compliance monitoring
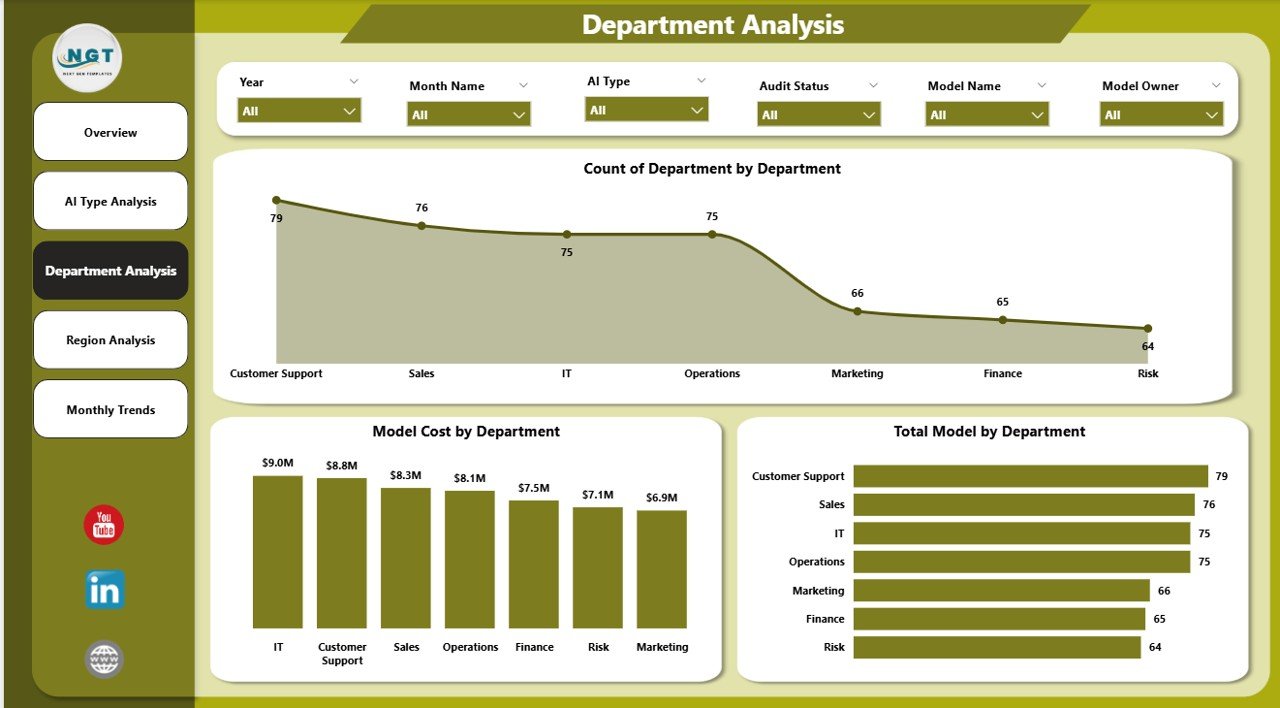
Department Analysis – Governance Across Business Units
Different departments deploy AI models for various business operations.
For example:
• Marketing uses AI for campaign optimization
• Finance uses AI for fraud detection
• HR uses AI for recruitment analytics
Charts Included
• Governance Score by Department
• Model Cost by Department
• Total Model by Department
This analysis helps organizations identify departments that require stronger AI governance oversight.
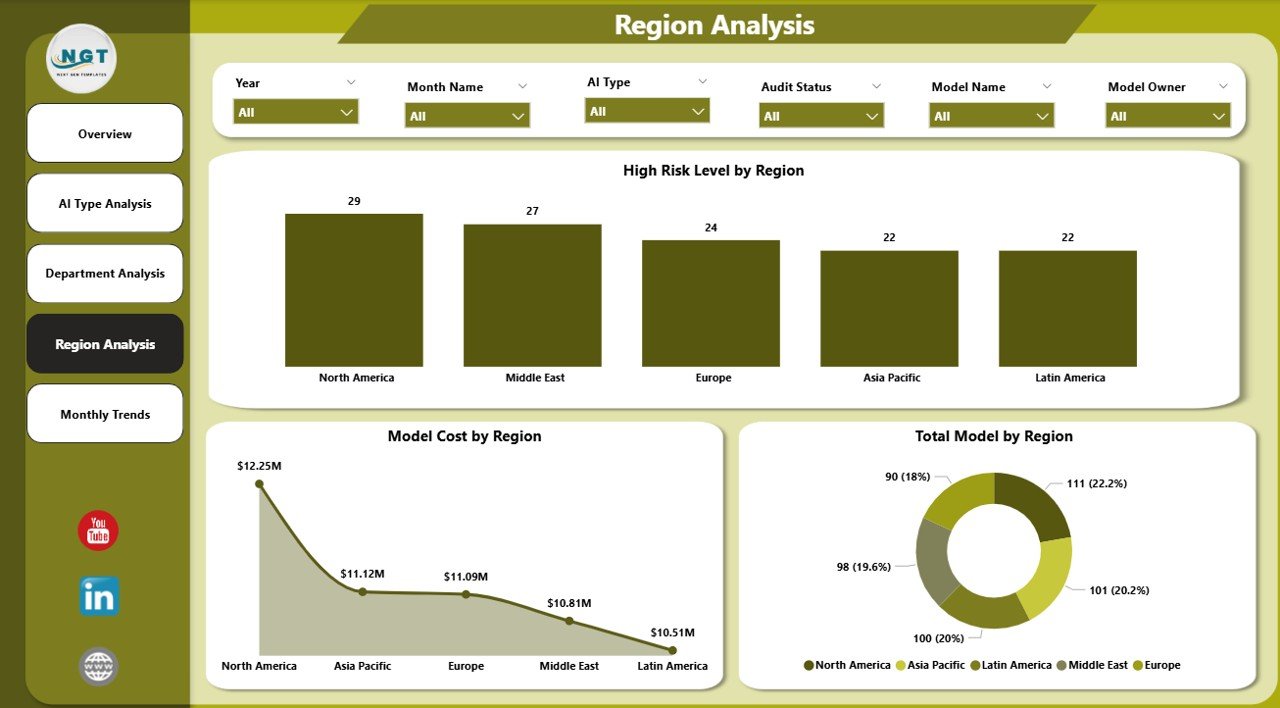
Region Analysis – Global AI Governance Insights
Large organizations deploy AI systems across multiple geographic regions.
However, regulatory requirements and governance standards may vary across locations.
Charts Included
• High Risk Level by Region
• Model Cost by Region
• Total Model by Region
These insights help organizations maintain consistent governance practices across global operations.
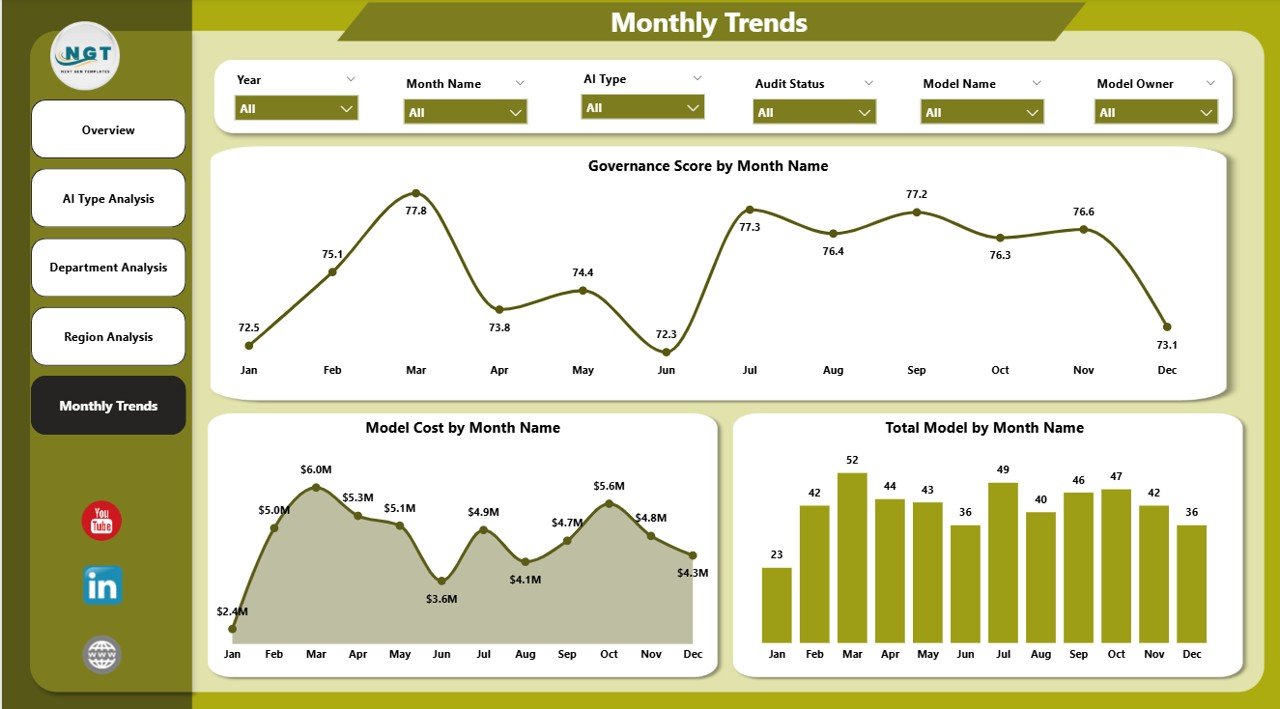
Month Analysis – Monitoring Governance Trends
AI governance requires continuous monitoring and improvement.
Charts Included
• Governance Score by Month
• Model Cost by Month
• Total Model by Month
This analysis helps organizations monitor:
• AI adoption trends
• Governance improvements
• Cost fluctuations over time
Consequently, leadership teams can evaluate long-term governance performance.
⚙️ How to Use the AI Governance Dashboard
Using the dashboard is simple and efficient.
1️⃣ Upload AI governance data into the dataset.
2️⃣ Include fields such as AI model type, compliance status, risk level, department, region, and operational cost.
3️⃣ Refresh the Power BI dashboard to update visuals.
4️⃣ Use slicers to filter data by AI type, department, or region.
5️⃣ Analyze charts and KPIs to identify governance risks and opportunities.
Once the dataset updates, the dashboard automatically reflects the latest governance insights.
👥 Who Can Benefit from This Dashboard
The AI Governance Dashboard in Power BI is useful for many professionals managing AI systems.
It is particularly valuable for:
🤖 AI Governance Teams
📊 Data Science Teams
⚠️ Risk Management Professionals
⚖️ Compliance Officers
💻 Technology Leaders
🏢 Executive Leadership
Because the dashboard provides centralized governance analytics, it helps organizations ensure responsible and transparent AI deployment.
💡 Advantages of AI Governance Dashboard in Power BI
Organizations gain several strategic benefits from implementing this dashboard.
✔ Centralized monitoring of AI governance metrics
✔ Faster identification of high-risk AI models
✔ Improved compliance tracking
✔ Clear visualization of governance performance
✔ Department-level accountability for AI usage
✔ Regional governance performance monitoring
✔ Real-time analytics for AI oversight
✔ Data-driven decision-making for responsible AI
Instead of relying on scattered reports, organizations can use Power BI dashboards to manage AI governance efficiently.
This dashboard transforms complex governance data into clear visual insights that help organizations maintain responsible AI systems.
### Click here to read the Detailed blog post
Visit our YouTube channel to learn step-by-step video tutorials
https://youtube.com/@PKAnExcelExpert