Artificial Intelligence has revolutionized the creative industry. Today, AI art studios use advanced tools such as generative AI models, image generators, and machine learning platforms to create stunning digital artwork. These studios often handle multiple clients, art categories, AI tools, and sales platforms simultaneously.
However, managing creative projects, production costs, revenue streams, and profitability becomes difficult when studios rely on scattered spreadsheets or manual reports. Managers often struggle to identify which art categories perform best, which AI tools deliver higher profits, and which platforms generate the most sales.
This is where the AI Art Studios Dashboard in Excel becomes an extremely powerful solution.
The AI Art Studios Dashboard in Excel is a ready-to-use analytics template designed to track studio revenue, project completion rates, production costs, and profitability across multiple categories, clients, and platforms.
Because Excel provides powerful tools such as pivot tables, pivot charts, slicers, and automated calculations, this dashboard converts raw studio data into interactive visual insights. As a result, studio managers can easily monitor performance and make smarter business decisions.
🎨 Key Feature of AI Art Studios Dashboard in Excel
This dashboard provides powerful analytical features designed specifically for AI-based creative studios.
📊 Centralized Studio Performance Monitoring – Track revenue, costs, profits, and project completion in one dashboard.
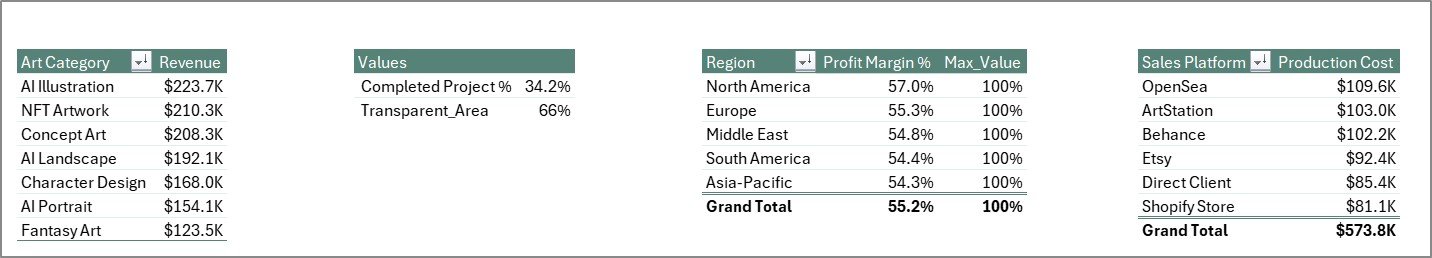
📈 Revenue Analysis by Art Category – Identify which digital art styles generate the most revenue.
💰 Profit Margin Analysis by Region – Monitor profitability across global markets.
📉 Production Cost Tracking by Sales Platform – Evaluate cost efficiency across platforms.
🤖 AI Tool Performance Monitoring – Identify which AI tools generate the highest revenue and profit.
👥 Client Type Profitability Analysis – Understand which customer segments are most valuable.
📅 Monthly Performance Monitoring – Track revenue, profit, and cost trends over time.
🔎 Interactive Slicers and Filters – Drill down into studio data using Excel slicers.
📊 Pivot Table and Chart Analytics – Explore performance insights dynamically.
⚡ Automatic Dashboard Updates – Refresh data to instantly update analytics.
These features help studios optimize creative production, reduce costs, and maximize profitability.
📦 What’s Inside the AI Art Studios Dashboard in Excel
This dashboard contains five analytical pages, each designed to analyze a different aspect of studio performance.
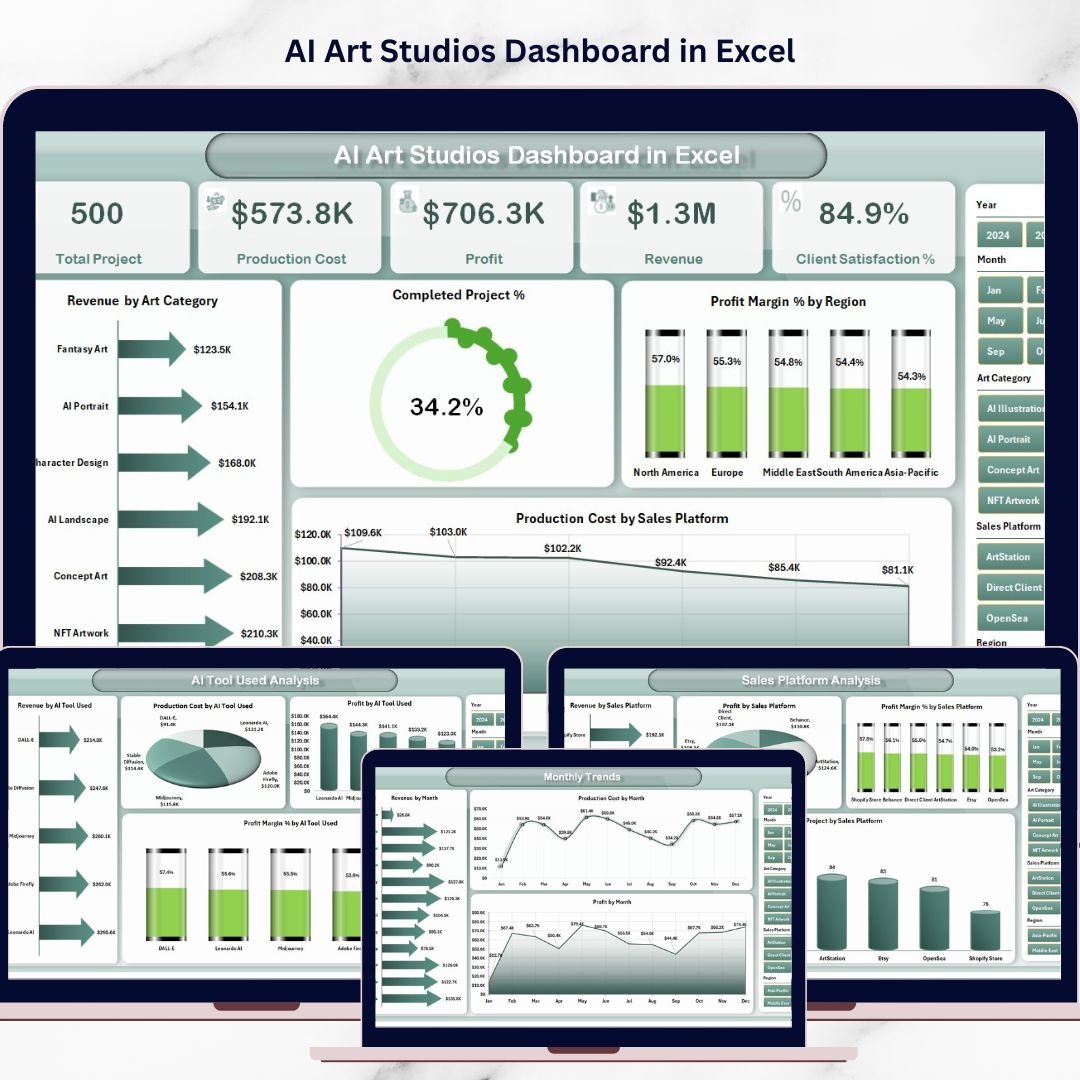
Overview Page – Complete Studio Performance Snapshot
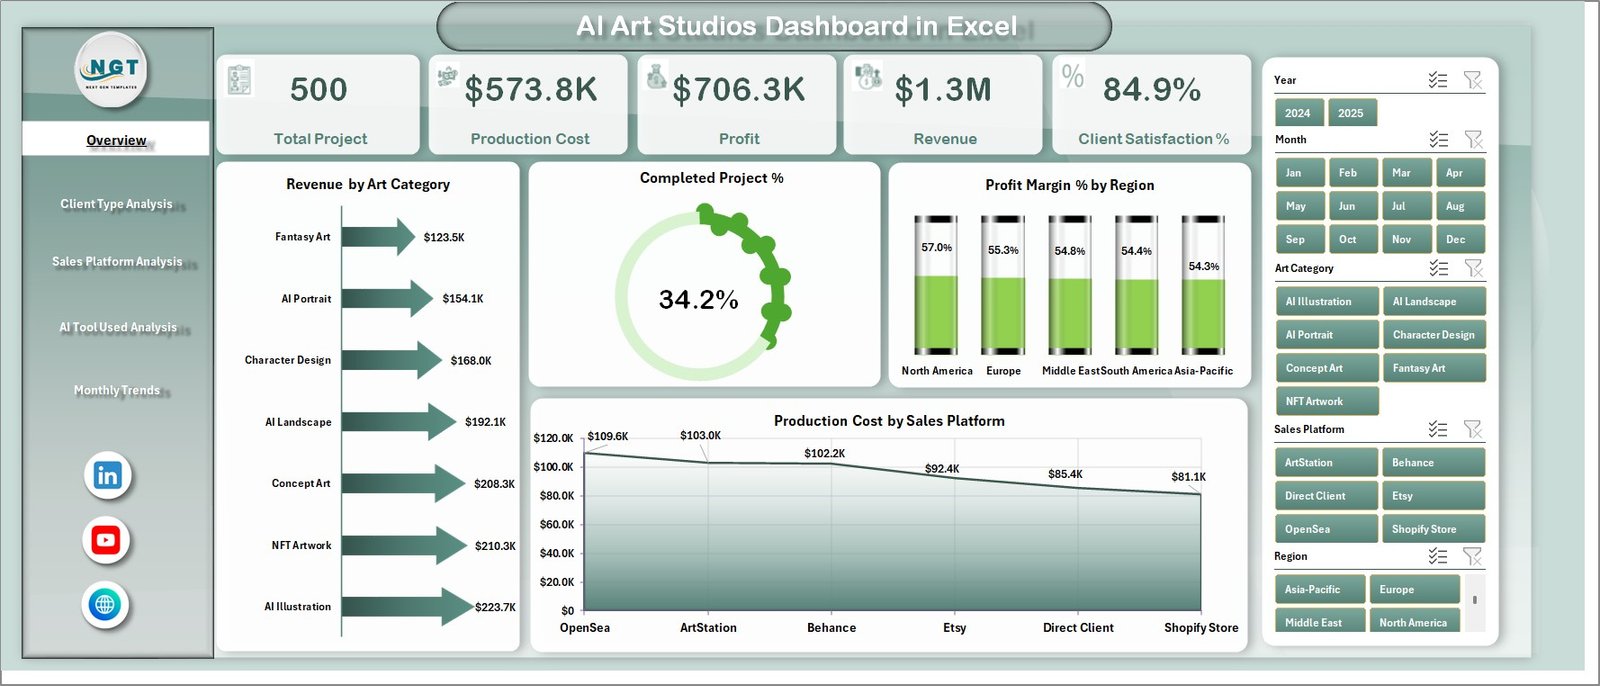
The Overview Page acts as the main dashboard interface where managers can quickly evaluate overall studio performance.
Key Elements on the Overview Page
• Interactive slicer panel for filtering
• Four KPI cards summarizing performance metrics
Charts Included
• Revenue by Art Category
• Completed Project Percentage
• Profit Margin % by Region
• Production Cost by Sales Platform
This page provides a quick overview of studio operations and performance trends.
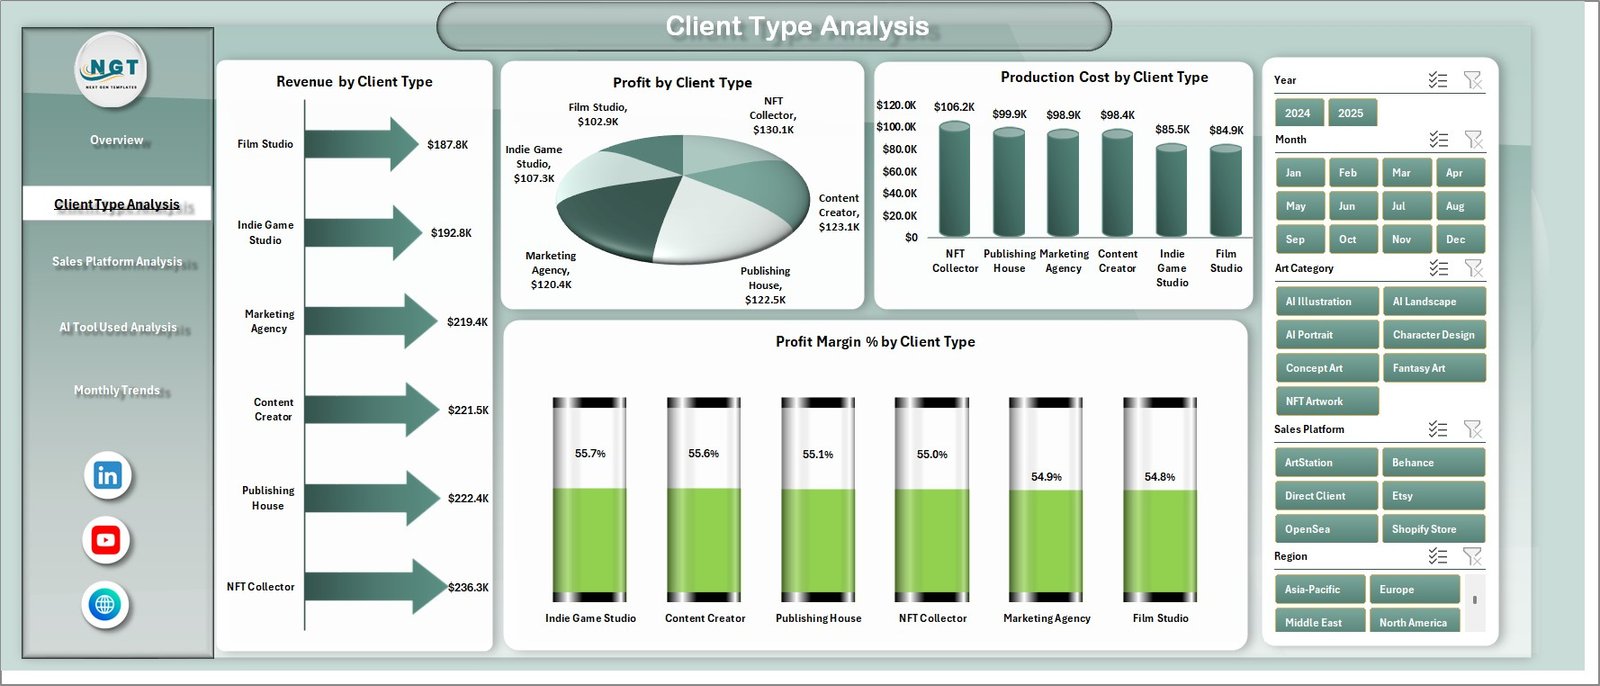
Client Type Analysis – Understanding Client Profitability
Different clients generate different revenue levels. Therefore, analyzing client performance is essential.
Charts Included
• Revenue by Client Type
• Profit by Client Type
• Production Cost by Client Type
• Profit Margin % by Client Type
This analysis helps studios identify:
• High-value clients
• Low-profit segments
• Cost efficiency by client type
Consequently, studios can optimize pricing strategies and client targeting.
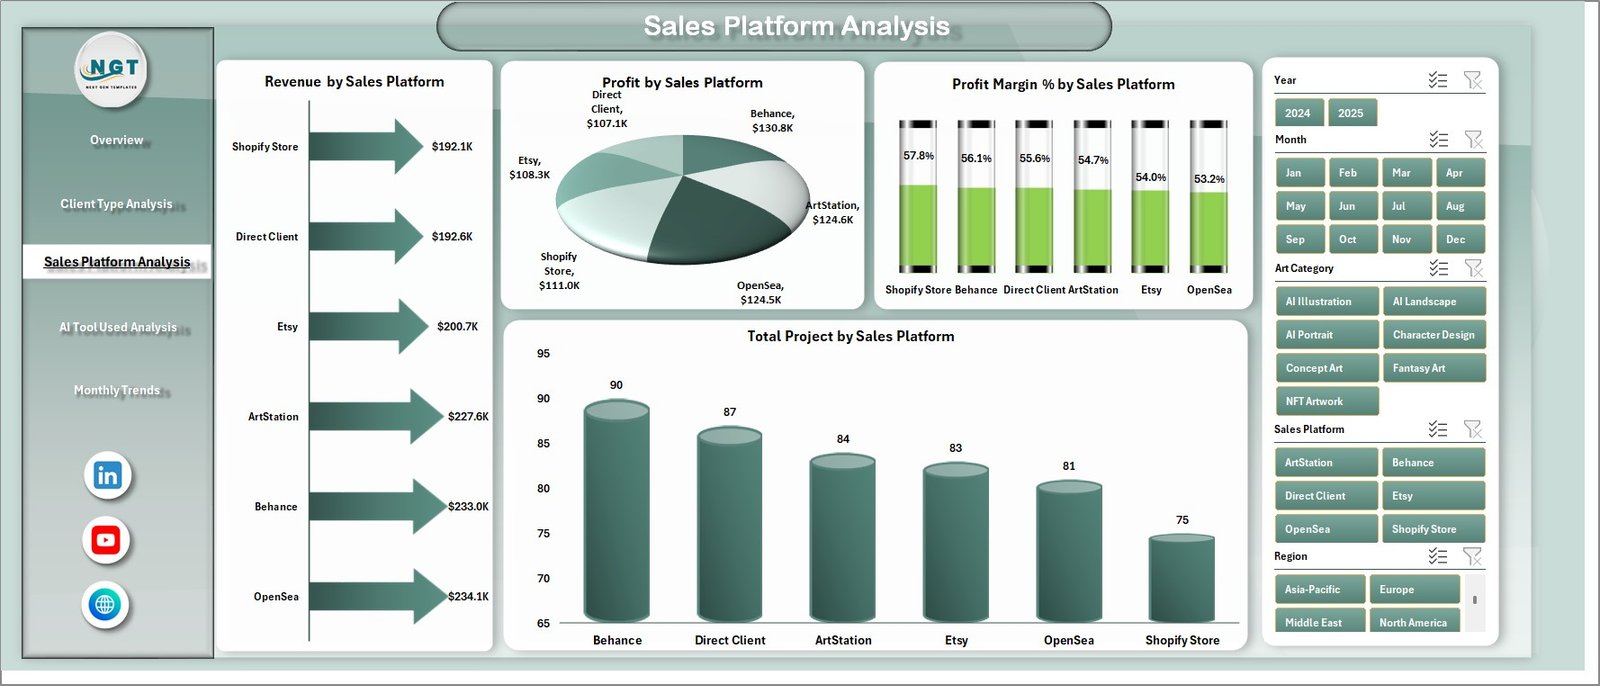
Sales Platform Analysis – Platform Performance Insights
AI art studios sell artwork across multiple platforms including:
• Online marketplaces
• Freelance platforms
• NFT marketplaces
• Direct websites
• Social media platforms
Charts Included
• Revenue by Sales Platform
• Profit by Sales Platform
• Total Projects by Sales Platform
• Profit Margin % by Sales Platform
This analysis helps studios identify the most profitable sales channels.
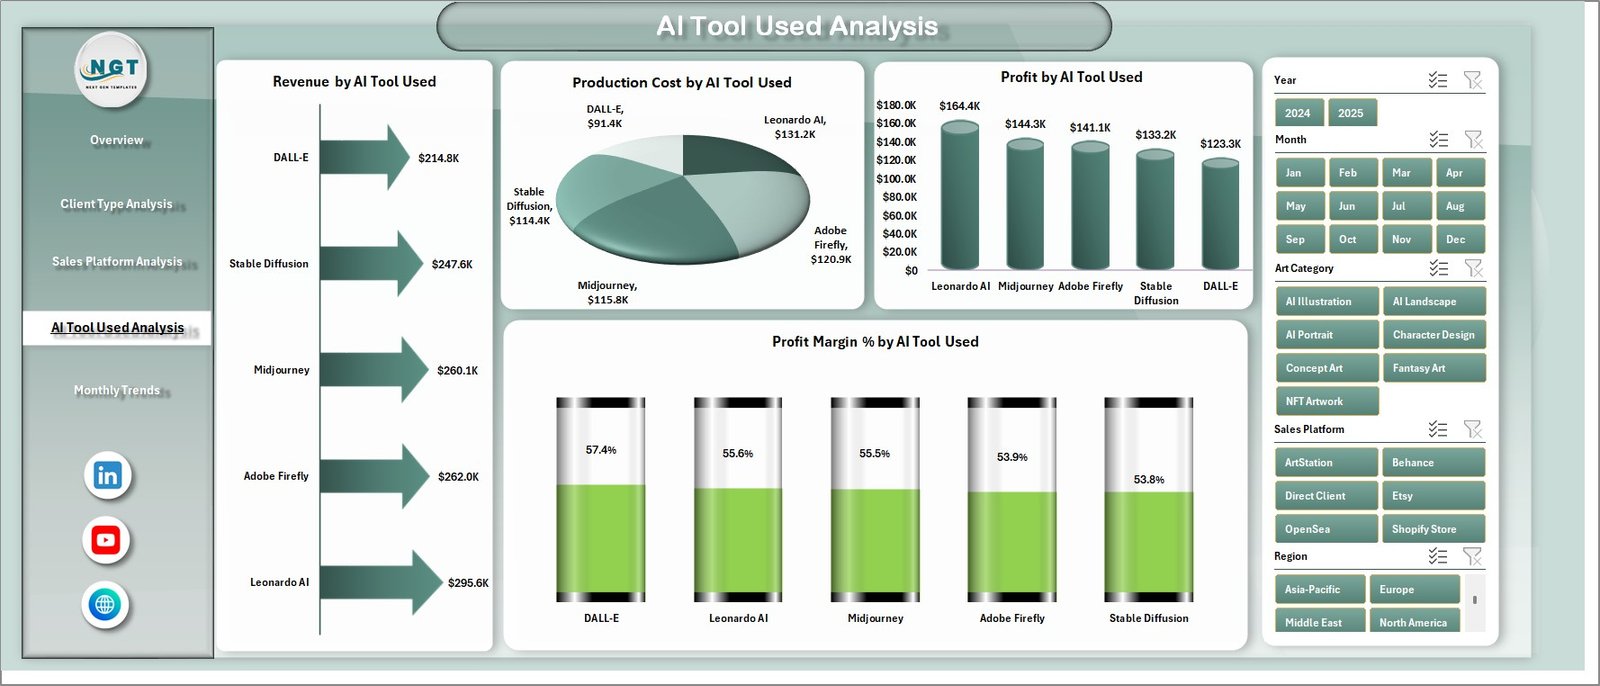
AI Tool Used Analysis – Evaluating Creative Technology
AI art studios often use multiple AI tools for generating artwork.
However, not all tools provide the same level of efficiency or profitability.
Charts Included
• Revenue by AI Tool Used
• Profit by AI Tool Used
• Production Cost by AI Tool Used
• Profit Margin % by AI Tool Used
This analysis helps studios determine:
• Most profitable AI tools
• Tools that reduce production costs
• Tools that increase project output
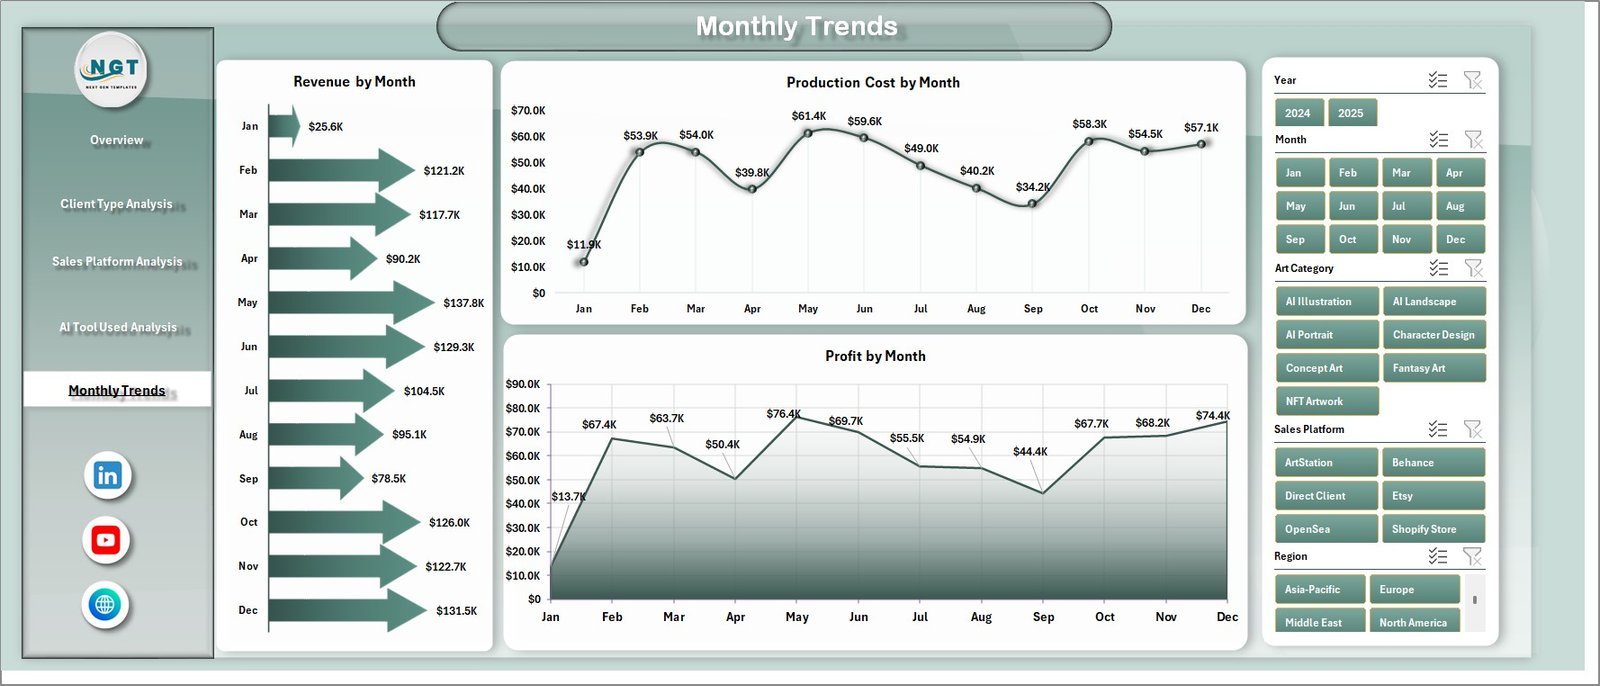
Month Analysis – Tracking Studio Growth Trends
Monthly performance tracking helps studios monitor business growth and seasonal demand patterns.
Charts Included
• Revenue by Month
• Profit by Month
• Production Cost by Month
This analysis helps managers identify:
• High-performing months
• Seasonal revenue patterns
• Cost fluctuations over time
⚙️ How to Use the AI Art Studios Dashboard
Using this dashboard is simple and efficient.
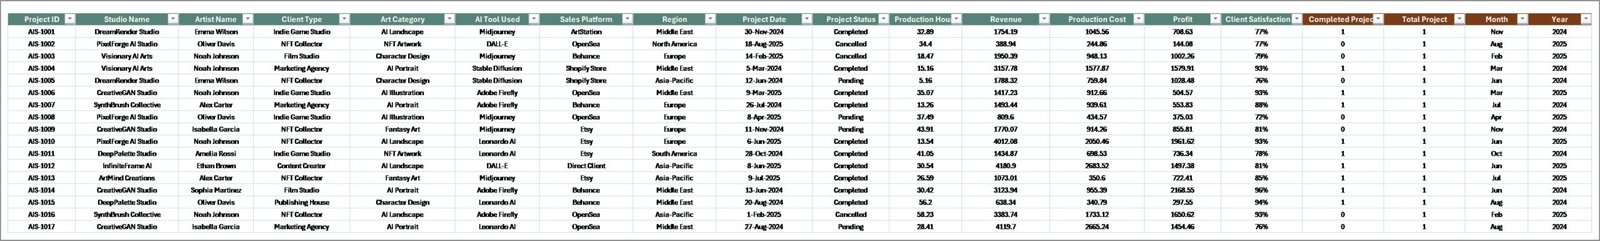
1️⃣ Enter project data in the Data Sheet.
2️⃣ Include fields such as art category, client type, platform, AI tool, revenue, and cost.
3️⃣ Refresh pivot tables to update the dashboard.
4️⃣ Use slicers to filter data by category, client type, or platform.
5️⃣ Analyze charts and KPIs to evaluate studio performance.
Once the dataset updates, the dashboard automatically refreshes insights.
👥 Who Can Benefit from This Dashboard
This dashboard is ideal for professionals working in digital creative industries.
It is particularly useful for:
🎨 AI Art Studios
🖌 Digital Artists
🖼 NFT Creators
🏢 Creative Agencies
📊 Digital Content Studios
📈 Creative Business Analysts
Because the dashboard combines operational and financial insights, it supports both creative teams and business managers.
💡 Advantages of AI Art Studios Dashboard in Excel
Organizations gain several benefits by implementing this dashboard.
✔ Centralized management of studio project data
✔ Faster performance evaluation
✔ Improved profitability analysis
✔ Better cost monitoring
✔ Enhanced client profitability insights
✔ Platform performance evaluation
✔ Efficient AI tool utilization
✔ Data-driven decision-making
Instead of relying on manual reporting, studios can use interactive Excel dashboards to monitor creative operations efficiently.
This dashboard converts complex creative data into clear insights that help studios grow faster and remain competitive.
### Click here to read the Detailed blog post
Visit our YouTube channel to learn step-by-step video tutorials
https://youtube.com/@PKAnExcelExpert


