Electricity infrastructure projects involve massive investments, strict timelines, and coordination among multiple stakeholders. From power plants and substations to transmission lines and renewable energy installations, every electricity project requires continuous monitoring and financial oversight. Without proper visibility, companies may struggle with project delays, cost overruns, and inefficient contractor performance.
This is exactly where the Electricity Project Dashboard in Excel becomes a powerful solution.
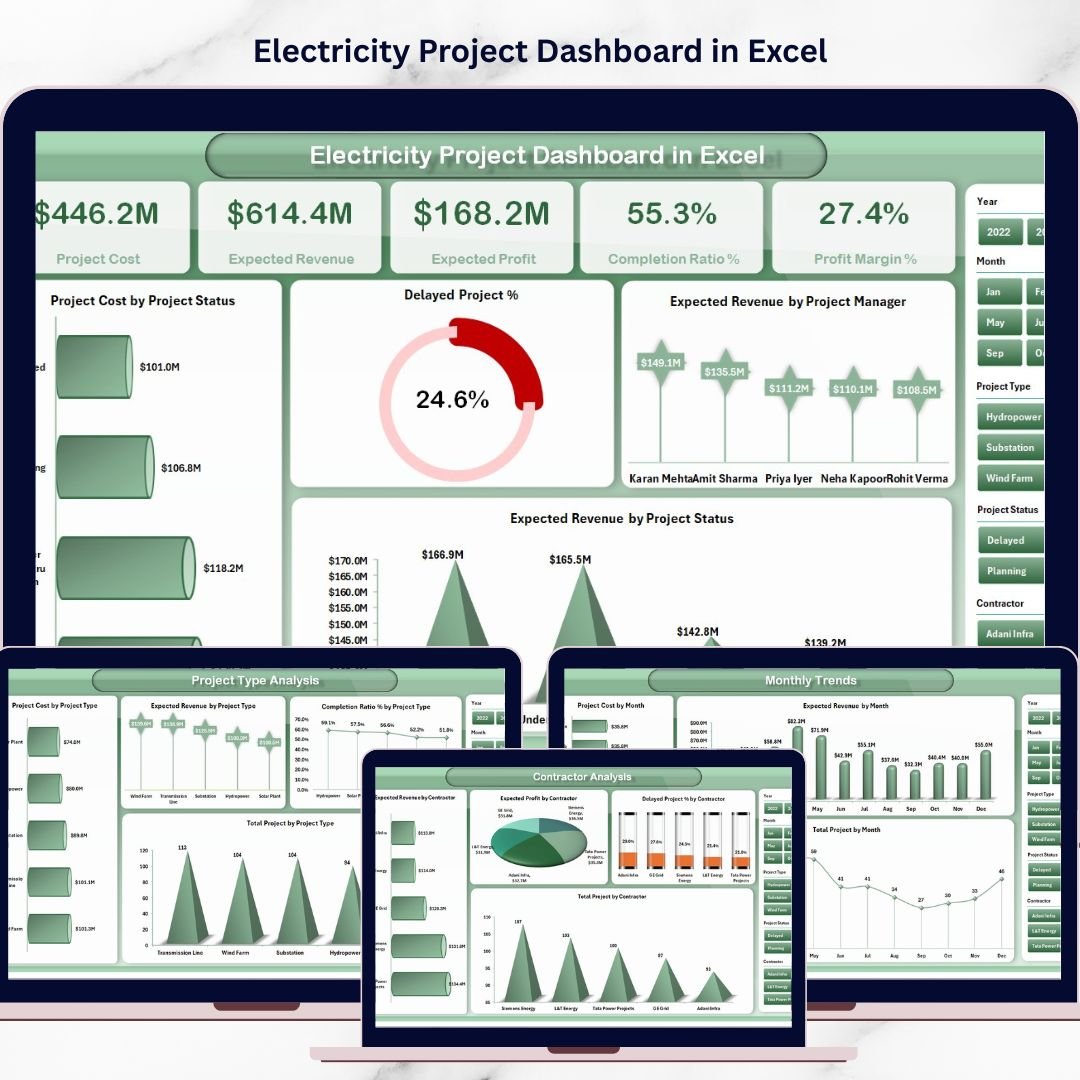
The Electricity Project Dashboard in Excel is a ready-to-use, interactive Excel template designed to transform complex electricity project data into clear and actionable insights. Instead of managing dozens of spreadsheets and manual reports, this dashboard organizes all important project information into visual charts, KPI indicators, and structured reports.
With this dashboard, project managers and decision-makers can easily monitor project cost, expected revenue, expected profit, completion ratio, profit margin, contractor performance, regional performance, and monthly project trends in one centralized dashboard.
As a result, organizations gain a clear understanding of project performance and can make faster, data-driven decisions.
Whether you are managing power generation projects, grid expansion initiatives, substation installations, or renewable energy infrastructure, this Excel dashboard helps you track project performance effectively and improve operational efficiency.
⚡ Key Feature of Electricity Project Dashboard in Excel
📊 Interactive KPI Cards
Instantly track critical project metrics including Project Cost, Expected Revenue, Expected Profit, Completion Ratio %, and Profit Margin %.
📈 Five Analytical Dashboard Pages
The dashboard contains five powerful pages: Overview, Project Type Analysis, Contractor Analysis, Region Analysis, and Monthly Trends.
🧭 Easy Navigation Panel
A built-in Page Navigator on the left side allows users to move quickly between analysis pages.
📊 Dynamic Pivot Charts
Interactive charts allow users to explore project performance from different perspectives.
👷 Contractor Performance Monitoring
Evaluate contractor productivity, profitability contribution, and delay percentages.
🌍 Regional Project Analysis
Understand how electricity projects perform across different geographical regions.
📅 Monthly Project Trends
Track project activity, investments, and revenue patterns throughout the year.
⚙️ Fully Excel-Based Solution
No complex software required. The dashboard works within Microsoft Excel using pivot tables, charts, and formulas.
📦 What’s Inside the Electricity Project Dashboard in Excel
This ready-to-use Excel dashboard includes multiple analytical sheets designed for project performance monitoring.
1️⃣ Overview Page
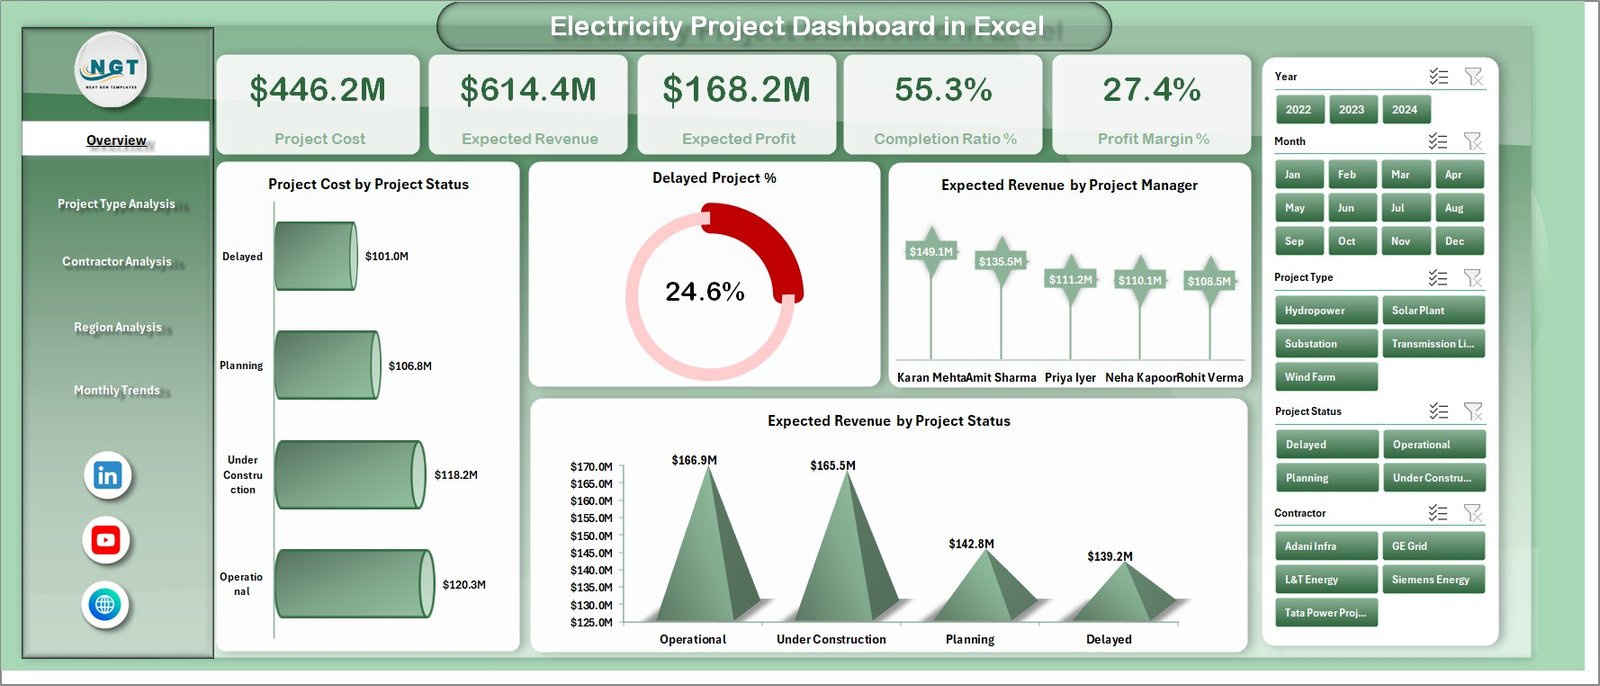
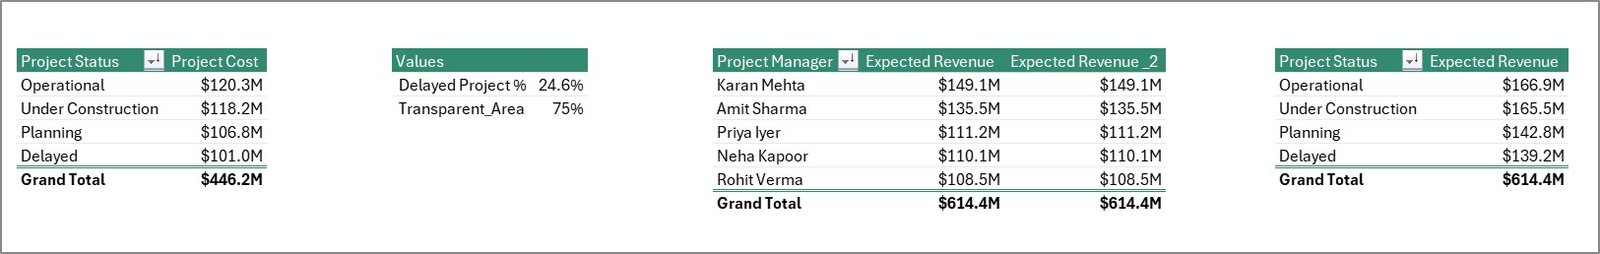
The Overview page provides a quick snapshot of electricity project performance. It contains five KPI indicators such as Project Cost, Expected Revenue, Expected Profit, Completion Ratio %, and Profit Margin %. Additionally, it includes charts like Project Cost by Project Status, Delayed Project %, Expected Revenue by Project Manager, and Expected Revenue by Project Status.
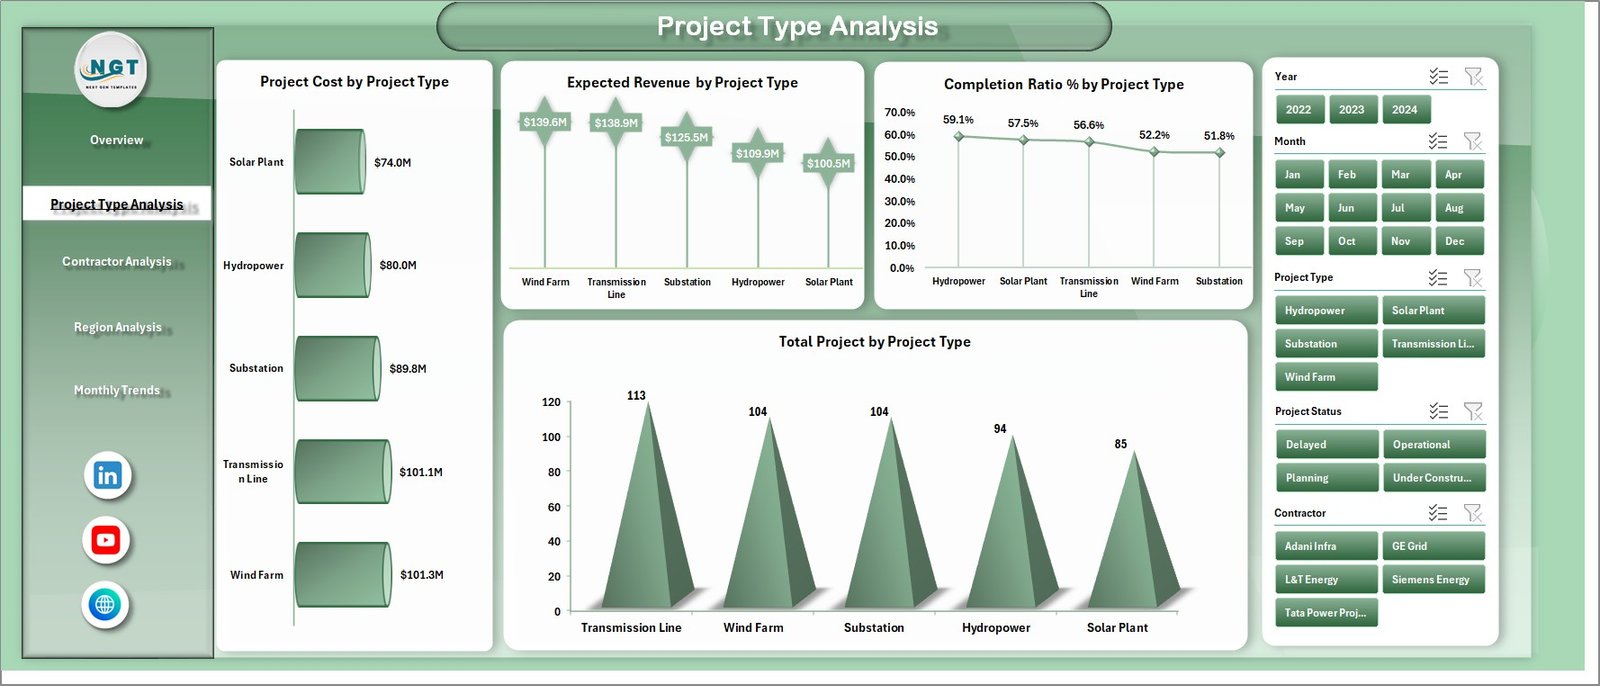
2️⃣ Project Type Analysis
This page analyzes electricity projects based on categories such as power plants, substations, transmission lines, and renewable energy installations. Charts include Project Cost by Project Type, Expected Revenue by Project Type, Completion Ratio % by Project Type, and Total Projects by Project Type.
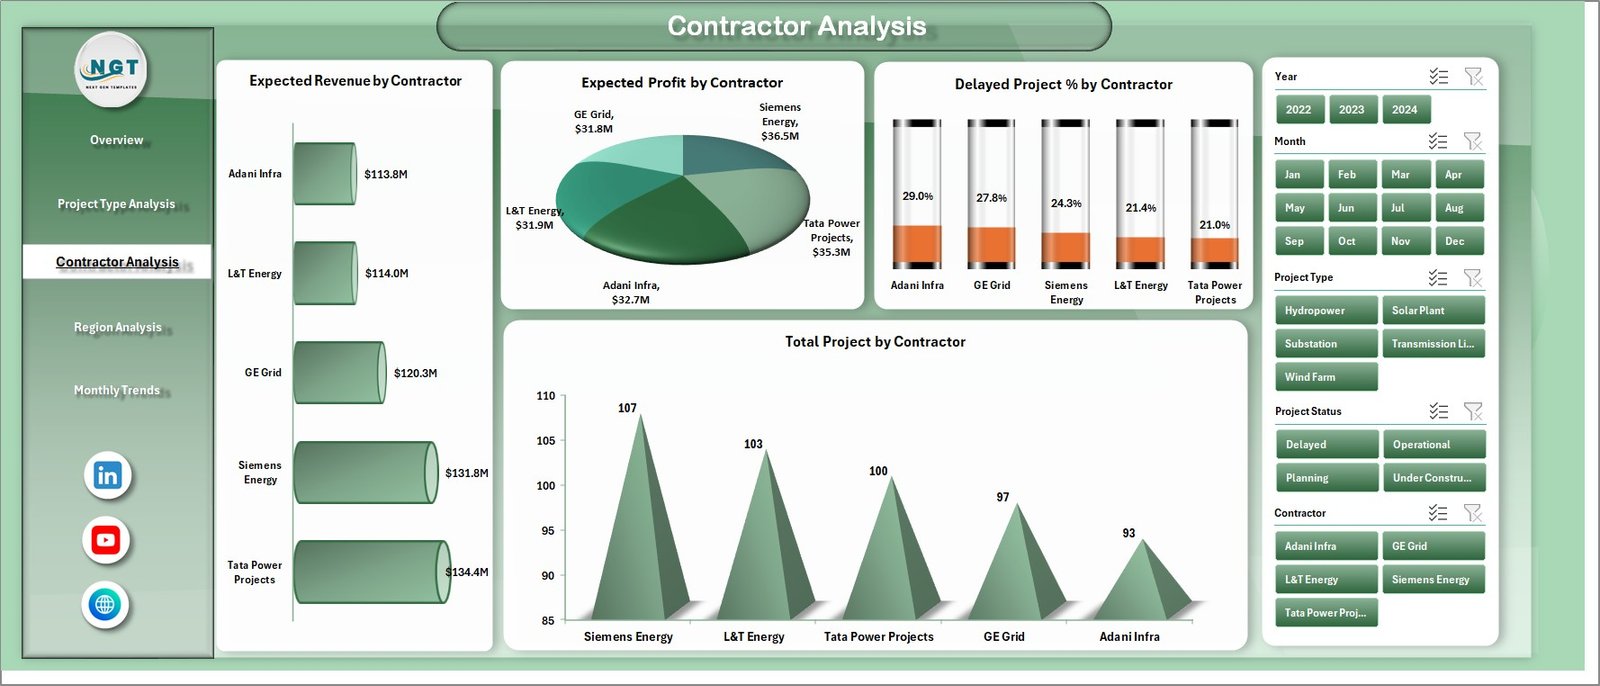
3️⃣ Contractor Analysis
The Contractor Analysis page helps companies evaluate contractor performance. Charts include Expected Revenue by Contractor, Expected Profit by Contractor, Delayed Project % by Contractor, and Total Projects by Contractor.
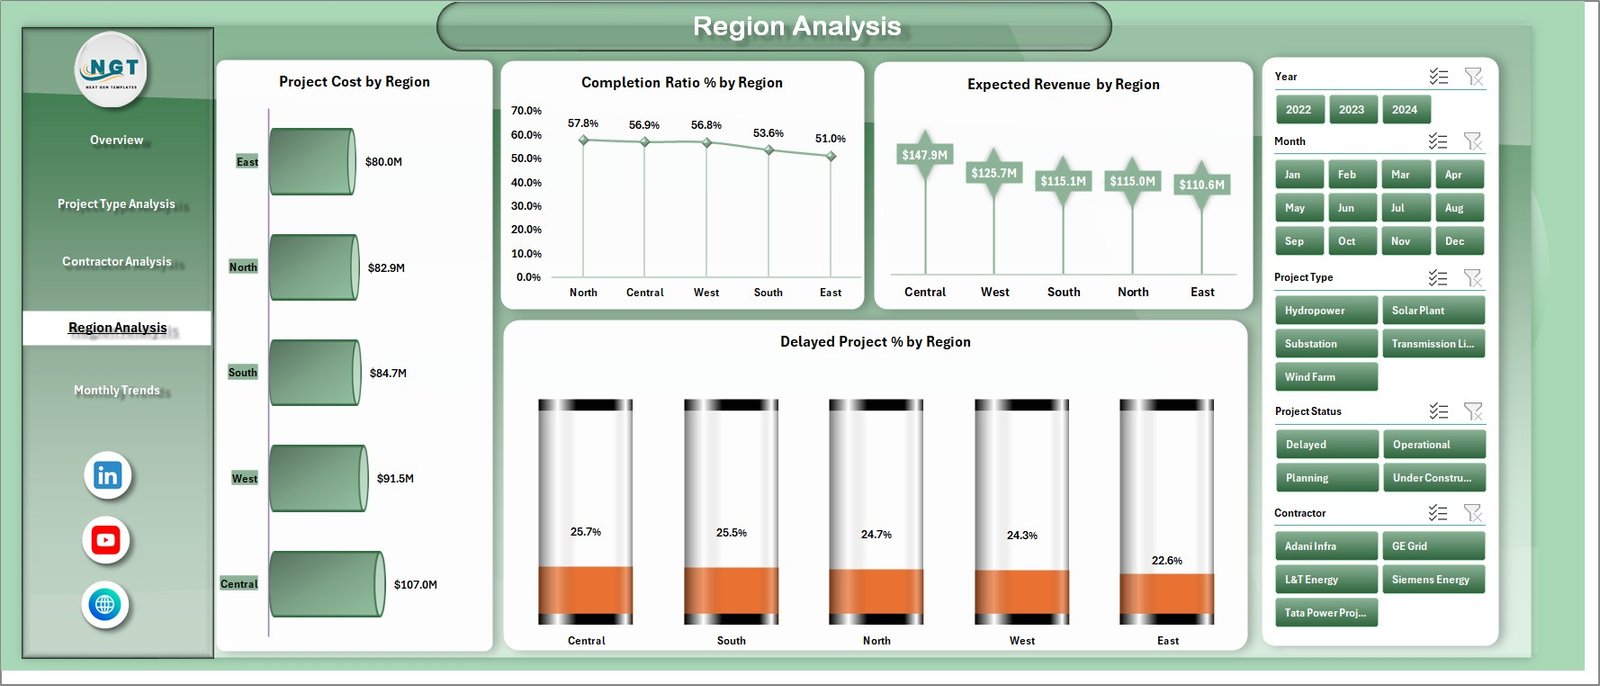
4️⃣ Region Analysis
This page provides insights into regional project performance using charts such as Project Cost by Region, Completion Ratio % by Region, Expected Revenue by Region, and Delayed Project % by Region.
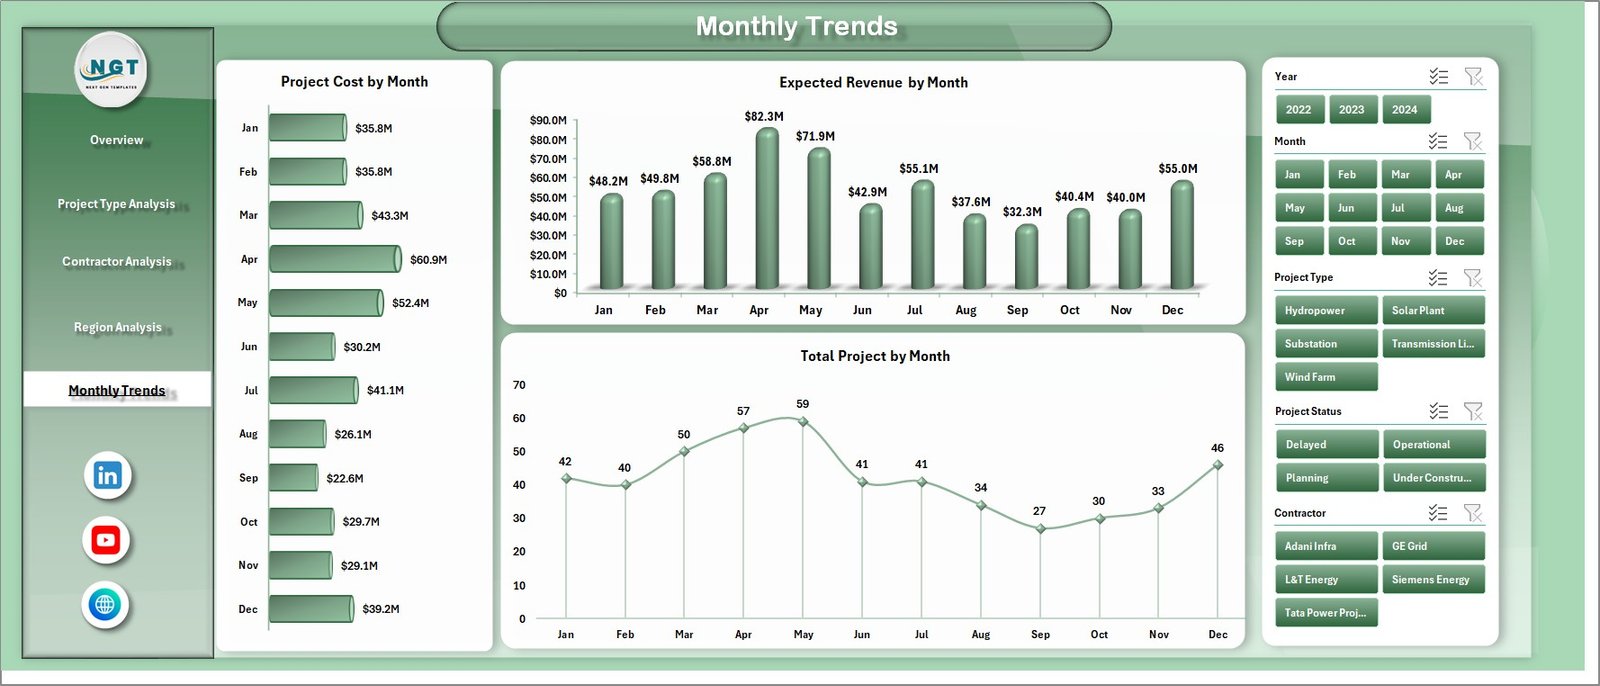
5️⃣ Monthly Trends Analysis
The Monthly Trends page shows how electricity project activity changes over time. Charts include Project Cost by Month, Expected Revenue by Month, and Total Projects by Month.
In addition to dashboard sheets, the Excel file also contains Data and Support sheets that store the dataset and supporting calculations required for the dashboard.
⚙️ How to Use the Electricity Project Dashboard in Excel
Using the dashboard is simple and user-friendly.
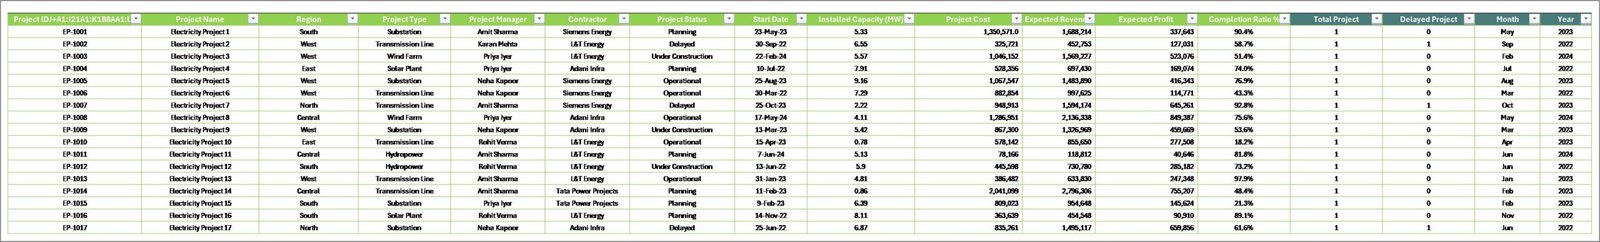
First, enter your electricity project data into the Data Sheet. This sheet stores important information such as Project ID, Project Name, Region, Contractor, Project Manager, Project Cost, Expected Revenue, Completion Ratio, and Project Status.
Next, the dashboard automatically generates insights using pivot tables and charts.
You can use the slicers and filters available on the dashboard pages to explore different aspects of project performance. For example, managers can analyze projects by type, contractor, region, or time period.
Because Excel updates charts dynamically, the dashboard reflects the latest project performance instantly.
Therefore, managers can quickly identify delayed projects, monitor financial performance, and improve decision-making.
👨💼 Who Can Benefit from This Electricity Project Dashboard in Excel
⚡ Project Managers
Track project progress, monitor delays, and evaluate financial performance.
⚡ Electricity and Energy Companies
Manage multiple infrastructure projects across different regions.
⚡ Infrastructure Developers
Analyze contractor performance and project profitability.
⚡ Financial Analysts
Study project investment, revenue projections, and profit margins.
⚡ Renewable Energy Companies
Monitor solar, wind, hydro, and other electricity infrastructure projects.
⚡ Government Energy Departments
Track public electricity infrastructure development and project progress.
This dashboard is ideal for organizations involved in electricity infrastructure management, project planning, and energy sector analytics.
Click here to read the Detailed blog post
Visit our YouTube channel to learn step-by-step video tutorials
👉 https://youtube.com/@PKAnExcelExpert