Managing electricity contracts across regions, sectors, and contract types can quickly become complicated. Energy companies often deal with hundreds of contracts involving pricing models, delivery volumes, payment cycles, and financial performance tracking. When this information is stored across multiple spreadsheets, it becomes difficult to monitor profitability, payment delays, and contract risks.
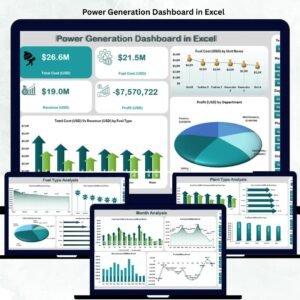
The Electricity Contract Dashboard in Excel is designed to solve this problem. It converts complex electricity contract data into clear, visual, and interactive insights that help managers track financial performance, monitor risks, and make faster decisions.
Built entirely in Microsoft Excel, this ready-to-use dashboard uses powerful tools like interactive charts, slicers, pivot tables, and automated calculations to transform raw data into actionable intelligence. Instead of manually analyzing spreadsheets, decision-makers can instantly see which contracts are profitable, which sectors generate the most revenue, and where payment risks exist.
This dashboard allows organizations to analyze contract performance across regions, contract types, sectors, and monthly trends, providing a complete overview of electricity contract operations. Whether you manage power supply agreements, energy trading contracts, or electricity distribution deals, this dashboard gives you the insights needed to optimize contract profitability and reduce financial risks.
⚡ Key Feature of Electricity Contract Dashboard in Excel
📊 Interactive KPI Monitoring
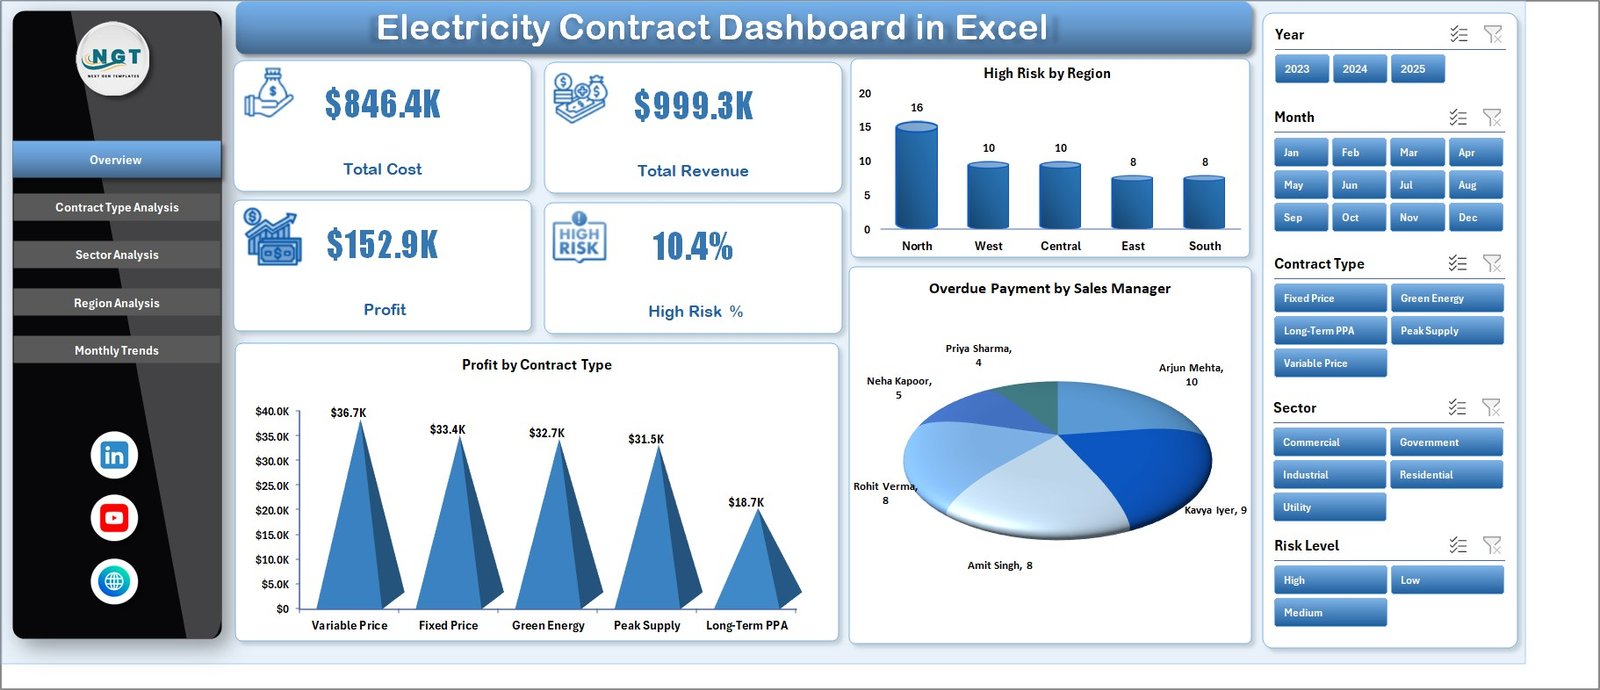
Track key metrics like Total Cost, Total Revenue, Profit, and High Risk % through dynamic KPI cards that update instantly when filters change.
📈 Five Powerful Analysis Pages
The dashboard contains multiple analytical pages including Overview, Contract Type Analysis, Sector Analysis, Region Analysis, and Monthly Trends.
🔎 Dynamic Slicers for Smart Filtering
Users can filter the dashboard by sector, contract type, region, and other categories to focus on specific contract groups.
🌍 Regional Performance Insights
Identify which regions generate higher profits and detect locations with higher payment risks.
💰 Profitability Tracking
Analyze profit margins across different contract types and sectors to identify the most profitable agreements.
⚠️ Risk Monitoring System
High Risk % indicators highlight contracts that may require immediate attention.
📅 Monthly Financial Trend Analysis
Monitor how cost, revenue, and profit margins change month-by-month to identify seasonal patterns.
⚡ Fully Excel-Based Solution
No additional software or complex installation required. Everything runs directly inside Excel.
📦 What’s Inside the Electricity Contract Dashboard in Excel
This ready-to-use Excel template includes multiple sheets designed for comprehensive electricity contract analysis.
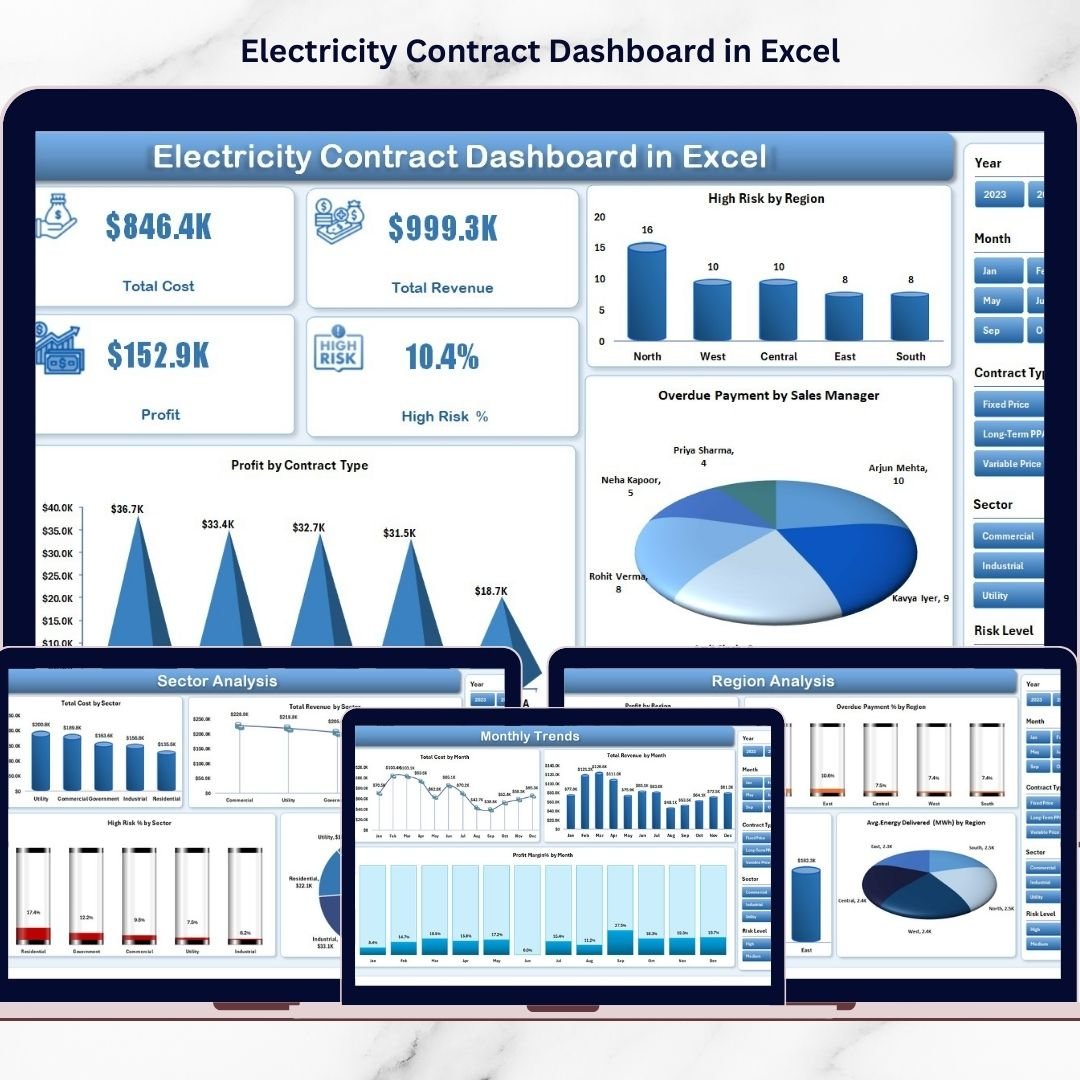
Overview Page
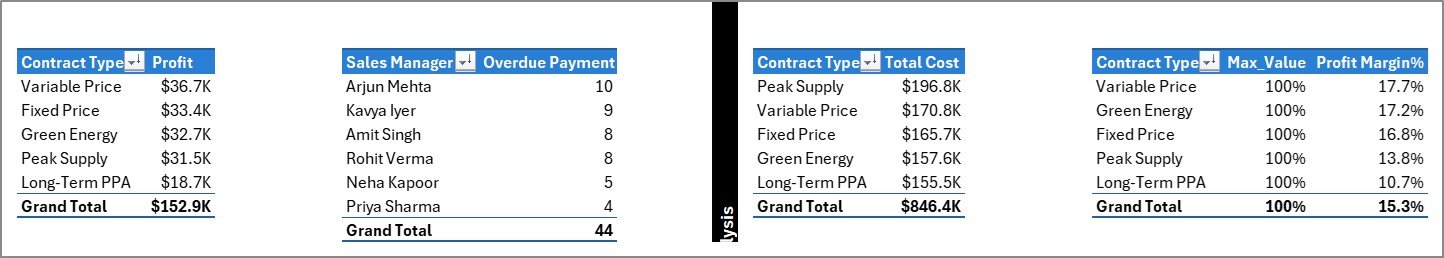
The main dashboard page that displays important KPI cards and charts such as High Risk by Region, Profit by Contract Type, and Overdue Payments by Sales Manager.
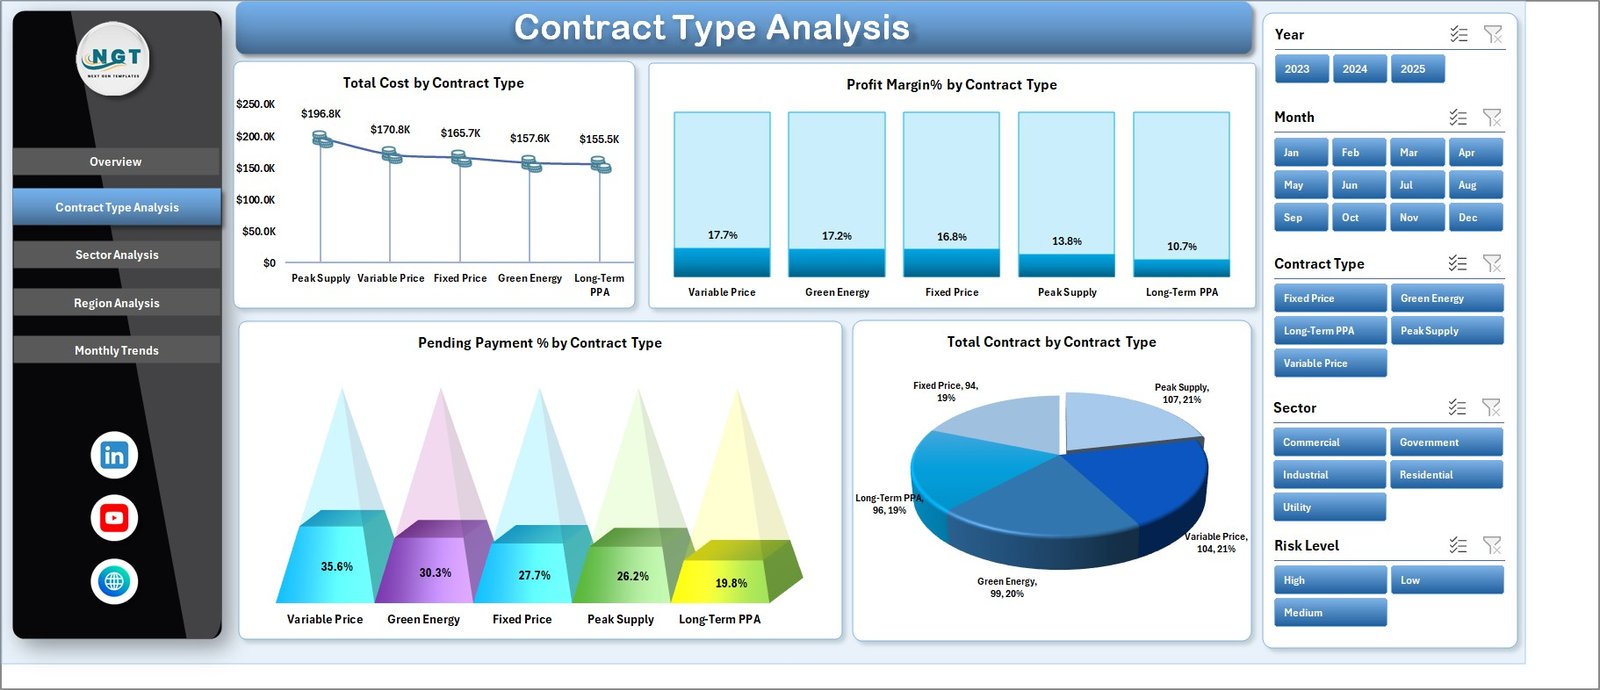
Contract Type Analysis Page
Provides insights into the financial performance of different contract types including cost, profit margin, pending payment percentage, and total contracts.
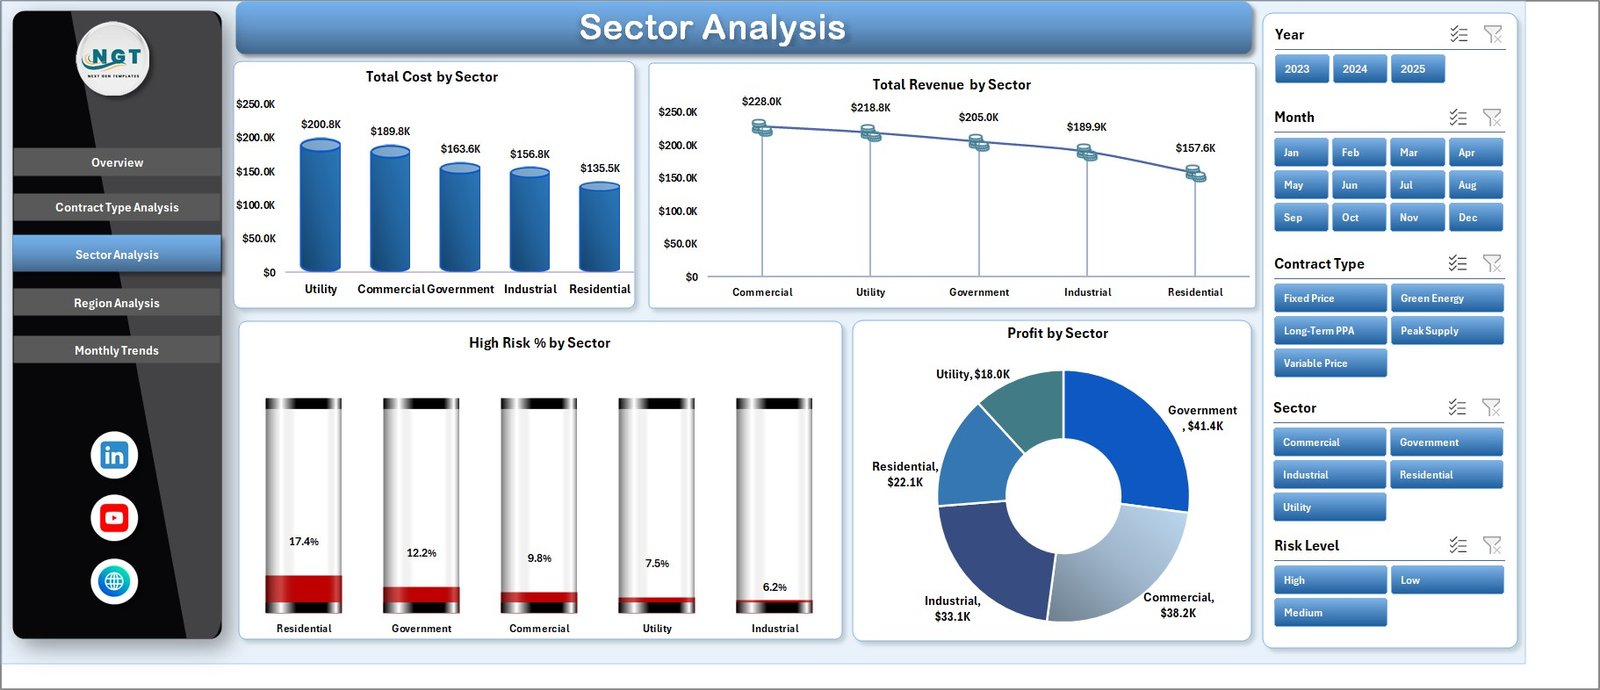
Sector Analysis Page
Evaluates how various industries contribute to electricity contract revenue and profitability.
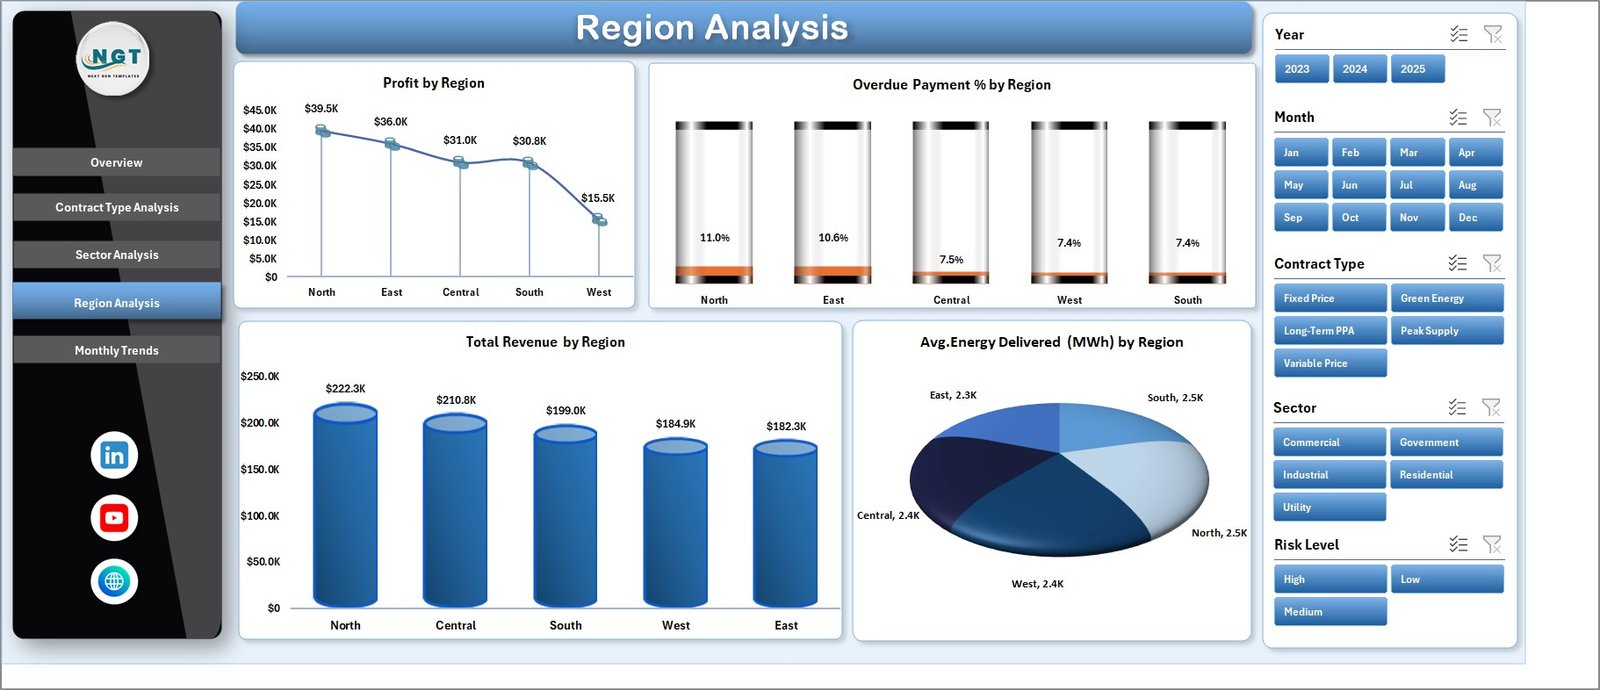
Region Analysis Page
Compares regional contract performance through charts like Profit by Region, Revenue by Region, and Average Energy Delivered.
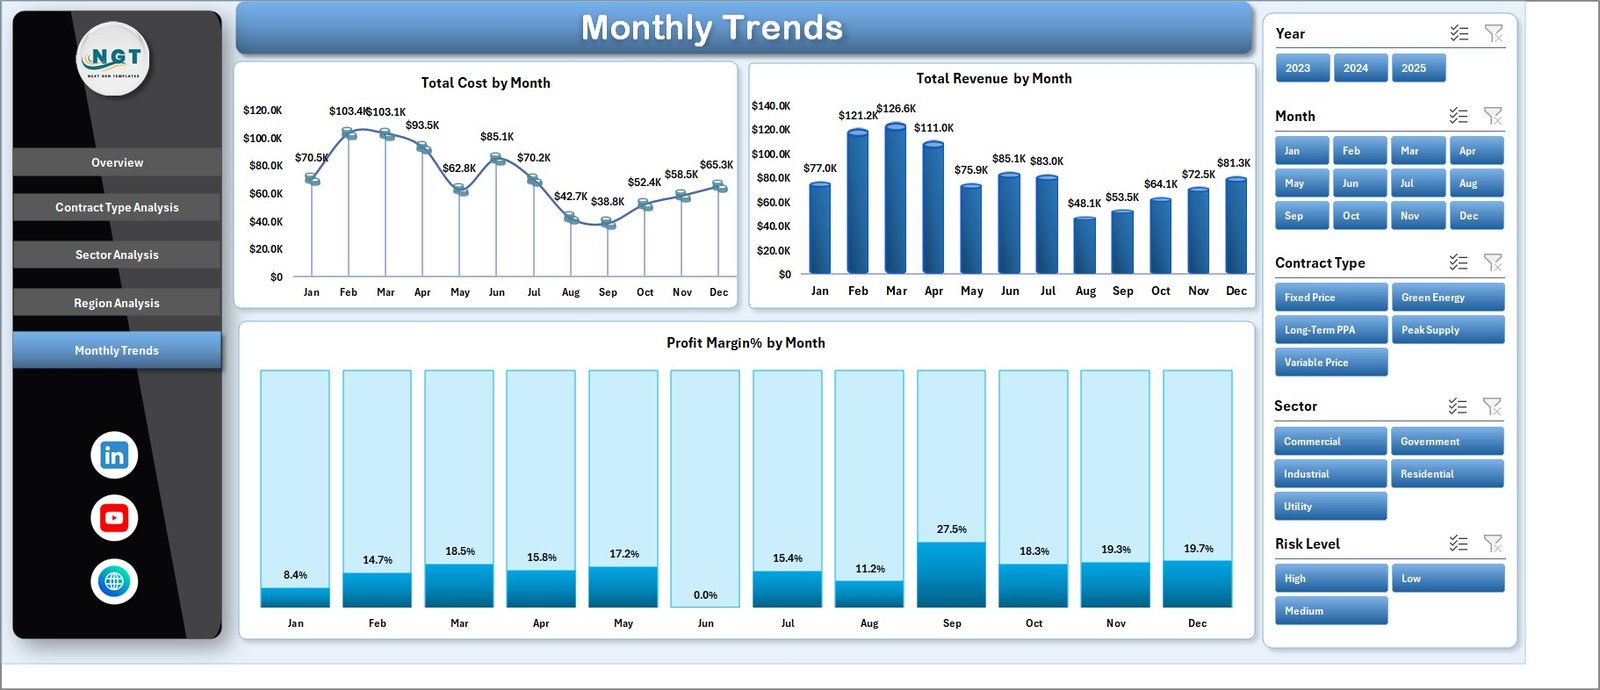
Monthly Trends Page
Tracks monthly changes in cost, revenue, and profit margin to help identify financial trends.
Support Sheet
Stores backend calculations and helper tables used to power the dashboard.
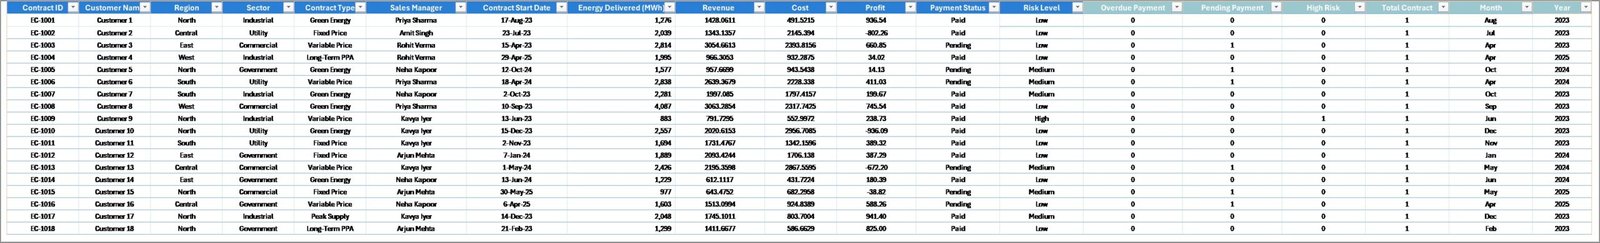
Data Sheet
Contains raw contract information such as contract type, region, sector, energy delivered, cost, revenue, payment status, and risk category.
🧭 How to Use the Electricity Contract Dashboard in Excel
Using this dashboard is simple and requires no advanced technical knowledge.
Step 1 – Enter Contract Data
Add your electricity contract details into the Data Sheet including contract type, region, revenue, cost, and payment status.
Step 2 – Refresh the Dashboard
Once the data is updated, charts and KPI indicators automatically update using Excel formulas and pivot tables.
Step 3 – Apply Filters Using Slicers
Use slicers on the right side of the dashboard to analyze specific sectors, regions, or contract types.
Step 4 – Analyze Key Insights
Review profit margins, overdue payments, and risk levels to evaluate contract performance.
Step 5 – Make Better Business Decisions
Use insights from the dashboard to optimize pricing strategies, monitor payment cycles, and reduce contract risks.
👥 Who Can Benefit from This Electricity Contract Dashboard
This dashboard is ideal for organizations and professionals involved in electricity supply contracts.
⚡ Electricity suppliers
⚡ Energy trading companies
⚡ Utility companies
⚡ Contract managers
⚡ Financial analysts
⚡ Energy sector consultants
⚡ Power distribution companies
Any organization managing electricity supply agreements can use this dashboard to improve financial visibility and contract monitoring.
Click here to read the Detailed blog post
Visit our YouTube channel to learn step-by-step video tutorials
👉 https://youtube.com/@PKAnExcelExpert