Customer service is one of the most important drivers of customer satisfaction, brand loyalty, and long-term business growth. However, many organizations still struggle to track customer support performance because data is spread across spreadsheets, CRM tools, and ticketing platforms. As a result, managers often lack clear visibility into response times, ticket volumes, agent productivity, and customer satisfaction levels.
That is exactly where the Customer Service Dashboard in HTML becomes a powerful analytics solution 📊💬.
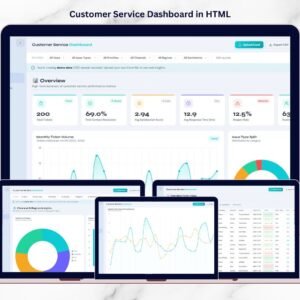
This modern and interactive dashboard transforms raw support data into meaningful visual insights. Instead of manually analyzing multiple reports, managers can monitor support performance instantly through KPI cards, interactive charts, filters, and searchable data tables.
Built using HTML, CSS, JavaScript, Chart.js, and Excel integration, this dashboard delivers a fast, responsive, and visually engaging analytics platform. Users can upload Excel datasets, apply filters, analyze trends, and export reports — all directly inside the browser without installing additional software.
Whether you manage a customer support team, oversee service operations, or analyze customer experience metrics, this dashboard provides the insights needed to improve service quality and operational efficiency.
🚀 Key Feature of Customer Service Dashboard in HTML
📊 Interactive Customer Support Analytics – Monitor support metrics using visual charts and KPI cards.
🎫 Ticket Volume Monitoring – Track the number of support tickets received across different time periods.
⏱ Response & Resolution Time Tracking – Analyze how quickly customer issues are addressed and resolved.
👩💼 Agent Performance Analysis – Evaluate agent productivity, efficiency, and service quality.
📈 Customer Satisfaction Monitoring – Track service ratings and customer feedback trends.
🔎 Advanced Data Search – Instantly search support records using ticket ID, agent name, or issue category.
📤 Export Data Reports – Export filtered datasets to CSV for reporting or presentations.
🎨 Dark & Light Mode Interface – Switch between themes for better usability.
📱 Responsive Dashboard Design – Access analytics across desktops, tablets, and mobile devices.
Because of these features, customer service teams gain full visibility into operational performance.
📦 What’s Inside the Customer Service Dashboard in HTML?
This dashboard includes multiple analytical pages designed to provide deep insights into customer support operations.
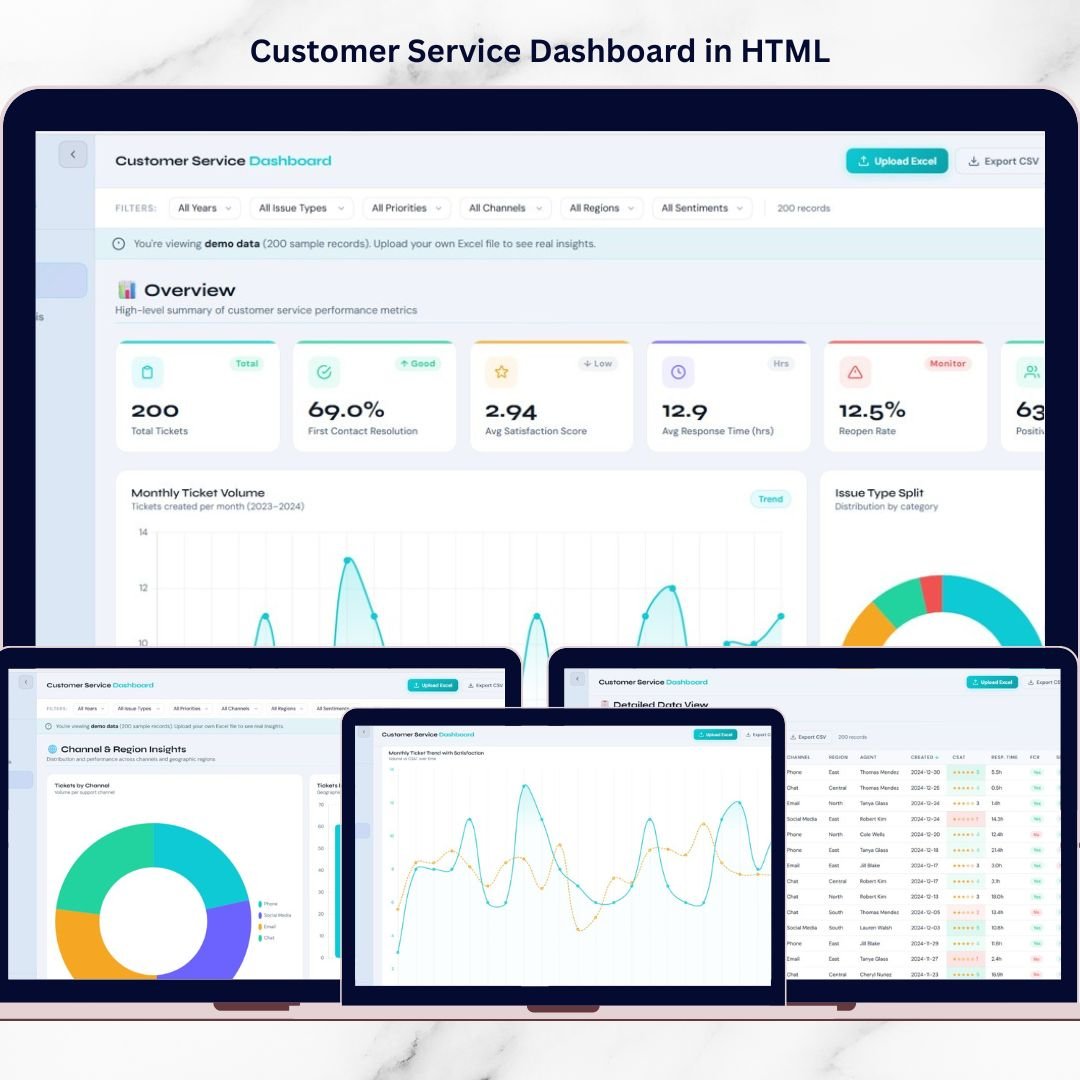
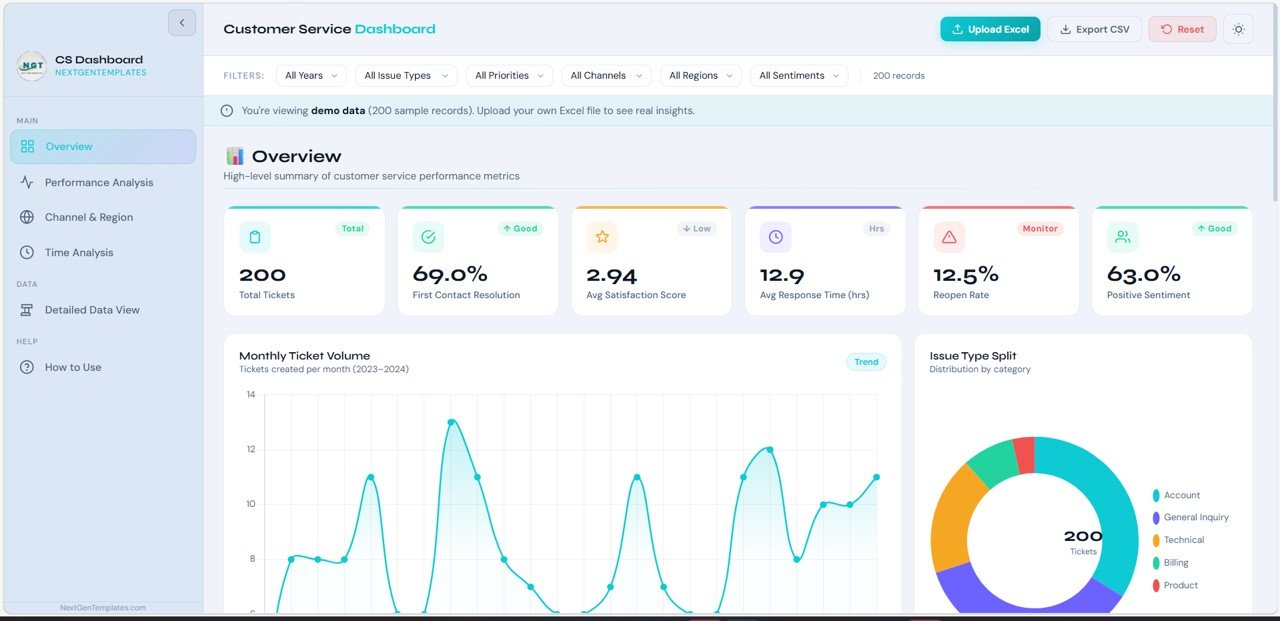
1️⃣ Overview Page – Customer Support Performance Snapshot
The Overview Page provides a high-level summary of customer service performance.
It includes key KPI cards such as:
• Total Tickets Handled
• Average Resolution Time
• Customer Satisfaction Score
• First Response Time
• Ticket Backlog
Additional features include:
📈 KPI Trend Indicators – Upward and downward indicators highlight performance changes.
📊 Interactive Sparkline Charts – Small charts inside KPI cards show performance movement over time.
These insights help managers quickly evaluate the health of support operations.
2️⃣ Service Performance Page – Operational Efficiency Analysis
The Service Performance Page focuses on analyzing ticket handling efficiency and service performance metrics.
Key analytics include:
📊 Ticket Volume Analysis – Shows ticket counts across different time periods.
📉 Resolution Time Distribution – Measures how quickly customer issues are resolved.
📊 Service Level Performance – Tracks SLA compliance levels.
📉 Issue Category Distribution – Identifies the most common types of customer issues.
This analysis helps managers identify service bottlenecks and optimize support workflows.
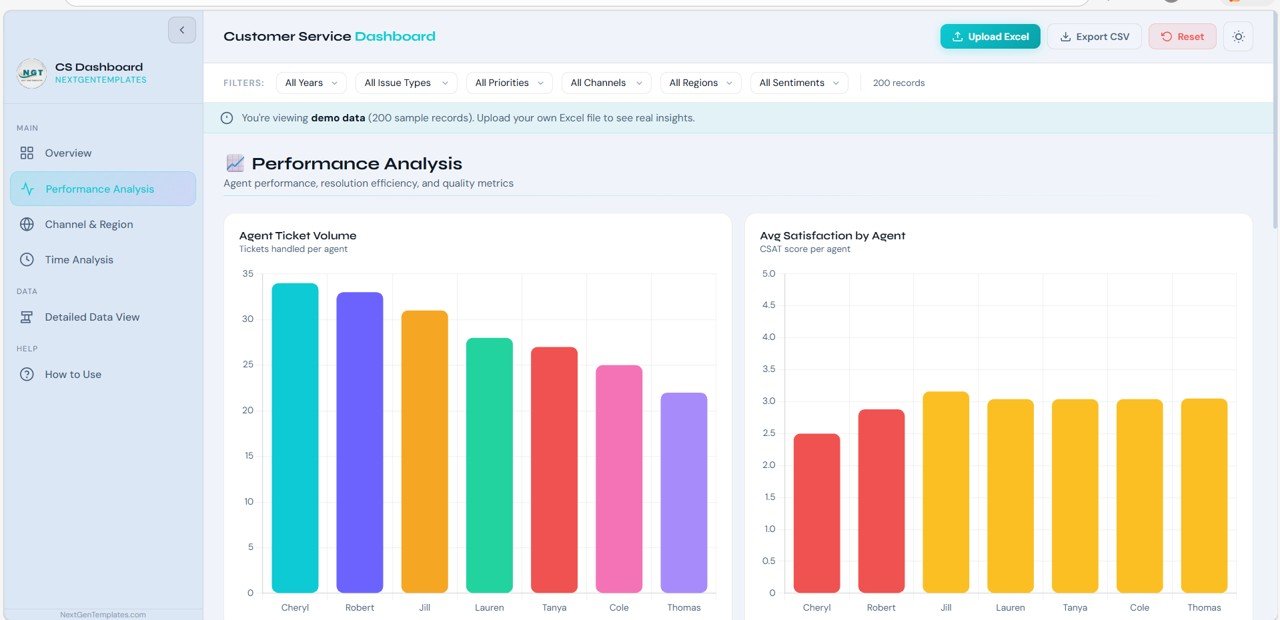
3️⃣ Agent Performance Page – Team Productivity Monitoring
The Agent Performance Page highlights the performance of individual customer support agents.
Key features include:
🏆 Agent Leaderboard – Displays top-performing agents based on service metrics.
📊 Agent Performance Scores – Measures productivity and efficiency.
📈 Performance Progress Bars – Shows progress toward performance goals.
📊 Agent Activity Metrics
• Tickets handled
• Resolution speed
• Customer satisfaction ratings
This page helps managers recognize top performers and identify training opportunities.
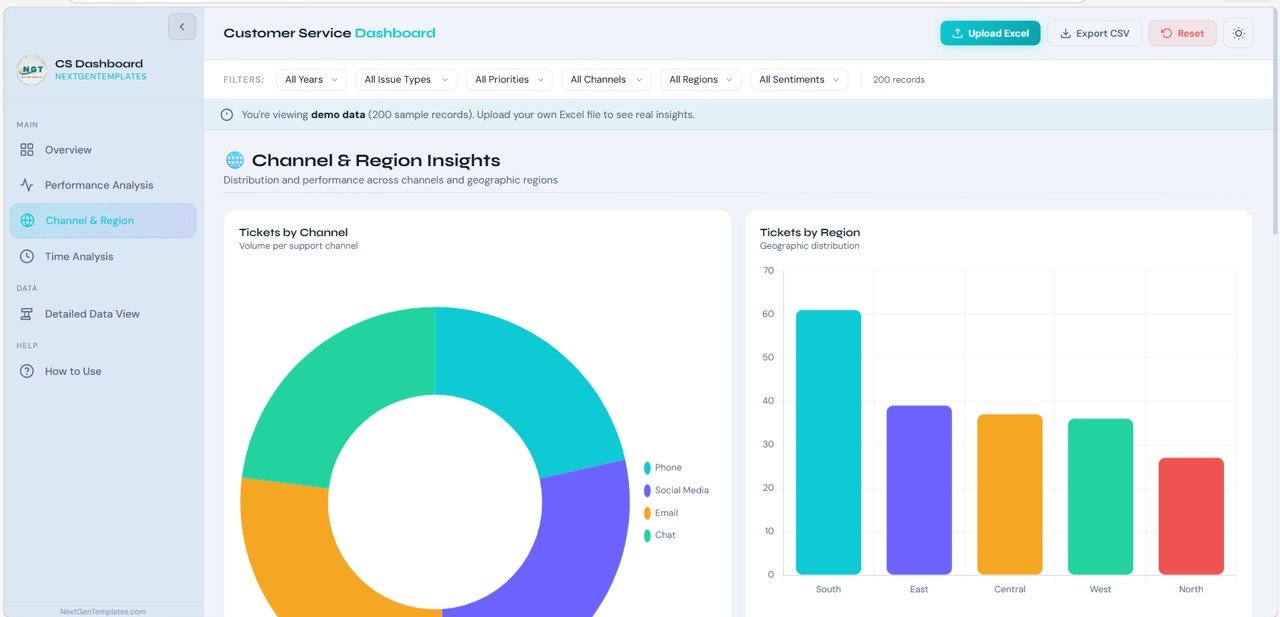
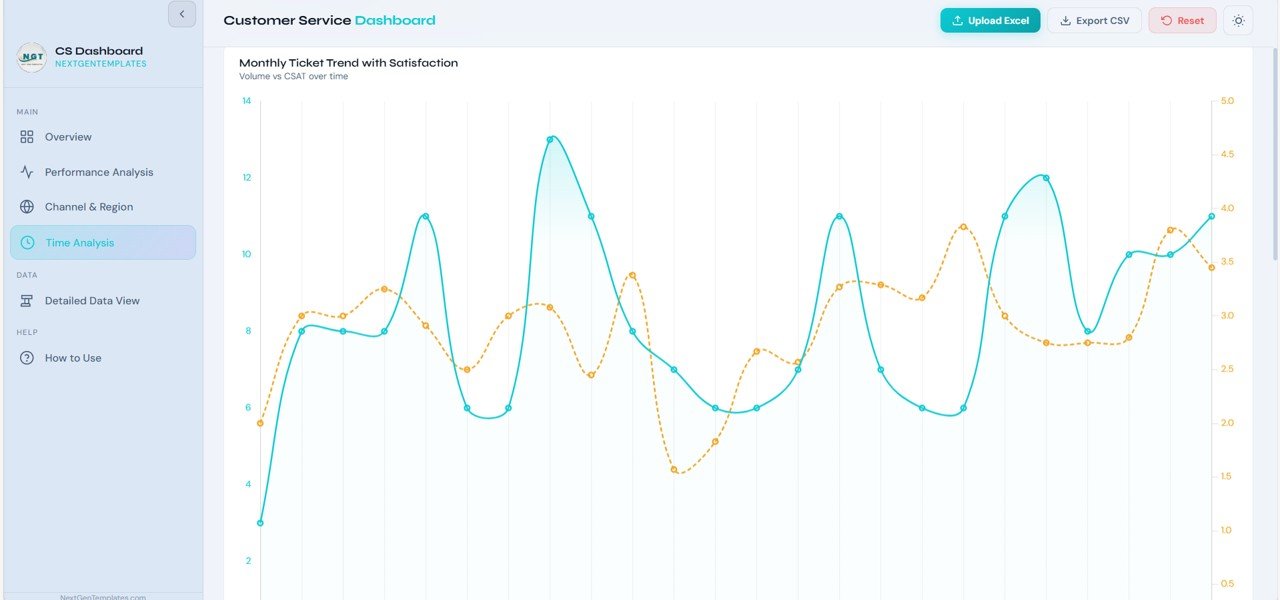
4️⃣ Ticket Analysis Page – Customer Support Trends
The Ticket Analysis Page focuses on understanding support demand patterns.
Key insights include:
📈 Ticket Trends Over Time – Analyze ticket volume changes daily, weekly, or monthly.
📊 Ticket Priority Distribution – Classify tickets into High, Medium, and Low priority levels.
📉 Customer Satisfaction Analysis – Monitor service rating trends.
🔥 Issue Heatmaps – Identify areas where support demand is highest.
These insights help organizations proactively manage support workload.
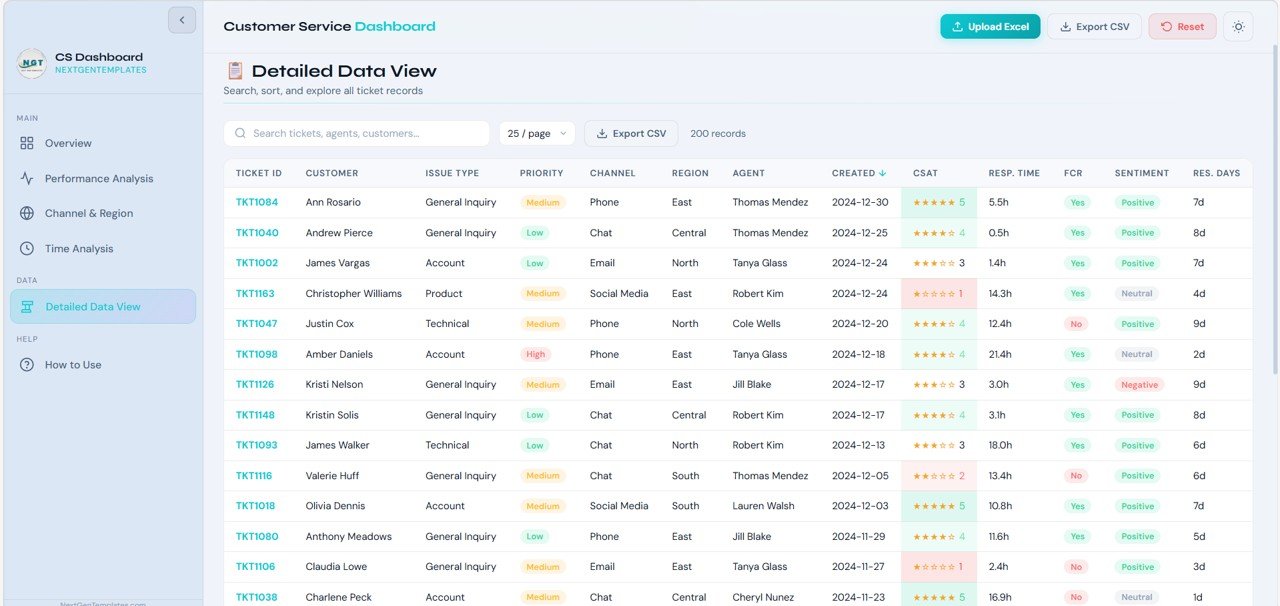
5️⃣ Detailed Data Page – Complete Support Data Table
The Detailed Data Page provides a full table view of support records used in the dashboard.
Key columns include:
• Ticket ID
• Agent Name
• Customer Name
• Issue Category
• Ticket Priority
• Resolution Time
• Satisfaction Score
Additional features include:
🔎 Search Functionality – Quickly find records using keywords.
📊 Sortable Columns – Sort data fields for deeper analysis.
📄 Pagination Controls – Navigate large datasets easily.
This page is ideal for operational auditing and detailed investigation.
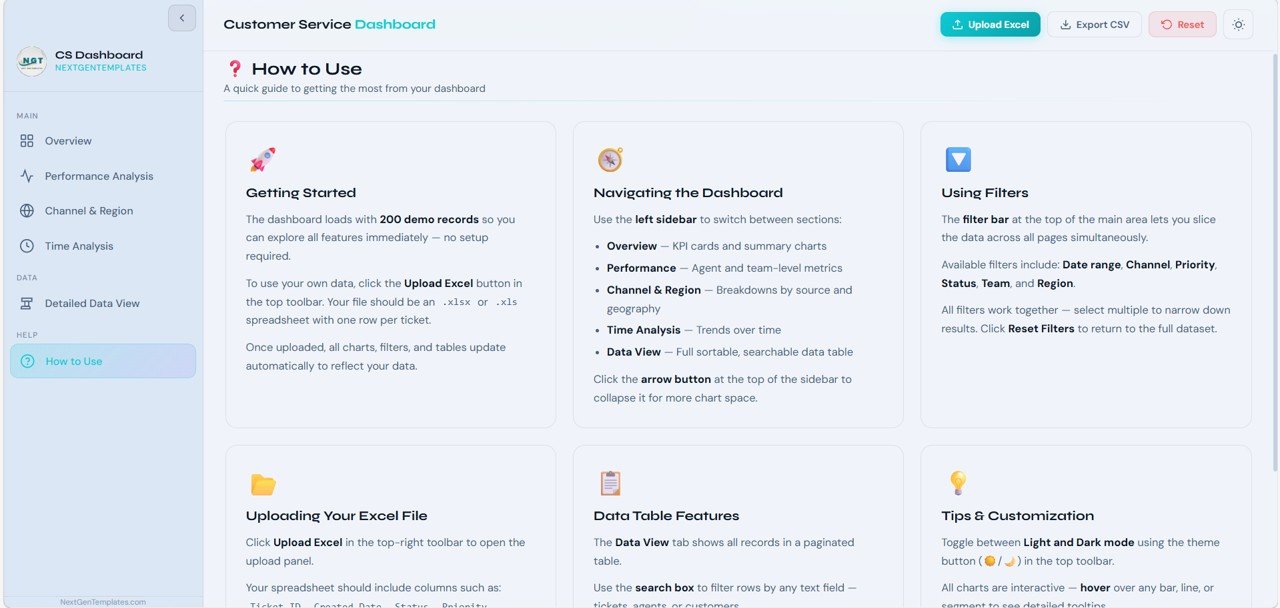
6️⃣ How to Use Page – Dashboard User Guide
The How to Use Page explains how users interact with the dashboard.
Instructions include:
📥 Upload Excel (.xlsx) datasets
🔎 Apply filters by agent, status, priority, category, or date
📊 Search ticket records instantly
📤 Export filtered datasets to CSV
🎨 Toggle dark/light dashboard themes
This guide ensures that users can quickly start analyzing customer service data.
⚙️ How to Use the Customer Service Dashboard in HTML
Using the dashboard is simple:
1️⃣ Upload your support dataset from Excel or CSV
2️⃣ Apply filters to analyze ticket data by agent, priority, or category
3️⃣ Monitor KPI cards and visual charts
4️⃣ Investigate detailed records in the data table
5️⃣ Export reports for meetings and performance reviews
Because the dashboard updates dynamically, managers can analyze support performance instantly.
👥 Who Can Benefit from This Customer Service Dashboard?
This dashboard is ideal for organizations focused on customer support performance.
✔ Customer Service Managers
✔ Support Team Leaders
✔ Operations Managers
✔ Customer Experience Teams
✔ Business Analysts
✔ Helpdesk Teams
✔ CRM Managers
Any organization handling large volumes of customer support interactions can benefit from this dashboard.
This dashboard helps answer important operational questions:
• How quickly are support tickets resolved?
• Which agents handle the highest ticket volumes?
• Which issue categories generate the most support requests?
• Are customer satisfaction scores improving?
• Where are service bottlenecks occurring?
With these insights, businesses can improve service quality and deliver better customer experiences.
Instead of relying on scattered spreadsheets and manual reporting, the Customer Service Dashboard in HTML provides a centralized analytics platform for managing support operations effectively.
Click hare to read the Detailed blog post
Watch the step-by-step video tutorial: