Managing solar parks efficiently is no longer optional — it is essential. As solar energy investments grow worldwide, operators must monitor performance continuously to ensure maximum energy generation, operational efficiency, and profitability. However, tracking multiple KPIs manually across spreadsheets often leads to delays, errors, and missed performance insights.
That is exactly where the Solar Parks KPI Dashboard in Power BI transforms the way renewable energy performance is monitored.
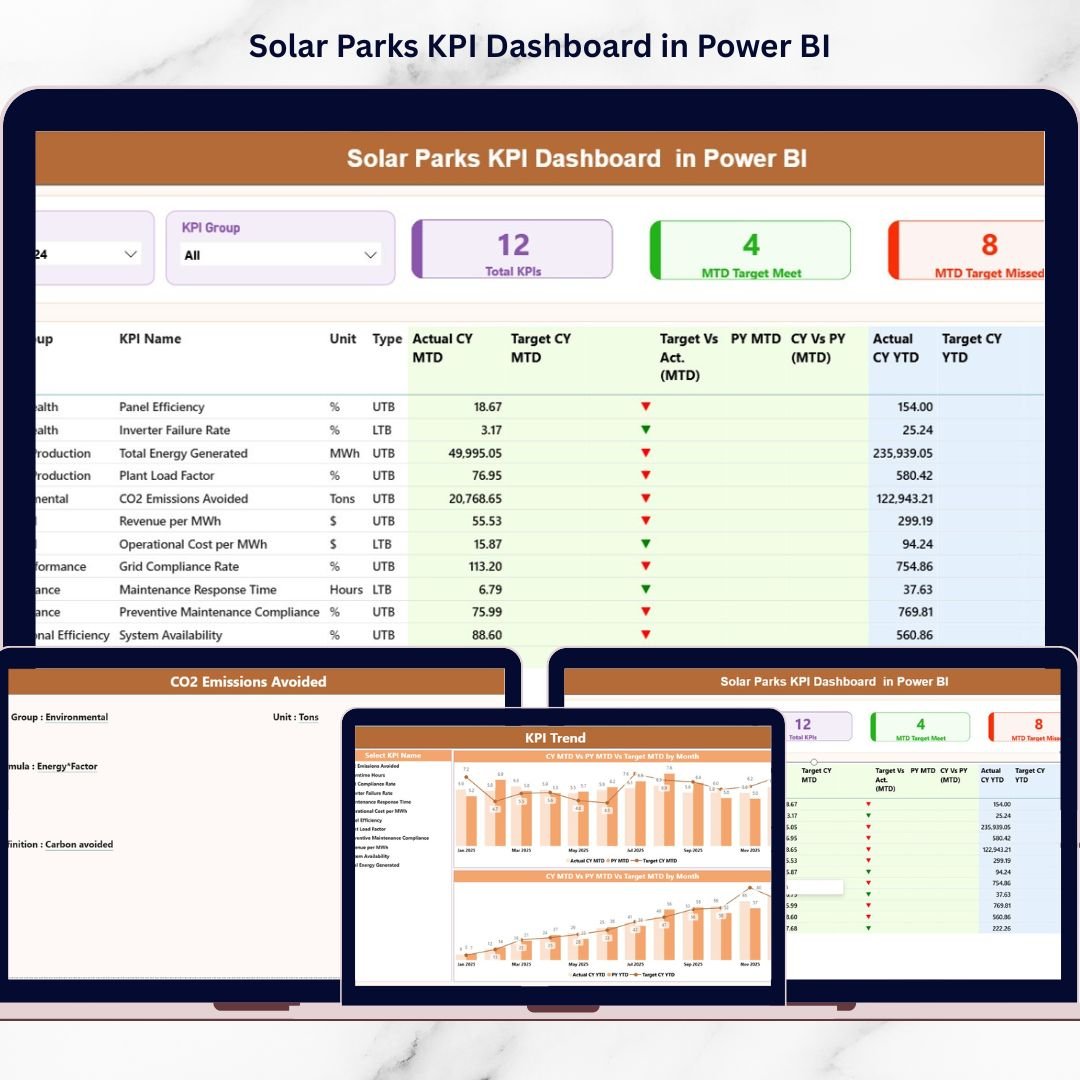
This ready-to-use, professionally designed Power BI dashboard converts complex solar operational data into clear, interactive, and actionable insights. Instead of struggling with scattered reports, you get a centralized analytics system that instantly shows performance trends, KPI status, and operational efficiency.
Whether you manage a single solar plant or multiple solar parks, this dashboard helps you make faster and smarter decisions using dynamic visuals and automated calculations.
🚀 Key Features of Solar Parks KPI Dashboard in Power BI
✅ Interactive KPI monitoring with dynamic slicers
✅ MTD and YTD performance tracking in one view
✅ Target vs Actual comparison with visual indicators
✅ Previous Year vs Current Year analysis
✅ KPI status icons for instant performance visibility
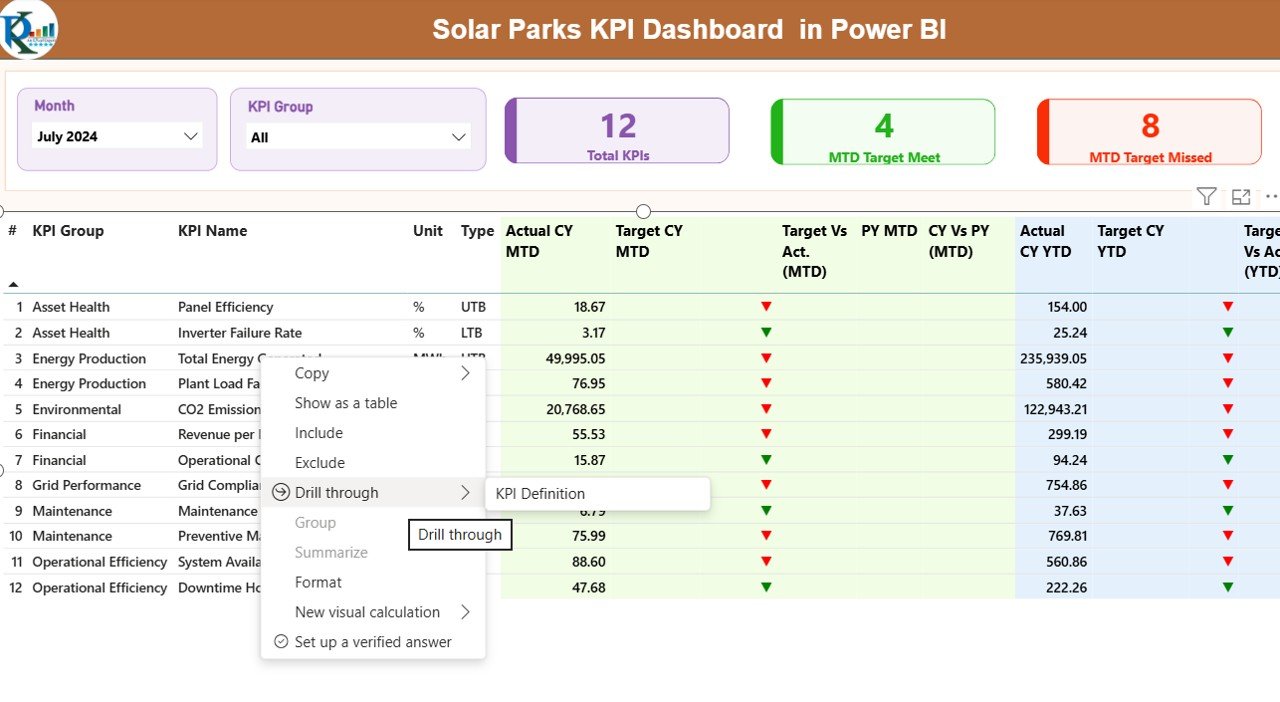
✅ Drill-through KPI definitions and formulas
✅ Automated calculations using Power BI measures
✅ Clean, professional, and executive-level dashboard design
The dashboard highlights performance issues immediately so management teams can act before small problems become costly losses.
📦 What’s Inside the Solar Parks KPI Dashboard in Power BI
This Power BI solution includes three powerful analytical pages designed for complete performance visibility:
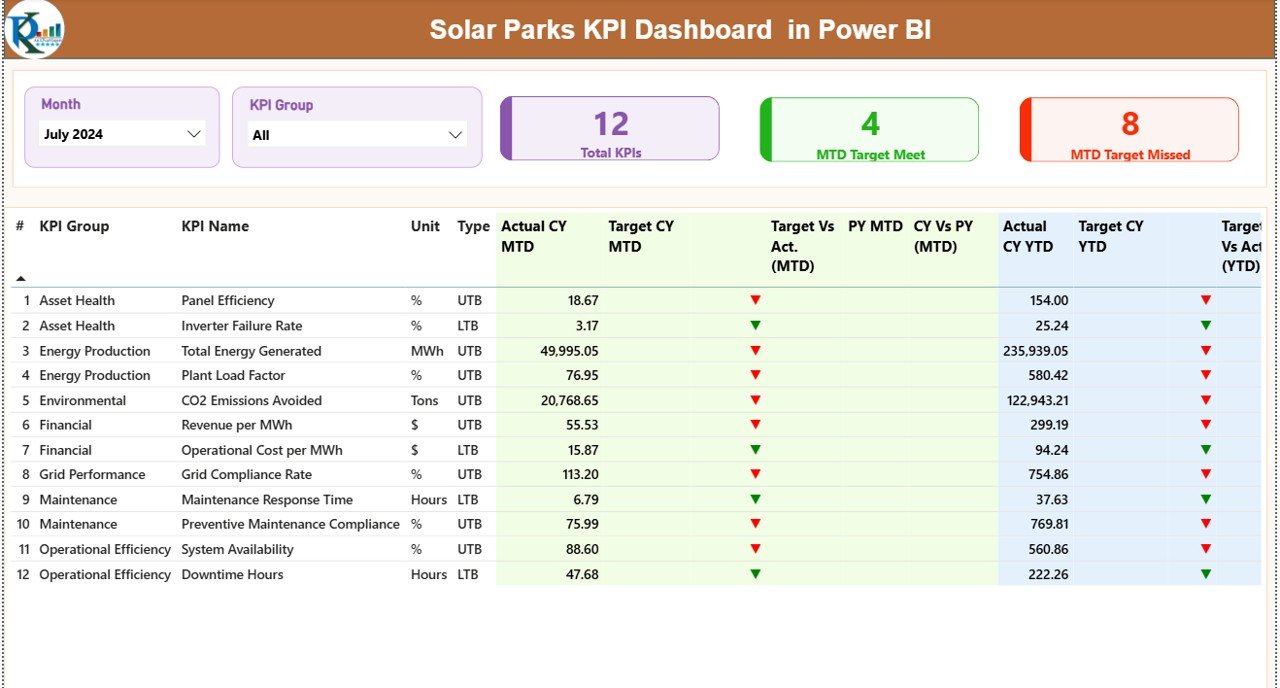
1️⃣ Summary Page – Performance Control Center
Monitor all KPIs at a glance using KPI cards, performance tables, and slicers for month and KPI group filtering.
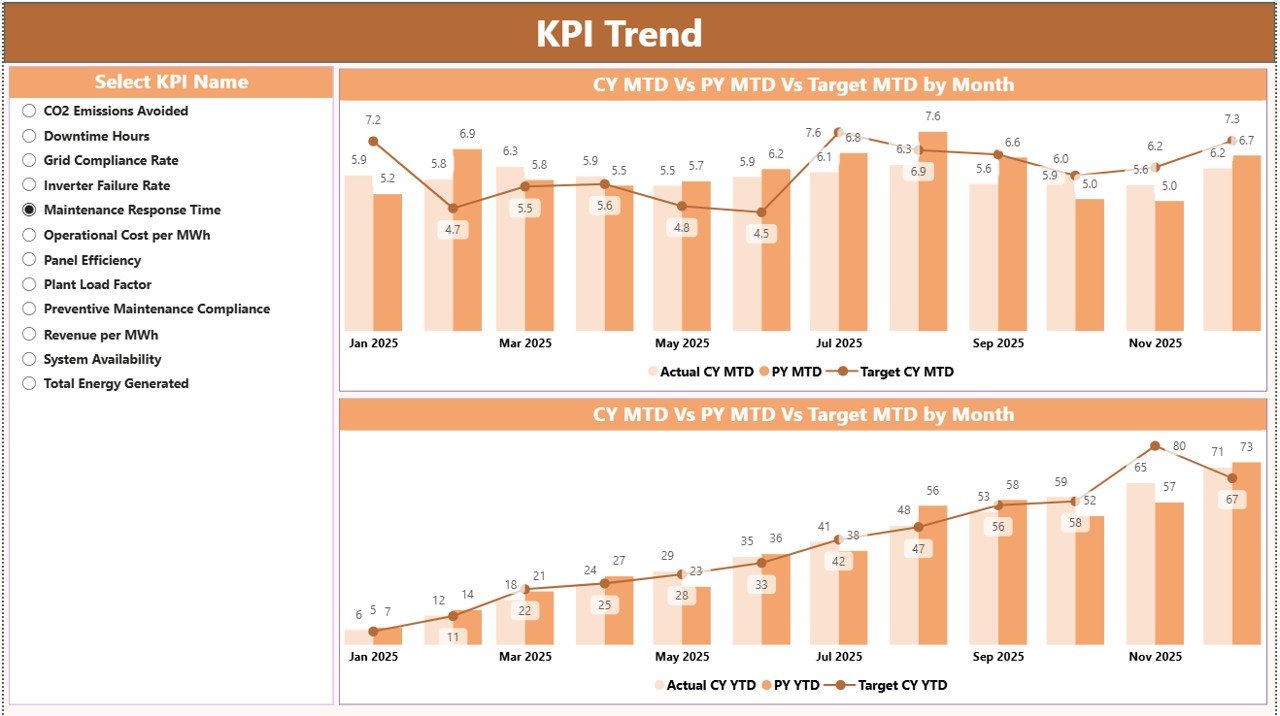
2️⃣ KPI Trend Page – Performance Over Time
Analyze KPI progress using combo charts comparing targets, current year values, and previous year performance trends.
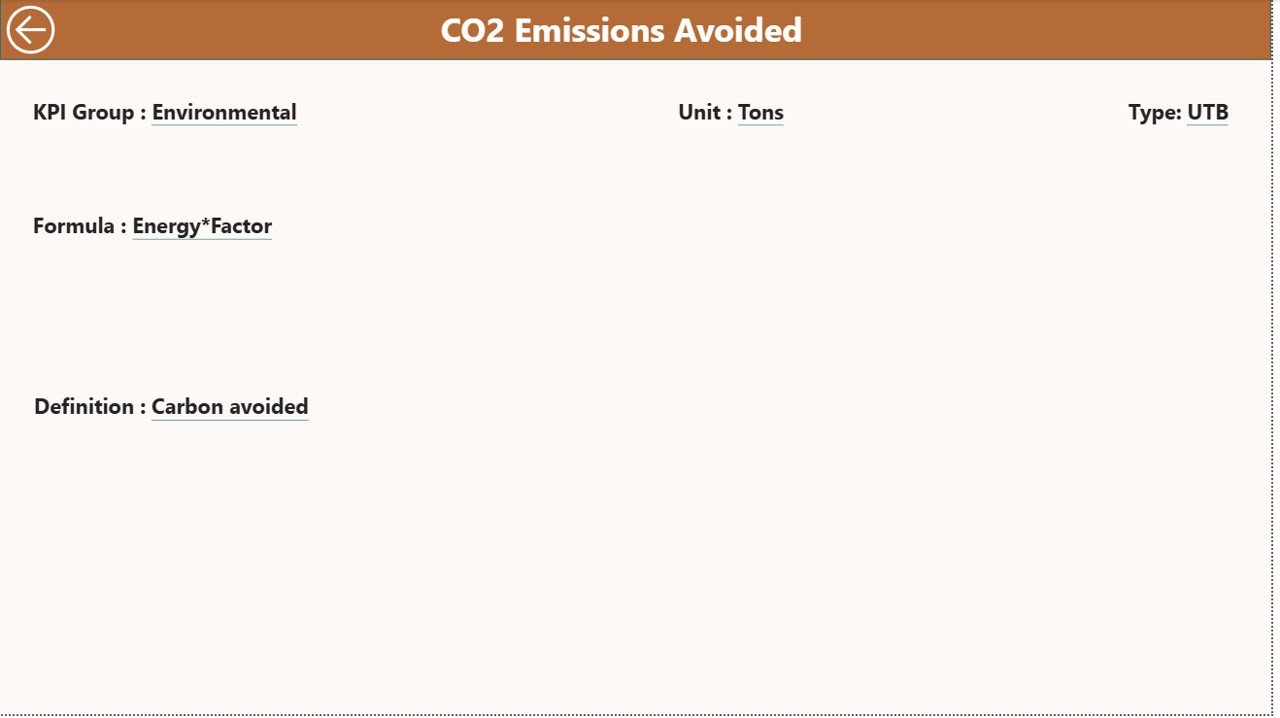
3️⃣ KPI Definition Page – KPI Intelligence Layer
Drill into KPI formulas, definitions, units, and classifications for complete transparency and understanding.
Additionally, the dashboard connects seamlessly with Excel data sources, making updates simple and user-friendly.
⚙️ How to Use the Solar Parks KPI Dashboard in Power BI
Using this dashboard requires no advanced technical expertise.
Step 1: Update monthly Actual and Target values in Excel sheets.
Step 2: Click Refresh in Power BI.
Step 3: Select month or KPI group using slicers.
Step 4: Review KPI performance indicators instantly.
Step 5: Analyze trends on the KPI Trend page.
Step 6: Drill into KPI definitions when deeper insights are required.
Within minutes, you gain a complete operational overview without manual calculations.
👥 Who Can Benefit from This Solar Parks KPI Dashboard in Power BI
This dashboard is designed for professionals across the renewable energy ecosystem:
🌞 Solar Park Operators
⚡ Renewable Energy Companies
📊 Energy Analysts
🏭 Plant Managers
🌱 Sustainability Officers
📈 Operations & Performance Teams
💼 Investors and Stakeholders
Because the dashboard uses an Excel backend, both technical and non-technical users can operate it easily.
Modern solar park management demands data-driven decisions. Without structured analytics, organizations face delayed reporting, scattered data, and limited operational visibility.
The Solar Parks KPI Dashboard in Power BI eliminates these challenges by providing centralized monitoring, automated analysis, and powerful visualization capabilities. It enables teams to detect inefficiencies early, optimize performance, and improve ROI while supporting sustainability goals.
If you want faster insights, smarter decisions, and professional renewable energy analytics — this dashboard is your complete solution.
Click here to read the Detailed blog post
Watch the step-by-step video tutorial:


