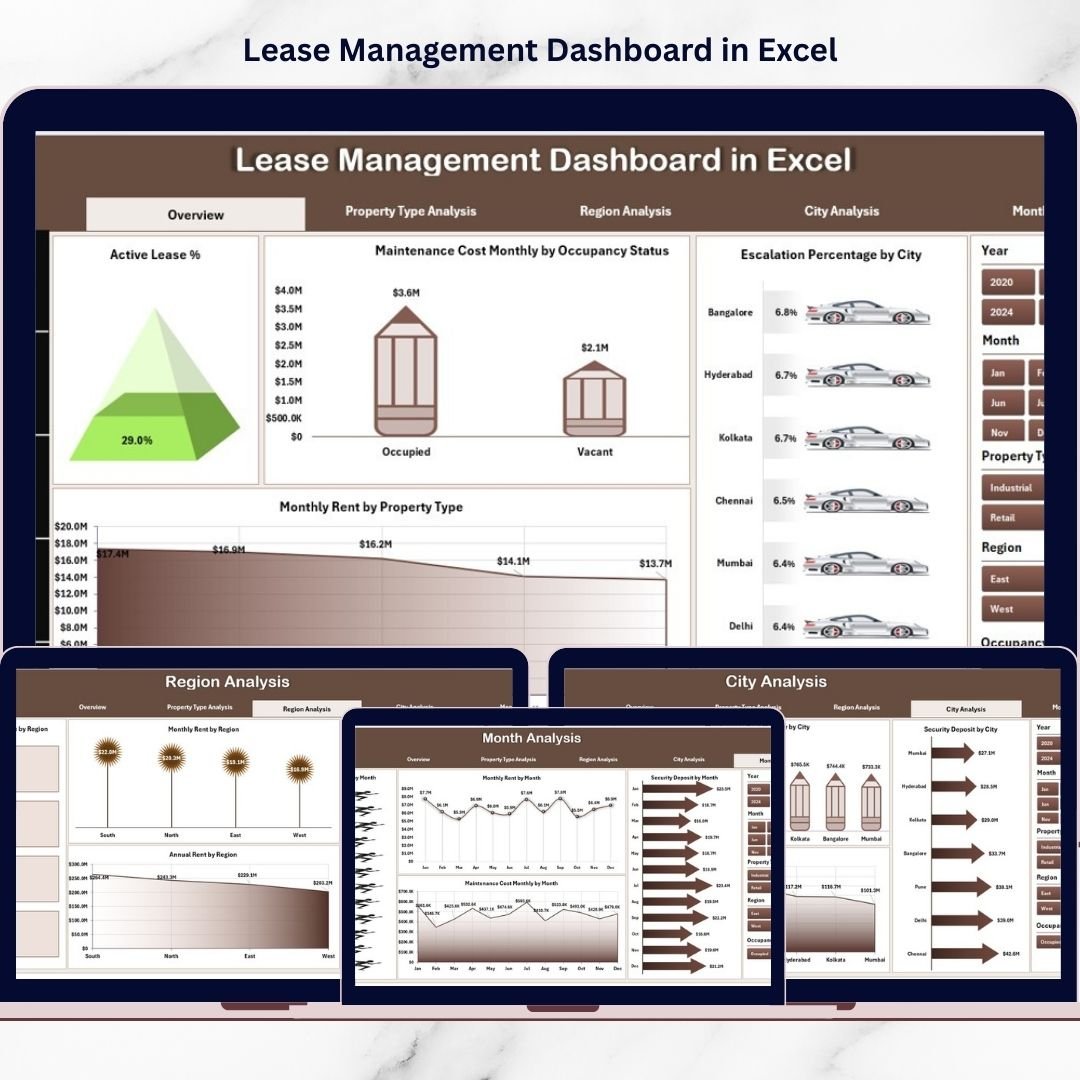
Managing lease portfolios manually often leads to confusion, delays, and costly reporting errors. When rent, deposits, escalation clauses, and maintenance costs live in scattered files, decision-making slows down. However, with the Lease Management Dashboard in Excel, you gain instant visibility and full control over your lease portfolio.
This ready-to-use Excel dashboard is designed for property managers, finance teams, real estate companies, and facility managers who want professional-grade lease analytics without investing in expensive software. Moreover, it uses Pivot Tables and dynamic charts, so your reports update quickly whenever new data is added.
If you want to monitor lease performance smarter and faster, this dashboard is your complete control center.
🚀 Key Feature of Lease Management Dashboard in Excel
The dashboard includes 5 powerful analytical pages supported by a clean left-side page navigator for smooth navigation.
✨ Top Highlights
-
Interactive Page Navigator
-
Right-side dynamic slicers
-
Pivot-based automated charts
-
Fully Excel-driven solution
-
Professional executive layout
-
Easy refresh with new data
📊 Analytical Pages Included
-
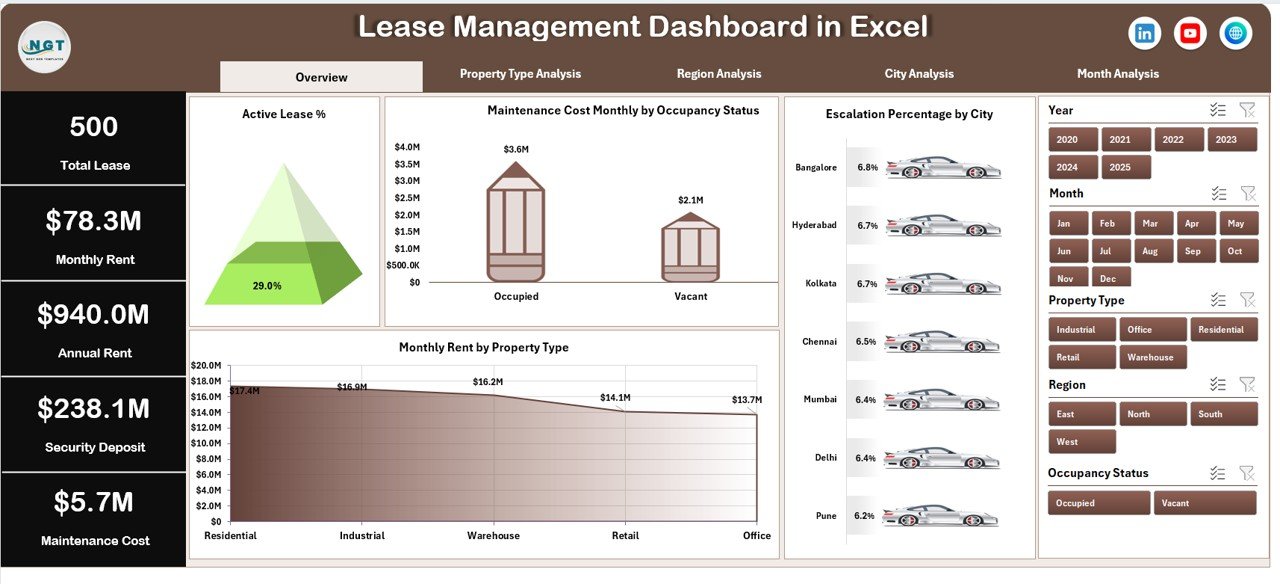
Overview Page
-
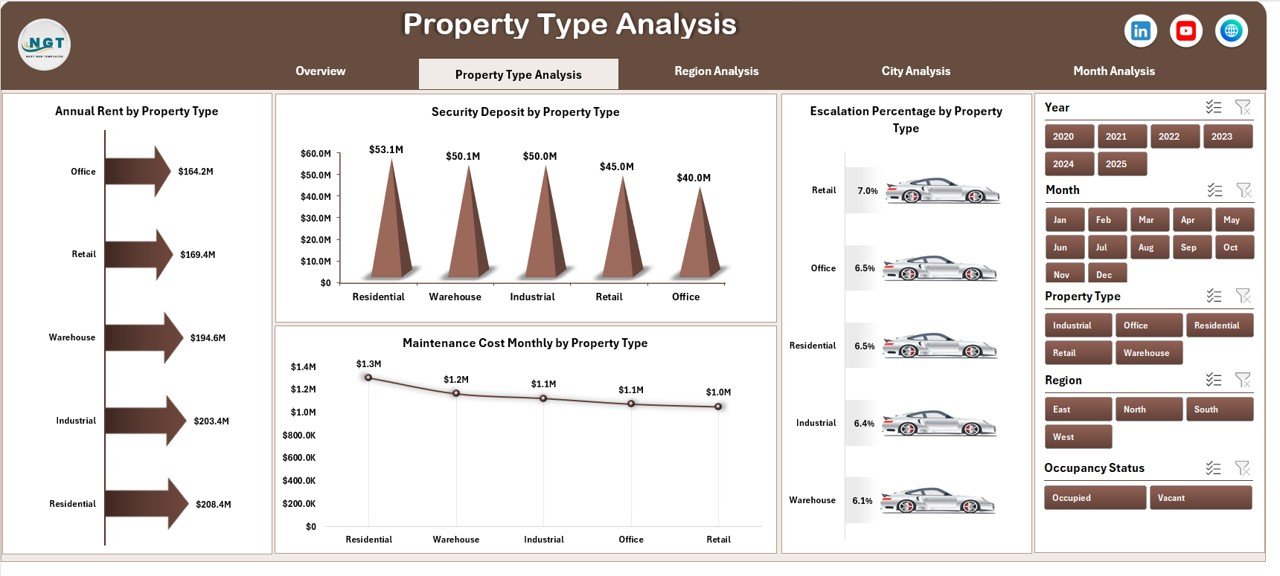
Property Type Analysis
-
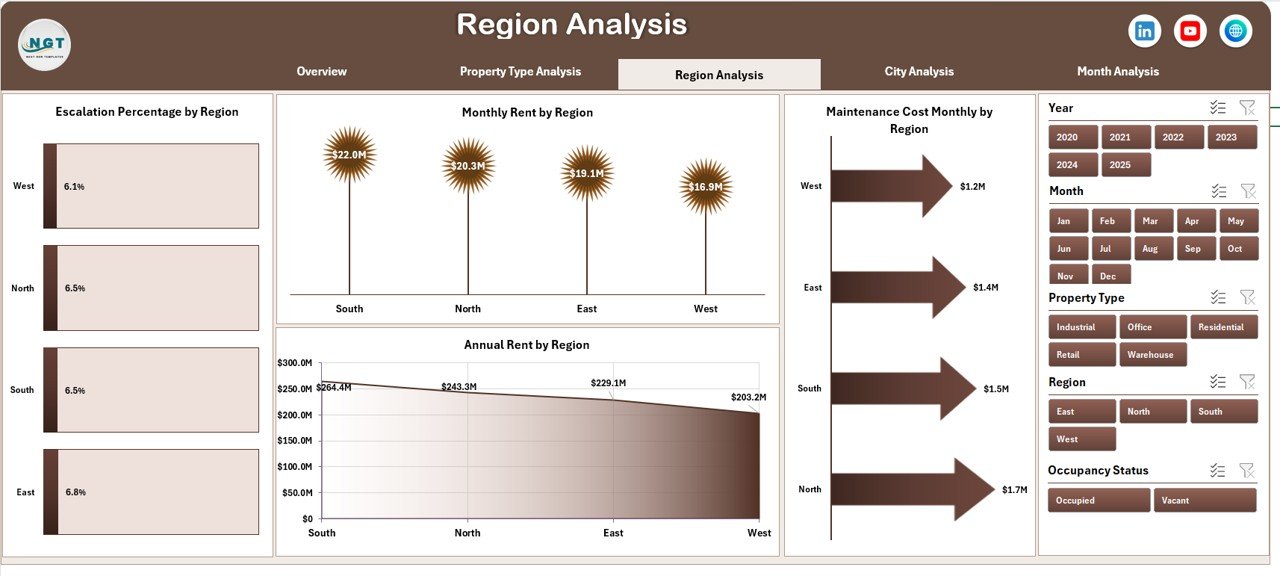
Region Analysis
-
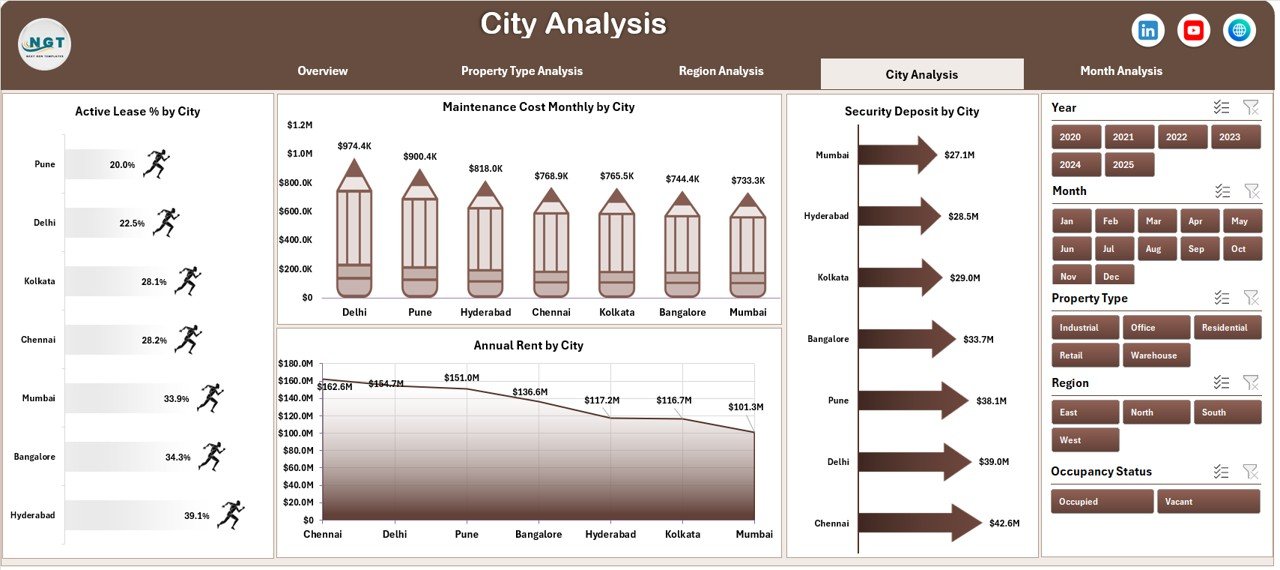
City Analysis
-
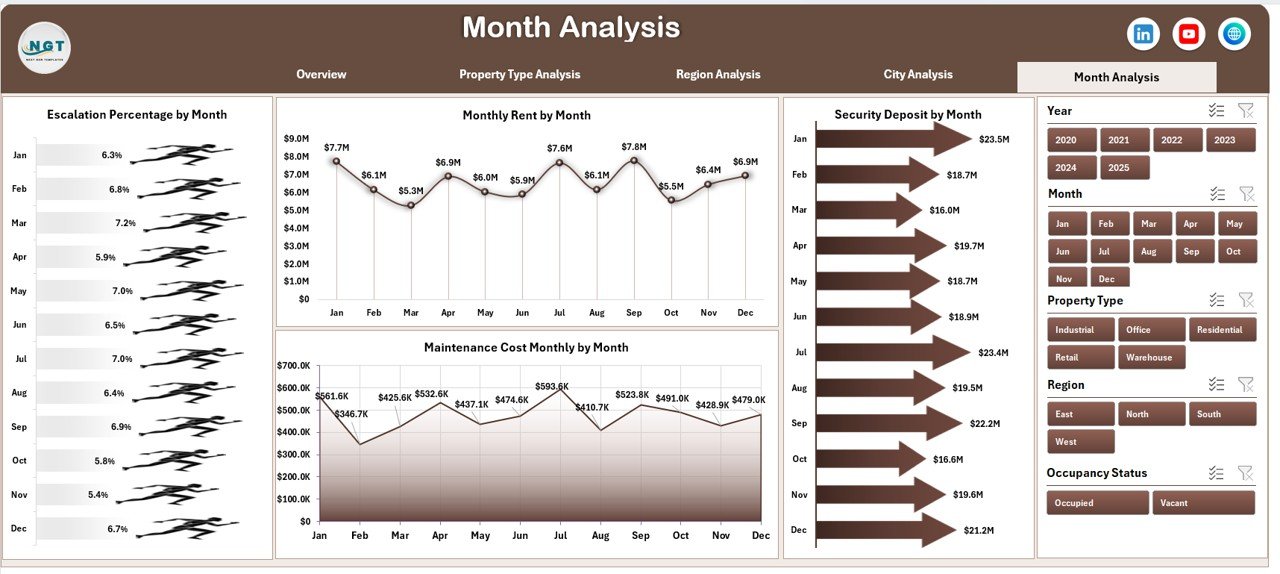
Month Analysis
Because everything is interconnected, you can move from high-level insights to deep analysis within seconds.
📦 What’s Inside the Lease Management Dashboard in Excel
This ready-to-use template includes everything you need to start immediately:
✔ 5 Interactive Dashboard Pages
✔ 4 KPI Summary Cards
✔ Dynamic Pivot Charts
✔ Right-Side Filter Slicer
✔ Structured Data Sheet
✔ Backend Support Sheet
✔ Property Performance Analytics
✔ Maintenance Cost Tracking
✔ Escalation Monitoring
✔ Occupancy Insights
Simply update the Data Sheet and refresh the pivots — the dashboard updates automatically.
🛠 How to Use the Lease Management Dashboard in Excel
Getting started is quick and simple:
1️⃣ Enter lease records in the Data Sheet.
2️⃣ Ensure region, city, and property type names are consistent.
3️⃣ Refresh Pivot Tables.
4️⃣ Use the right-side slicer to filter views.
5️⃣ Review the Overview Page for quick health checks.
6️⃣ Drill into Property, Region, City, and Month pages for deeper insights.
For example:
-
If Active Lease % drops, investigate vacant properties.
-
If maintenance cost rises, review cost-heavy locations.
-
If escalation % spikes, evaluate pricing strategy.
Because the dashboard is fully dynamic, insights appear instantly.
👥 Who Can Benefit from This Lease Management Dashboard?
This dashboard is perfect for:
🏢 Real Estate Companies
🏬 Property Managers
🏭 Facility Management Teams
💼 Finance Departments
📊 Leasing Consultants
🏘 Commercial Property Owners
Whether you manage a small portfolio or hundreds of properties, this dashboard scales easily.
📊 What Lease Metrics Can You Track?
The dashboard helps you monitor critical KPIs such as:
-
Active Lease %
-
Monthly Rent
-
Annual Rent
-
Security Deposits
-
Escalation %
-
Maintenance Costs
-
Property Performance by Type
-
Region & City Performance
-
Monthly Lease Trends
Because the data structure is flexible, you can expand it anytime.
💡 How This Dashboard Improves Decision-Making
When you use this dashboard regularly:
-
You detect vacant properties faster
-
You control maintenance spending
-
You optimize rent strategies
-
You identify high-growth cities
-
You improve occupancy planning
-
You strengthen financial visibility
Instead of reacting late, your team makes proactive, data-driven decisions.
⭐ Why Choose This Lease Dashboard?
-
No expensive software required
-
Works in standard Excel
-
Fast implementation
-
Executive-ready visuals
-
Highly customizable
-
Scalable for growing portfolios
Because most teams already use Excel, adoption becomes effortless.
Click here to read the Detailed blog post
Visit our YouTube channel to learn step-by-step video tutorials


