Running an IoT Service Business Without Clear KPIs? That’s Risky in a 24/7 Connected World 🌐⚡
IoT service providers manage massive device networks, real-time data streams, uptime commitments, SLA agreements, and customer expectations. Everything runs continuously. IoT Services KPI Dashboard in Excel One small delay or unnoticed downtime can damage reputation and profitability.
Yet many IoT businesses still rely on scattered spreadsheets and manual reporting.
The result?
Missed SLA breaches.
Rising incident backlogs.
Uncontrolled operational costs.
Declining customer satisfaction.
IoT Services KPI Dashboard in Excel the IoT Services KPI Dashboard in Excel gives you a structured, ready-to-use performance management system built specifically for IoT service providers.
Instead of reviewing raw logs, you monitor structured KPIs.
Instead of reacting late, you act early.
This powerful Excel dashboard centralizes operational, financial, and customer metrics into one dynamic and intelligent reporting framework.
Key Feature of IoT Services KPI Dashboard in Excel 📊
This professionally designed template includes 7 structured worksheets that work seamlessly together:
✅ Dynamic Month Selection (Cell D3) – Instantly analyze any month.
✅ MTD & YTD Performance Tracking – Monitor short-term and long-term results.
✅ Actual vs Target Comparison – Identify performance gaps quickly.
✅ Previous Year Benchmarking – Measure Year-over-Year growth.
✅ Conditional Formatting Arrows – Visual up/down indicators for clarity.
✅ KPI Classification (LTB / UTB) – Logical performance evaluation.
✅ Detailed KPI Trend Charts – Analyze patterns over time.
✅ Structured KPI Documentation – Clear definitions and formulas.
Because it runs entirely in Excel, you retain full control over your data while enjoying flexibility and customization.
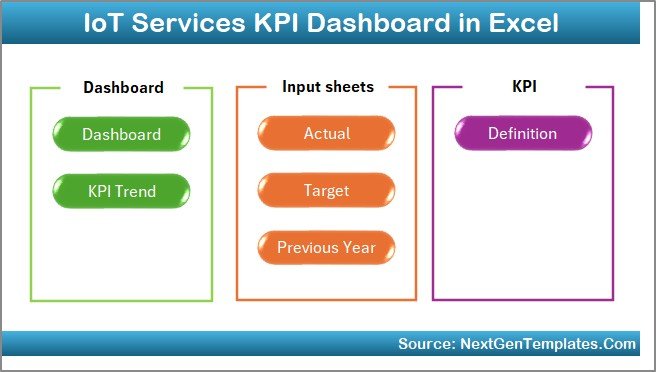
What’s Inside the IoT Services KPI Dashboard in Excel 📁
You receive a complete Excel workbook with 7 powerful sheets:
🏠 1️⃣ Home Sheet – Navigation Hub
Includes 6 interactive buttons for quick movement across sheets.
Clean layout improves usability and workflow efficiency.
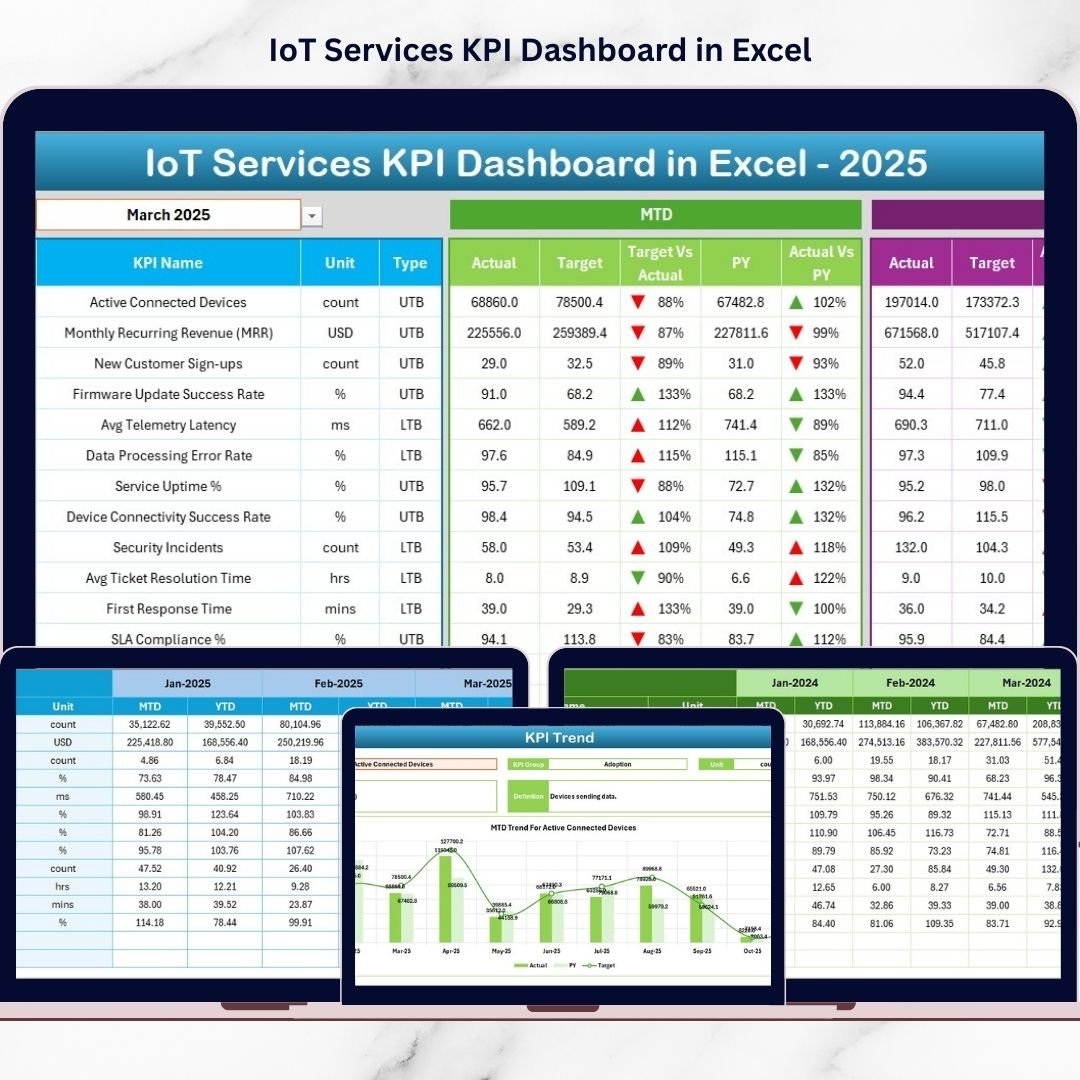
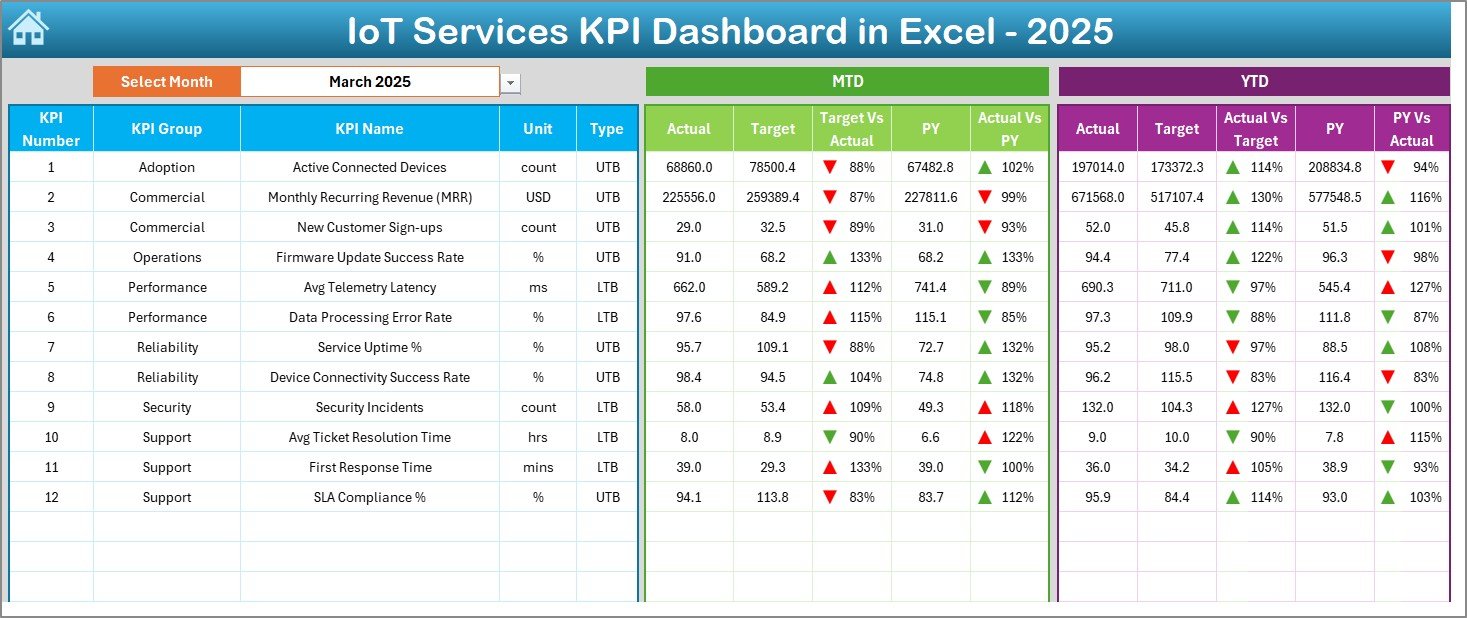
📈 2️⃣ Dashboard Sheet – Main Performance Overview
Select month from Cell D3 and the entire dashboard updates automatically.
For each KPI, you can view:
MTD Section:
-
Actual
-
Target
-
Previous Year
-
Target vs Actual %
-
PY vs Actual %
YTD Section:
-
Actual
-
Target
-
Previous Year
-
Target vs Actual %
-
PY vs Actual %
Conditional arrows instantly show performance improvement or decline.
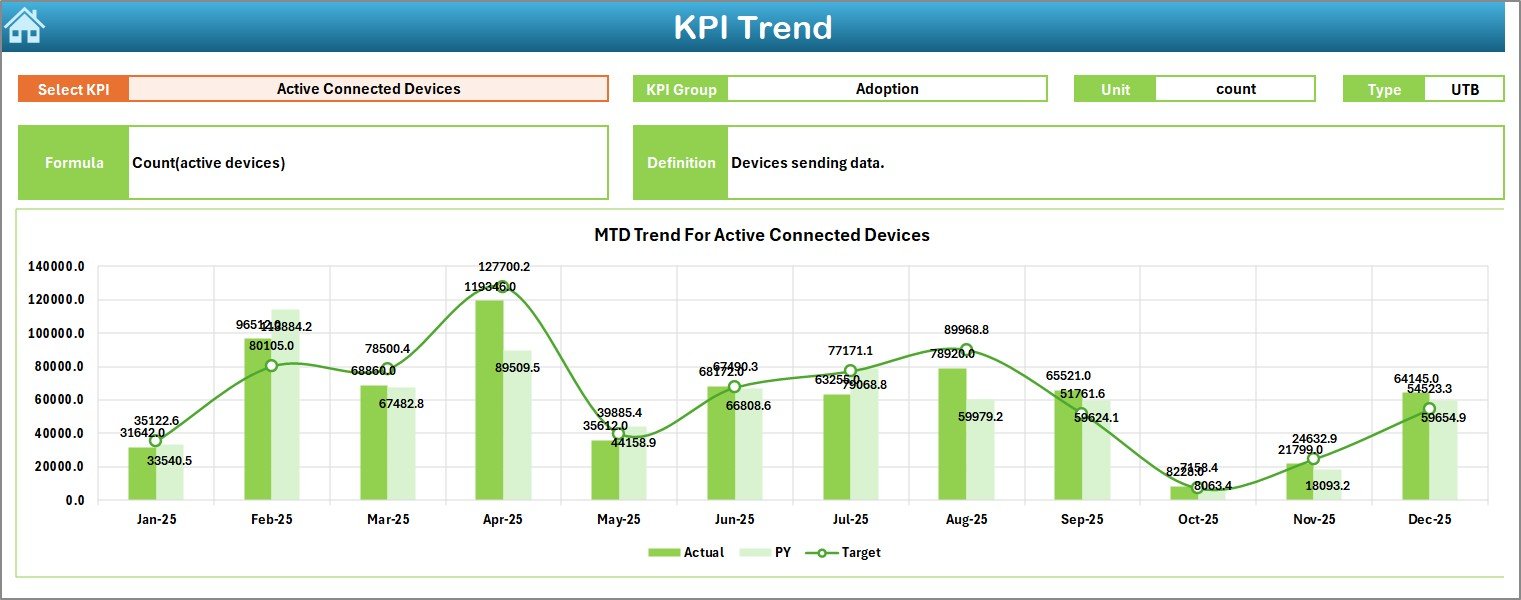
📊 3️⃣ KPI Trend Sheet – Deep Analysis View
Select KPI from dropdown (Cell C3) and analyze:
-
KPI Group
-
Unit
-
Type (Lower the Better / Upper the Better)
-
Formula
-
KPI Definition
Includes:
-
MTD Trend Chart (Actual vs Target vs PY)
-
YTD Trend Chart (Actual vs Target vs PY)
Trend visibility helps detect uptime decline, SLA breaches, or revenue growth patterns.
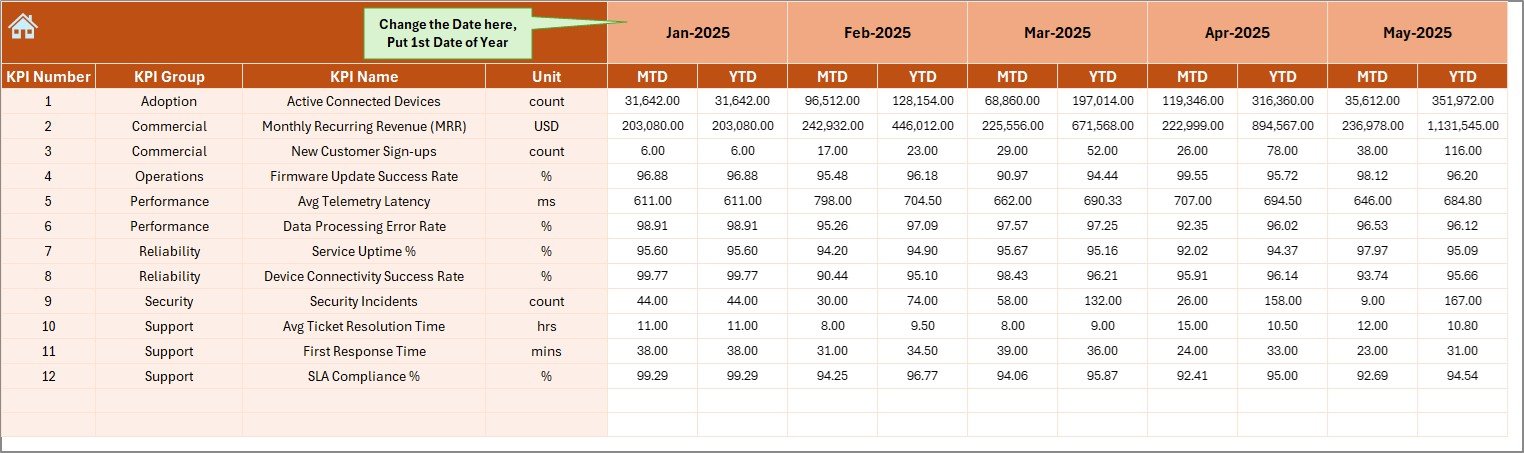
📝 4️⃣ Actual Numbers Input Sheet
Enter:
-
Monthly MTD values
-
Monthly YTD values
Set first month of year in Cell E1.
Dashboard updates automatically.
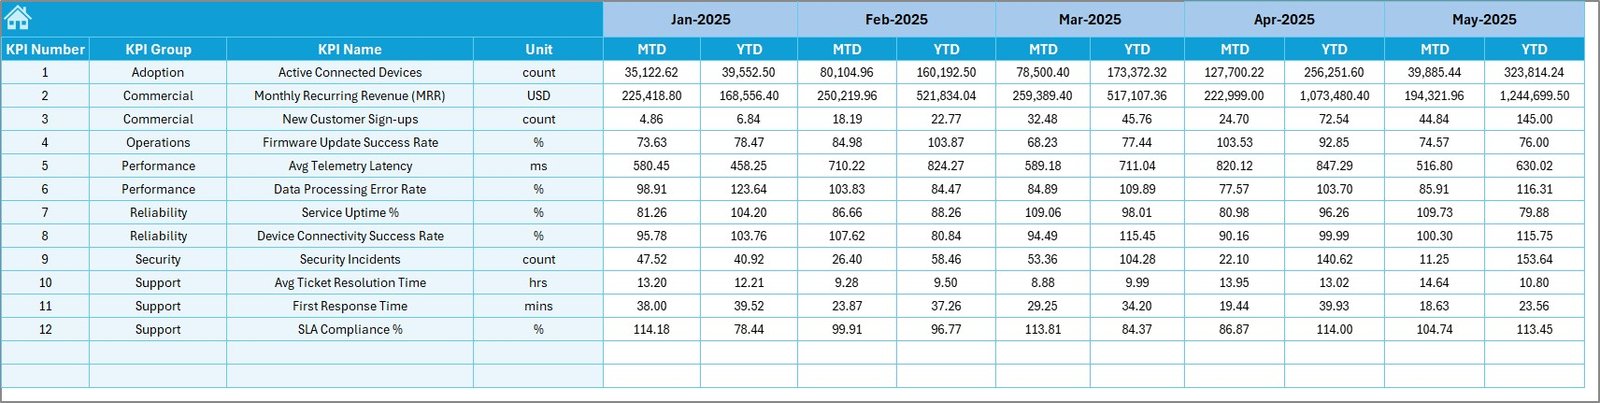
🎯 5️⃣ Target Sheet
Define:
-
Monthly Target (MTD)
-
Cumulative Target (YTD)
Targets create accountability and measurable performance standards.
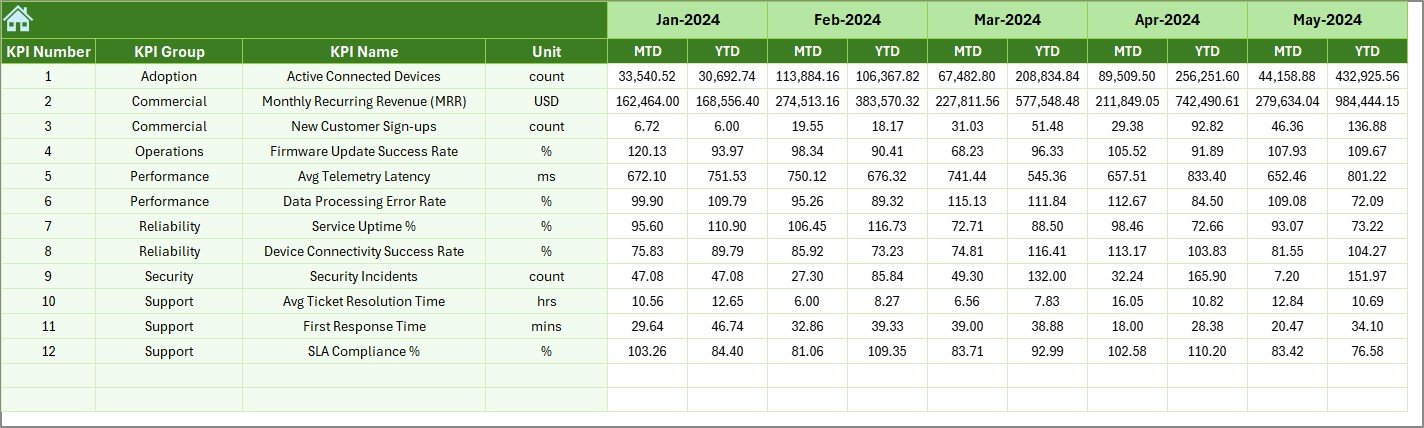
📆 6️⃣ Previous Year Numbers Sheet
Store:
-
Previous Year MTD
-
Previous Year YTD
Supports growth analysis and strategic benchmarking.
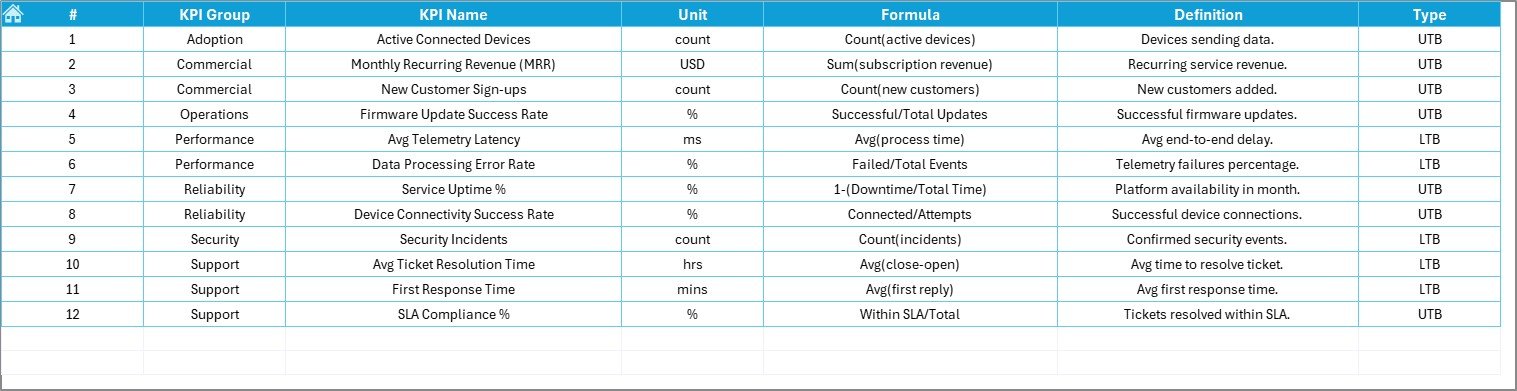
📘 7️⃣ KPI Definition Sheet
Define:
-
KPI Name
-
KPI Group
-
Unit
-
Formula
-
Definition
Ensures consistency, governance, and audit clarity.
How to Use the IoT Services KPI Dashboard in Excel ⚙️
Step 1: Define KPIs
Choose operational, financial, and customer metrics.
Step 2: Enter Targets
Set measurable goals aligned with SLA and revenue objectives.
Step 3: Input Actual Data
Update monthly MTD and YTD values.
Step 4: Select Reporting Month
Use dropdown in D3 to analyze specific periods.
Step 5: Review Trends & Variances
Identify red arrows and performance gaps.
Step 6: Take Action
Implement corrective steps proactively.
Within minutes, your IoT reporting transforms from scattered logs to structured intelligence.
Who Can Benefit from This IoT Services KPI Dashboard in Excel 👥
This dashboard is ideal for:
✔ IoT Service Providers
✔ Network Operations Managers
✔ Service Delivery Managers
✔ Technical Support Teams
✔ Operations Leaders
✔ Financial Controllers
✔ SaaS & Connected Device Companies
Whether you manage small IoT deployments or large enterprise networks, this dashboard adapts to your needs.
How This Dashboard Improves IoT Performance 🚀
It helps you:
🔹 Monitor device uptime percentage
🔹 Track SLA compliance rate
🔹 Reduce incident resolution time
🔹 Control operational costs
🔹 Improve revenue visibility
🔹 Enhance customer satisfaction
Because performance gaps are visible immediately, leadership can respond quickly.
Instead of reacting to SLA penalties, you prevent them.
If scalability, reliability, and profitability matter to your IoT business — this KPI Dashboard is your performance command center.
Click here to read the Detailed blog post
Visit our YouTube channel to learn step-by-step video tutorials
👉 Youtube.com/@PKAnExcelExpert