Managing a wood and furniture factory without clear visibility into cost, production efficiency, and delivery performance can quickly reduce profit margins. Raw material prices fluctuate. Production delays impact delivery schedules. Even small inefficiencies in one production line can silently reduce overall profitability.
What if you could monitor production cost, revenue, profit margin, order volume, wood type performance, and delivery efficiency — all inside one powerful Excel dashboard?
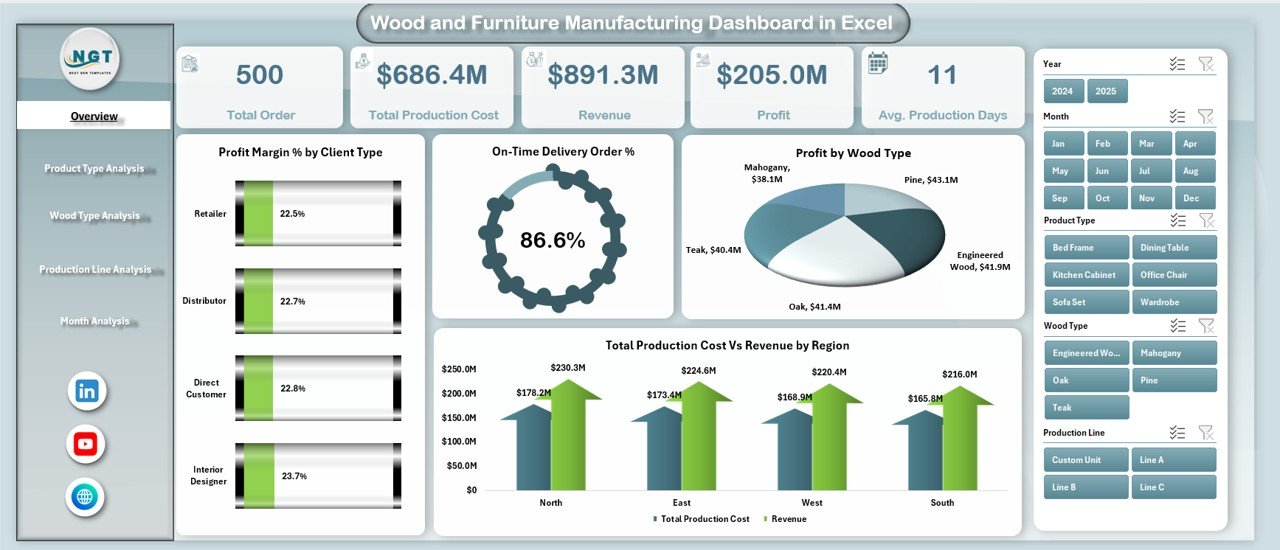
Introducing the Wood and Furniture Manufacturing Dashboard in Excel — a ready-to-use, interactive performance monitoring system built specifically for furniture manufacturers and wood processing units.
This dashboard converts your raw factory data into dynamic KPI cards, pivot charts, and slicer-based insights. Instead of compiling manual reports for hours, you can analyze trends instantly and make faster, data-driven decisions.
No complicated setup. No expensive software. Just structured manufacturing intelligence inside Excel.
🚀 Key Feature of Wood and Furniture Manufacturing Dashboard in Excel
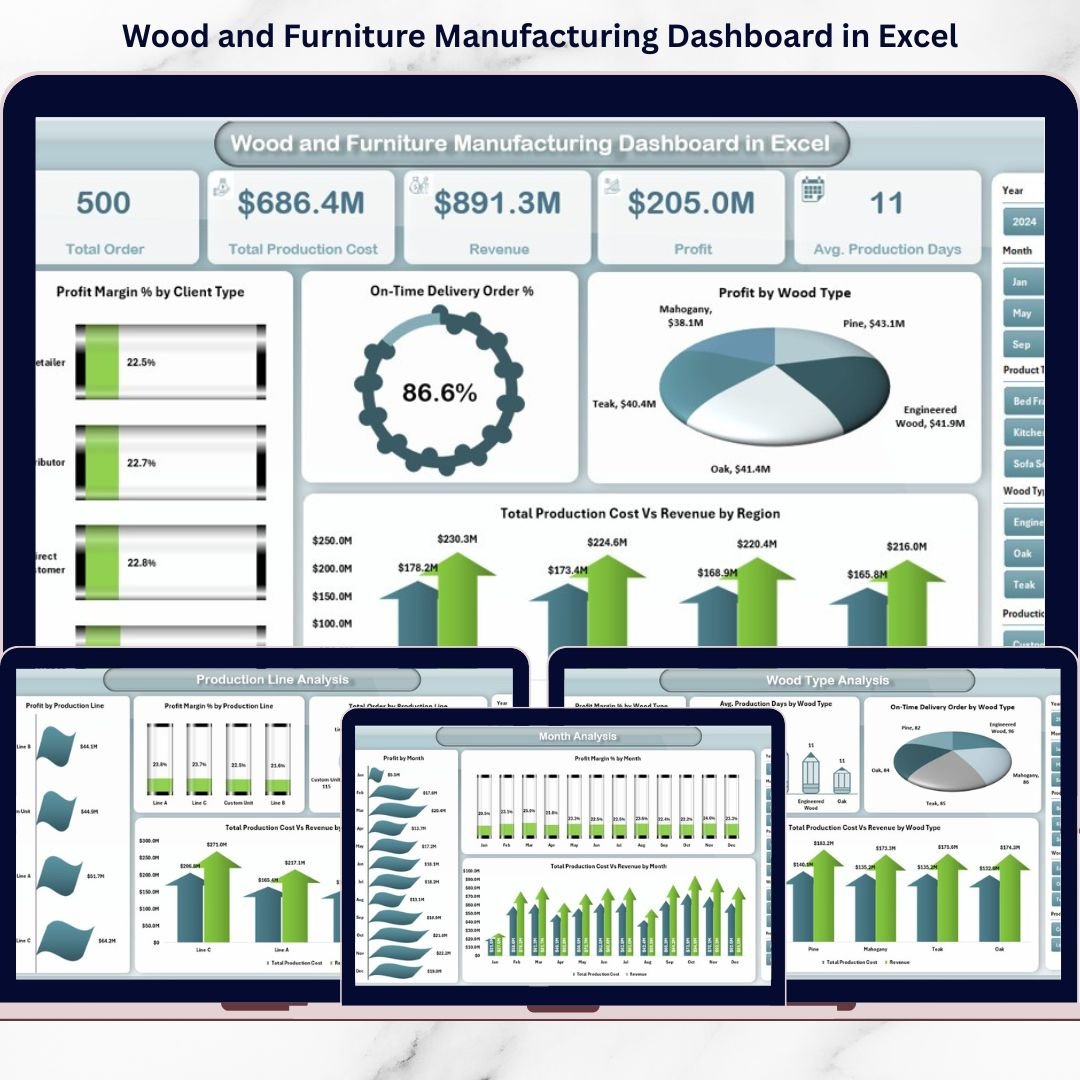
📊 5 Fully Interactive Dashboard Pages – Overview, Product Type, Wood Type, Production Line, and Month Analysis.
🎯 Powerful KPI Cards – Instantly track Total Orders, Total Revenue, Total Profit, and On-Time Delivery %.
💰 Production Cost vs Revenue Comparison – Protect margins with clear profitability analysis.
🪵 Wood Type Performance Insights – Evaluate cost, margin, and production days by wood category.
🏭 Production Line Monitoring – Identify underperforming or high-cost manufacturing lines.
📆 Monthly Trend Analysis – Detect seasonal demand and cost fluctuations.
🔄 Right-Side Slicers – Filter by region, product type, wood type, or production line instantly.
📦 What’s Inside the Wood and Furniture Manufacturing Dashboard in Excel
This structured Excel file includes:
1️⃣ Overview Page – Business Snapshot
-
4 KPI Cards:
-
Total Orders
-
Total Revenue
-
Total Profit
-
On-Time Delivery %
-
-
4 Key Charts:
-
On-Time Delivery %
-
Profit Margin % by Client Type
-
Total Orders by Product Type
-
Production Cost vs Revenue by Region
-
This page provides a complete performance overview at a glance.
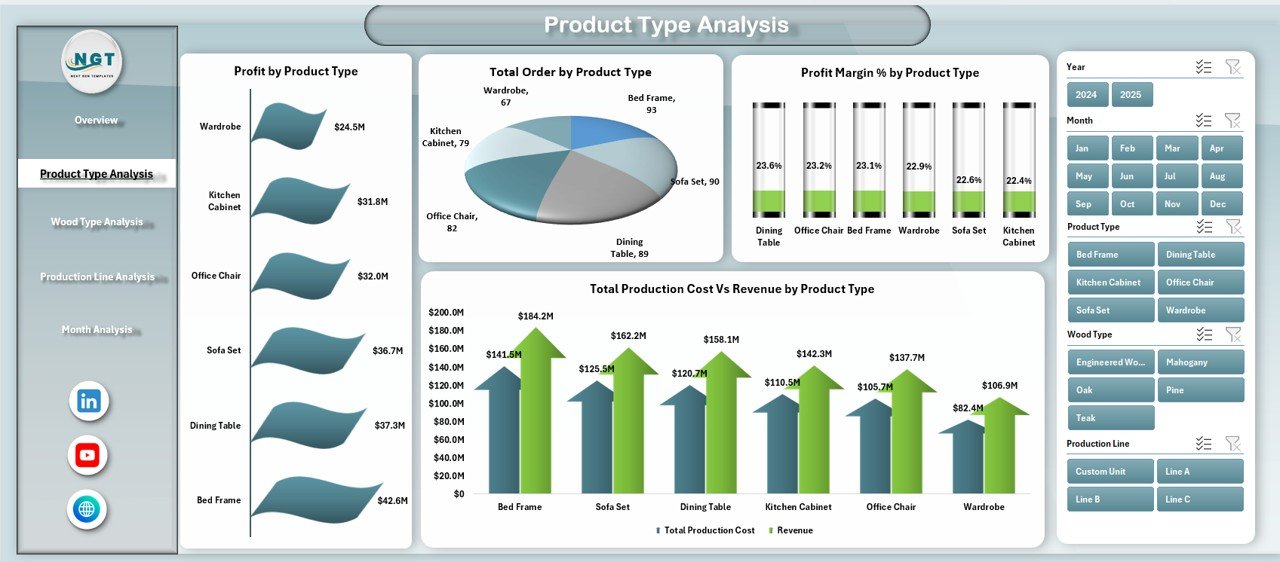
2️⃣ Product Type Analysis
Analyze performance of chairs, tables, cabinets, beds, office furniture, and custom designs.
Includes:
-
Profit Margin % by Product Type
-
Profit by Product Type
-
Production Cost vs Revenue by Product Type
-
Total Orders by Product Type
Quickly identify high-margin and low-performing products.
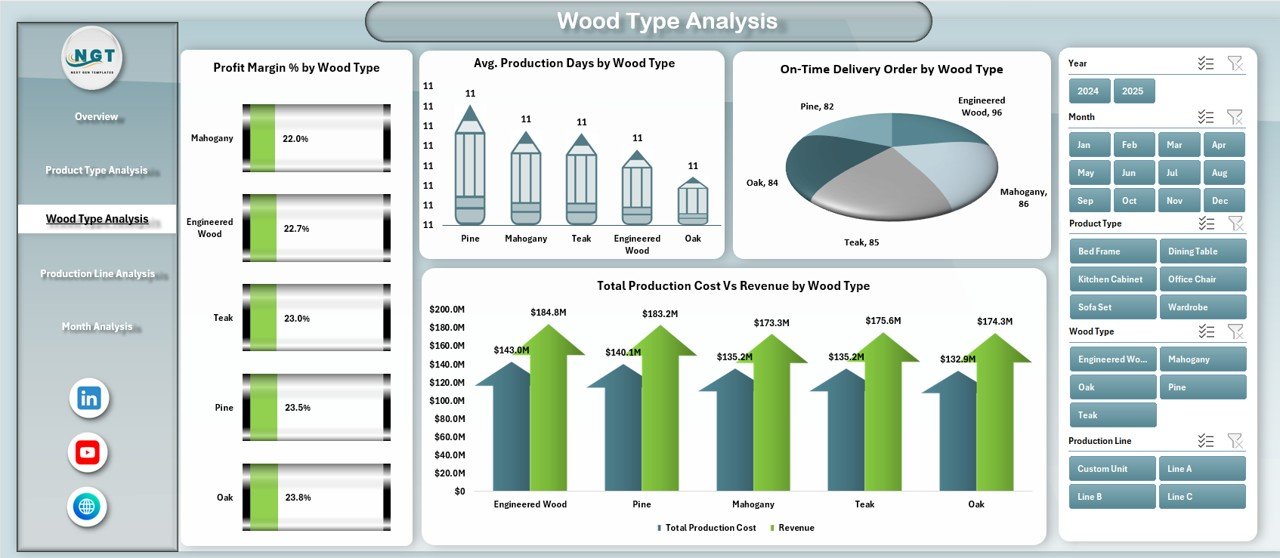
3️⃣ Wood Type Analysis
Evaluate how different raw materials affect cost and delivery performance.
Includes:
-
Profit Margin % by Wood Type
-
Average Production Days by Wood Type
-
Production Cost vs Revenue by Wood Type
-
On-Time Delivery % by Wood Type
Optimize material selection and reduce waste.
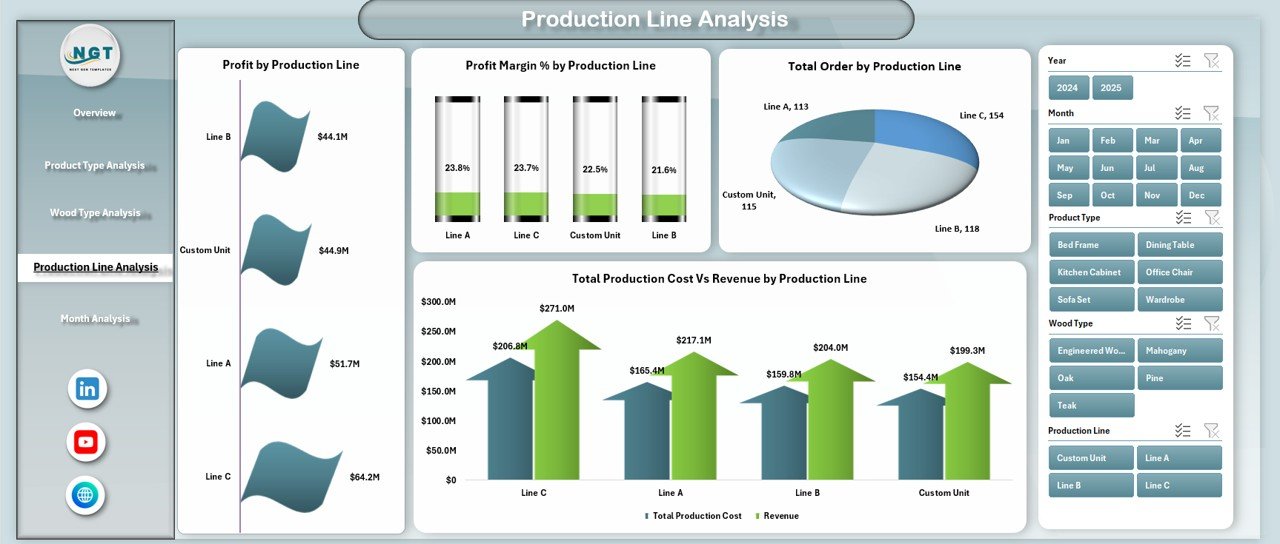
4️⃣ Production Line Analysis
Monitor efficiency and profitability of different production lines.
Includes:
-
Profit Margin % by Production Line
-
Profit by Production Line
-
Production Cost vs Revenue by Production Line
-
Total Orders by Production Line
Detect bottlenecks and improve machine utilization.
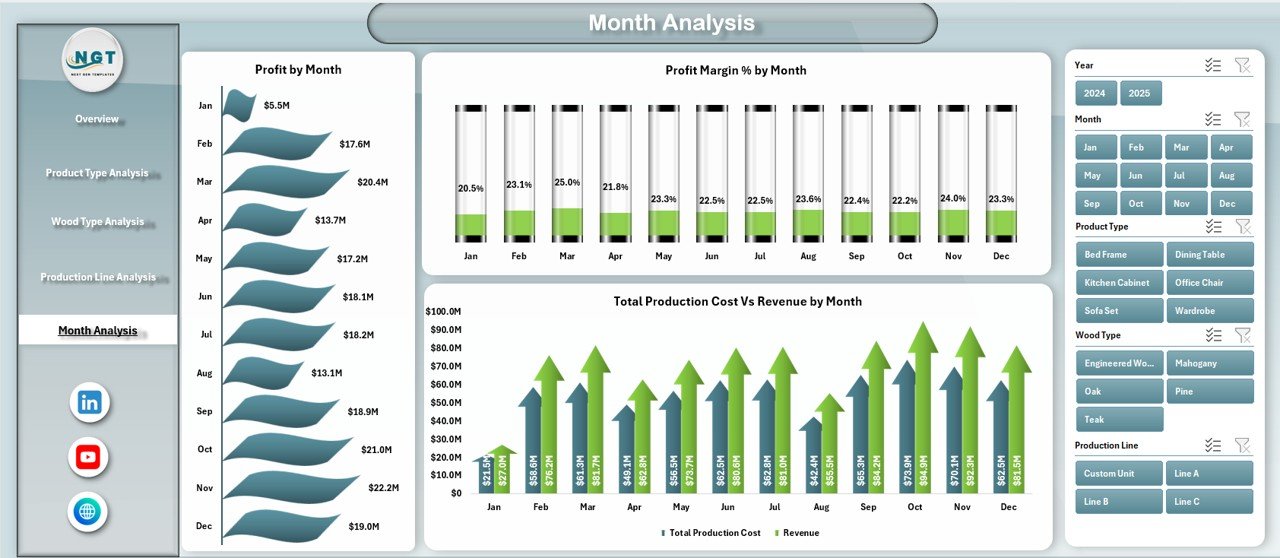
5️⃣ Month Analysis
Track seasonal trends and performance changes.
Includes:
-
Profit Margin % by Month
-
Profit by Month
-
Production Cost vs Revenue by Month
Improve forecasting and workforce planning.
🛠 How to Use the Wood and Furniture Manufacturing Dashboard in Excel
Using the dashboard is simple:
1️⃣ Enter structured data in the Data Sheet (Order ID, Product Type, Wood Type, Cost, Revenue, etc.).
2️⃣ Ensure consistent date and category formatting.
3️⃣ Refresh pivot tables if required.
4️⃣ Use slicers to filter insights instantly.
5️⃣ Review KPI cards and charts for actionable decisions.
Because calculations run in the background via Pivot Tables and support sheets, the dashboard remains clean and efficient.
👥 Who Can Benefit from This Wood and Furniture Manufacturing Dashboard in Excel
✔ Furniture Manufacturers
✔ Wood Processing Units
✔ Factory Owners
✔ Production Managers
✔ Operations Heads
✔ Finance Managers
✔ Manufacturing Supervisors
Whether you operate a small workshop or a large factory, this dashboard helps you monitor performance professionally.
Why This Dashboard Can Transform Your Manufacturing Operations
Instead of reacting to cost overruns, you detect them early.
Instead of guessing which product generates profit, you see exact margin percentages.
Instead of struggling with production inefficiencies, you identify underperforming lines instantly.
From wood selection to production speed, from revenue tracking to delivery performance — every important KPI becomes visible and measurable.
If you want better cost control, stronger margins, improved delivery performance, and smarter production planning, this dashboard becomes your competitive advantage.
Click here to read the Detailed blog post
Visit our YouTube channel to learn step-by-step video tutorials
👉 YouTube Channel – PKAnExcelExpert