Equipment breakdowns don’t just interrupt operations — they drain budgets, reduce productivity, and increase safety risks. If you are still tracking maintenance activities in scattered spreadsheets, you are already losing time and money.Now imagine having complete visibility over maintenance schedules, overdue tasks, technician performance, and maintenance costs — all in one powerful, interactive system.That’s exactly what the Preventive Maintenance Dashboard in Power BI delivers.This ready-to-use Power BI solution transforms raw maintenance data into meaningful visual insights. Instead of manually checking reports, you can instantly filter by equipment, maintenance type, frequency, technician, or time period — and make smarter decisions in seconds.
Whether you manage manufacturing equipment, facility assets, or service operations, this dashboard gives you full control over preventive maintenance performance.
🚀 Key Features of Preventive Maintenance Dashboard in Power BI
✅ 5 Fully Interactive Dashboard Pages for complete maintenance tracking
✅ Real-Time KPI Cards showing Scheduled %, Completed %, Overdue %, and Cost (USD)
✅ Equipment-Wise Cost & Performance Monitoring
✅ Maintenance Type & Frequency Analysis
✅ Technician Productivity Tracking
✅ Powerful Slicers for dynamic filtering
✅ Clean, professional, management-ready design
✅ Easy integration with Excel or ERP data
This dashboard acts as your maintenance command center.
📊 What’s Inside the Preventive Maintenance Dashboard
This Power BI file includes 5 advanced analytical pages:
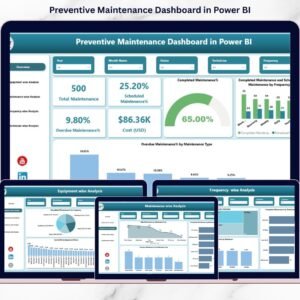
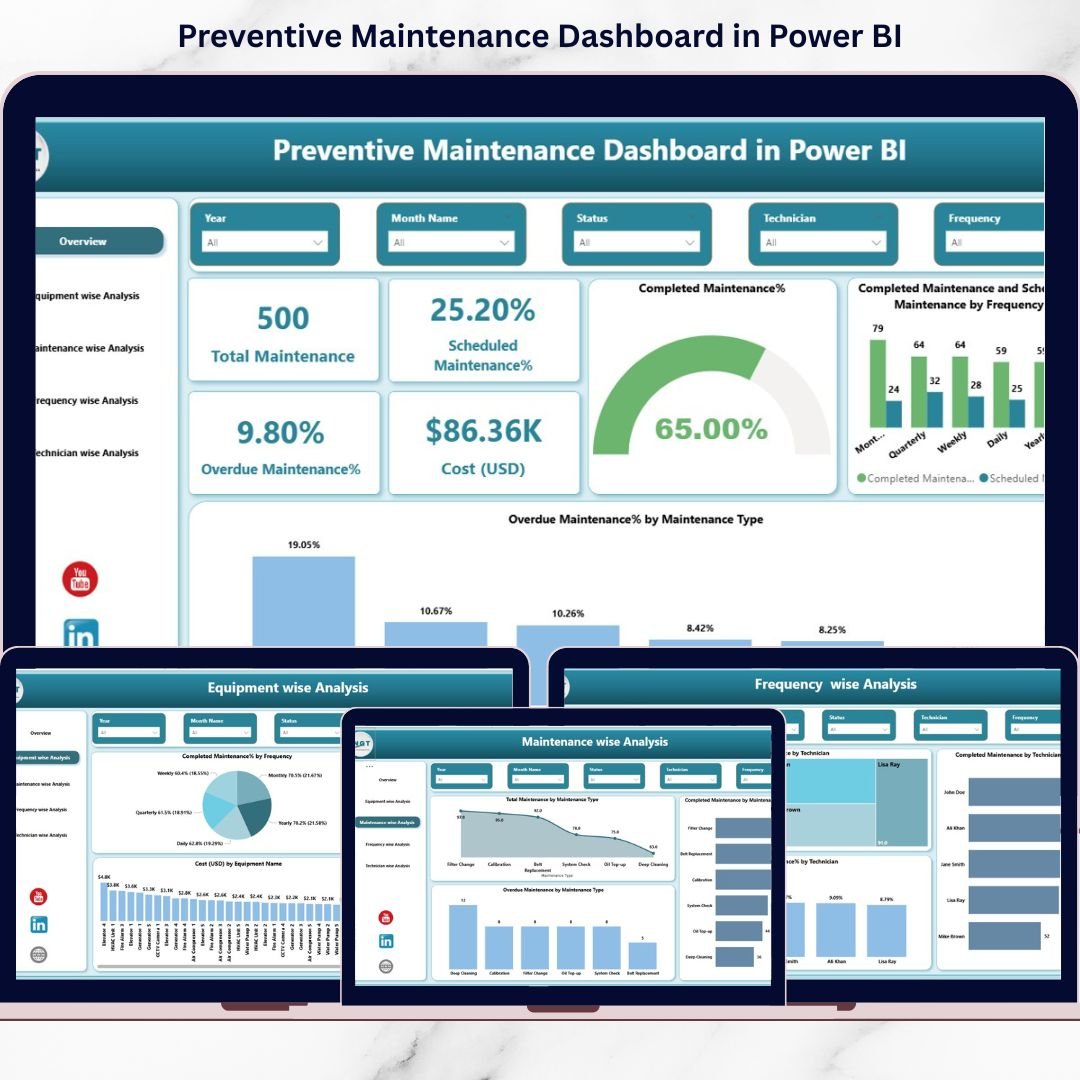
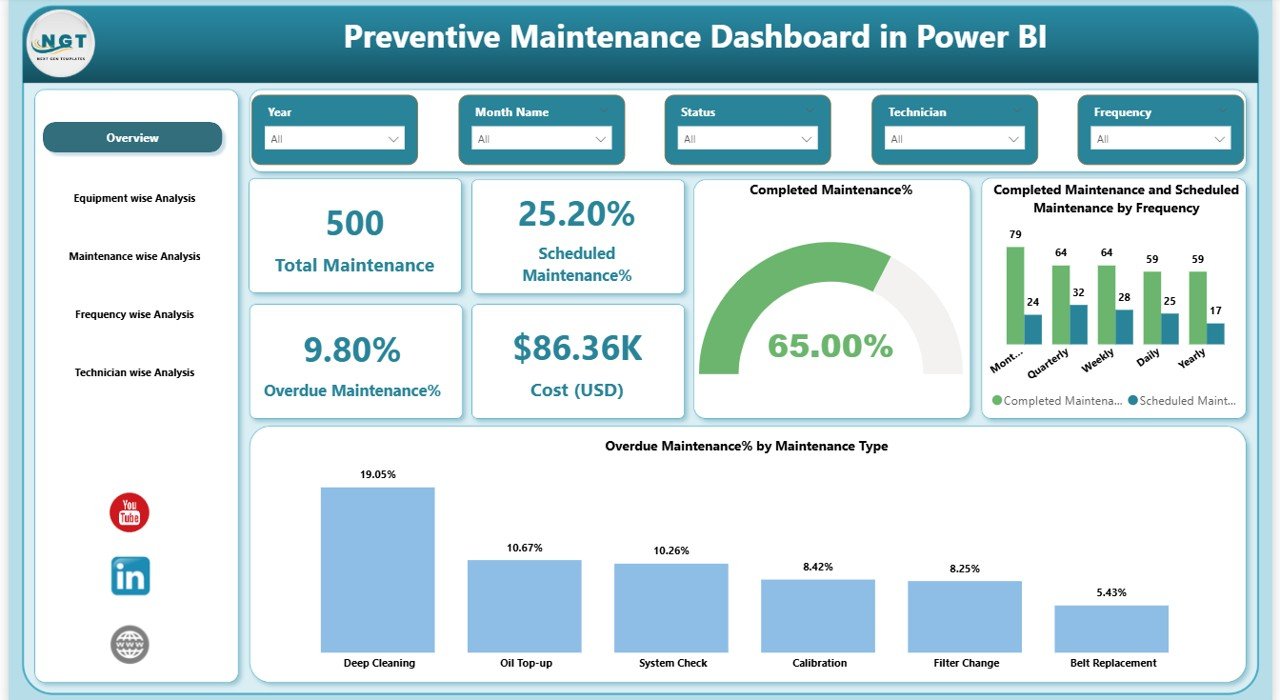
1️⃣ Overview Page – The Central Control Panel
Get instant visibility with KPI cards including:
-
Total Maintenance
-
Scheduled Maintenance %
-
Completed Maintenance %
-
Overdue Maintenance %
-
Maintenance Cost (USD)
Visual charts display performance by frequency and maintenance type. Slicers allow filtering by date, equipment, technician, or type.
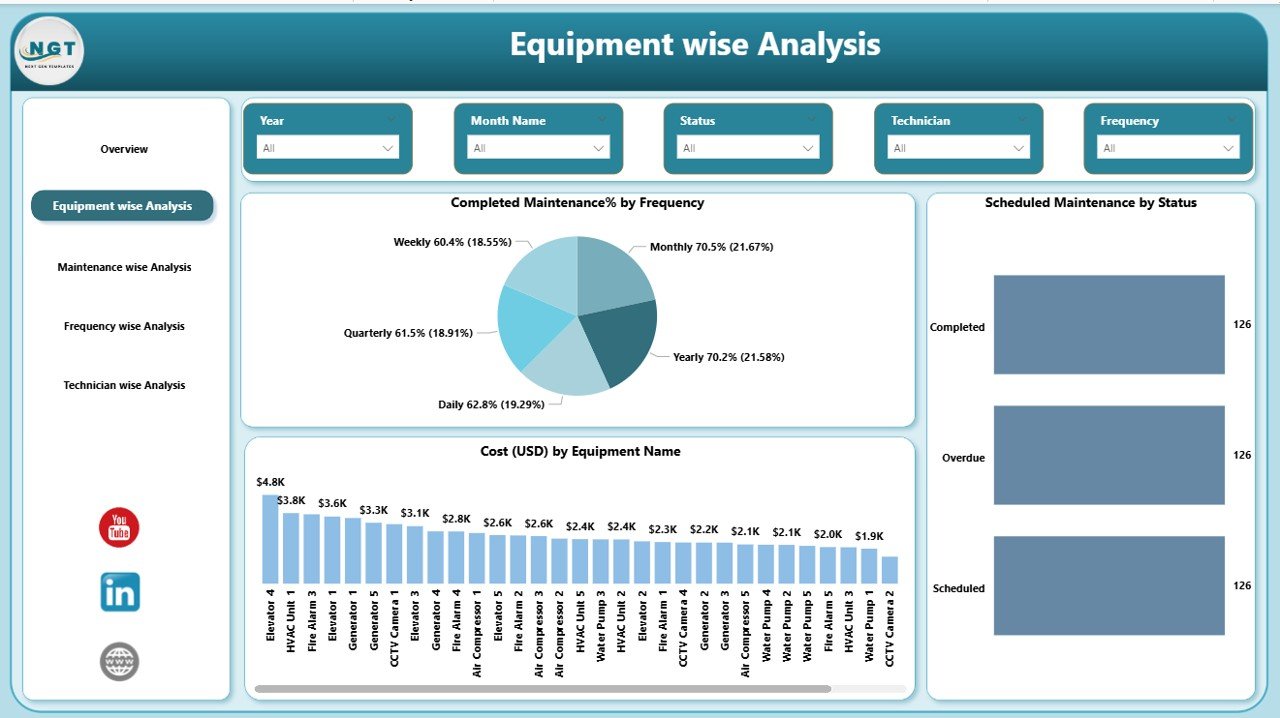
2️⃣ Equipment Wise Analysis
Monitor equipment-level performance:
-
Cost (USD) by Equipment
-
Scheduled Maintenance by Status
-
Completed Maintenance % by Frequency
Identify high-cost assets and equipment with frequent overdue tasks.
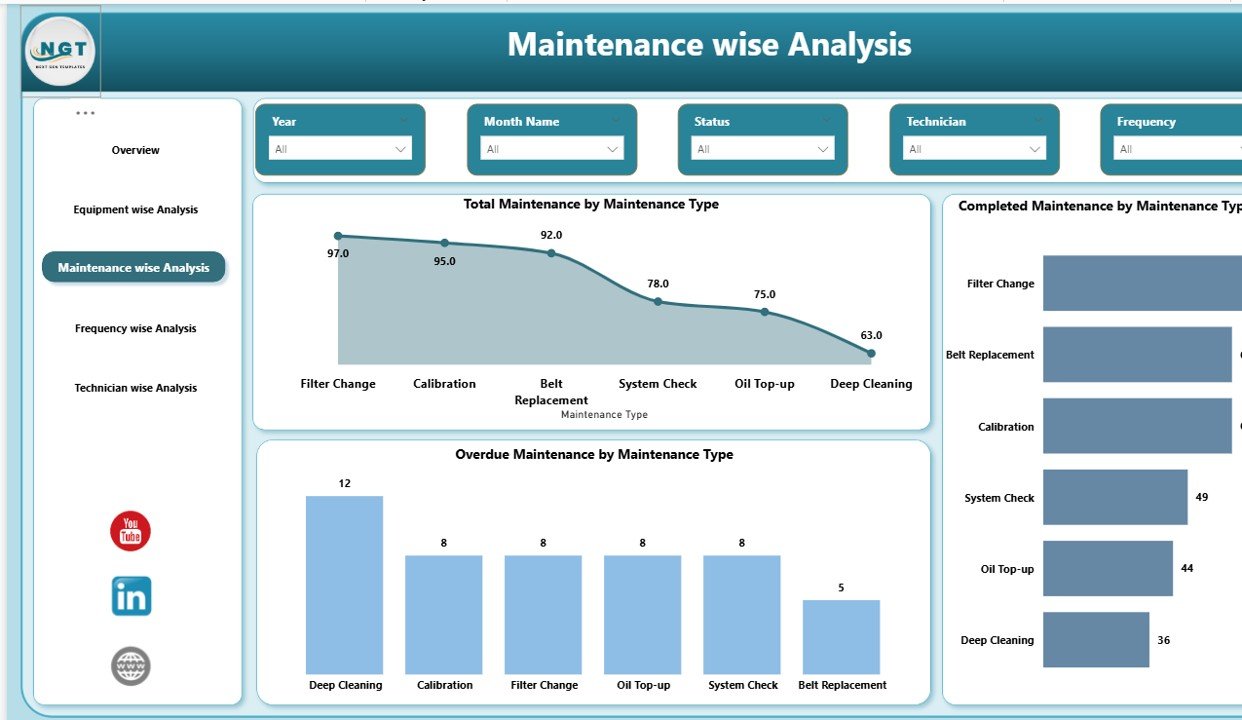
3️⃣ Maintenance Wise Analysis
Analyze different maintenance categories such as Electrical, Mechanical, Inspection, or Calibration:
-
Total Maintenance by Type
-
Completed Maintenance by Type
-
Overdue Maintenance by Type
Improve preventive strategies and allocate resources effectively.
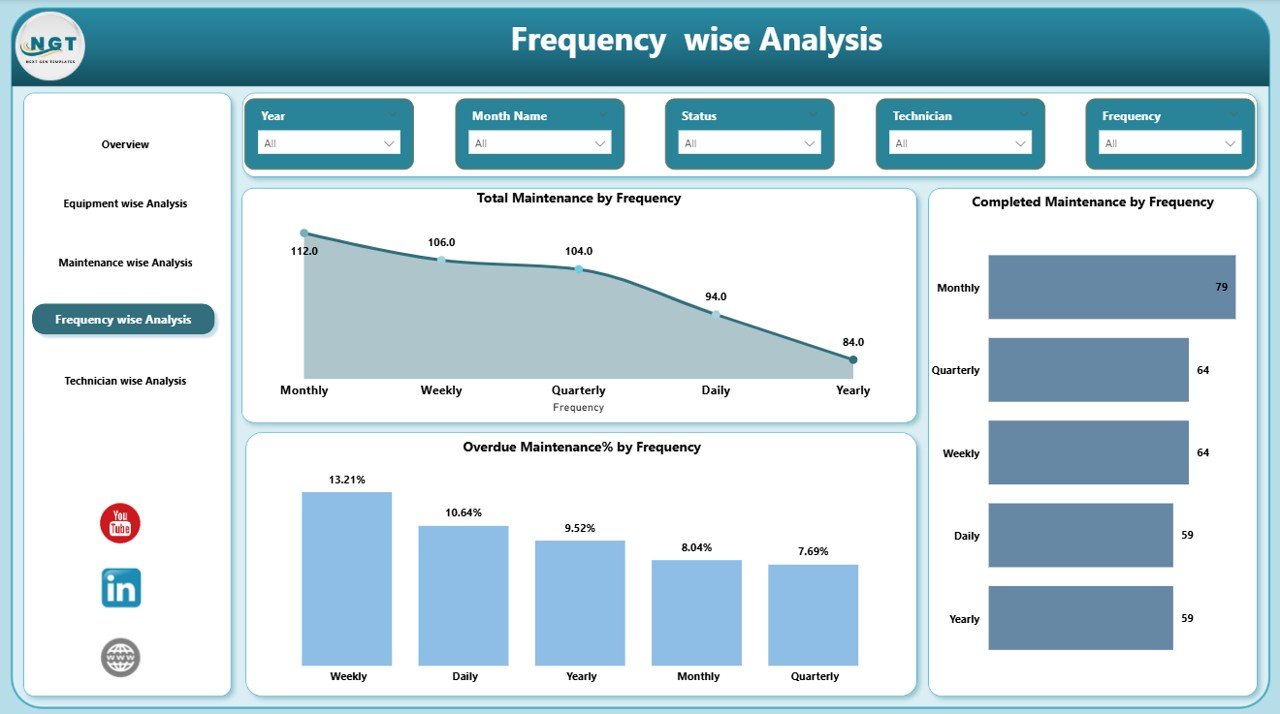
4️⃣ Frequency Wise Analysis
Evaluate performance across Daily, Weekly, Monthly, Quarterly, and Yearly schedules:
-
Total Maintenance by Frequency
-
Completed Maintenance by Frequency
-
Overdue % by Frequency
Optimize maintenance intervals and reduce scheduling gaps.
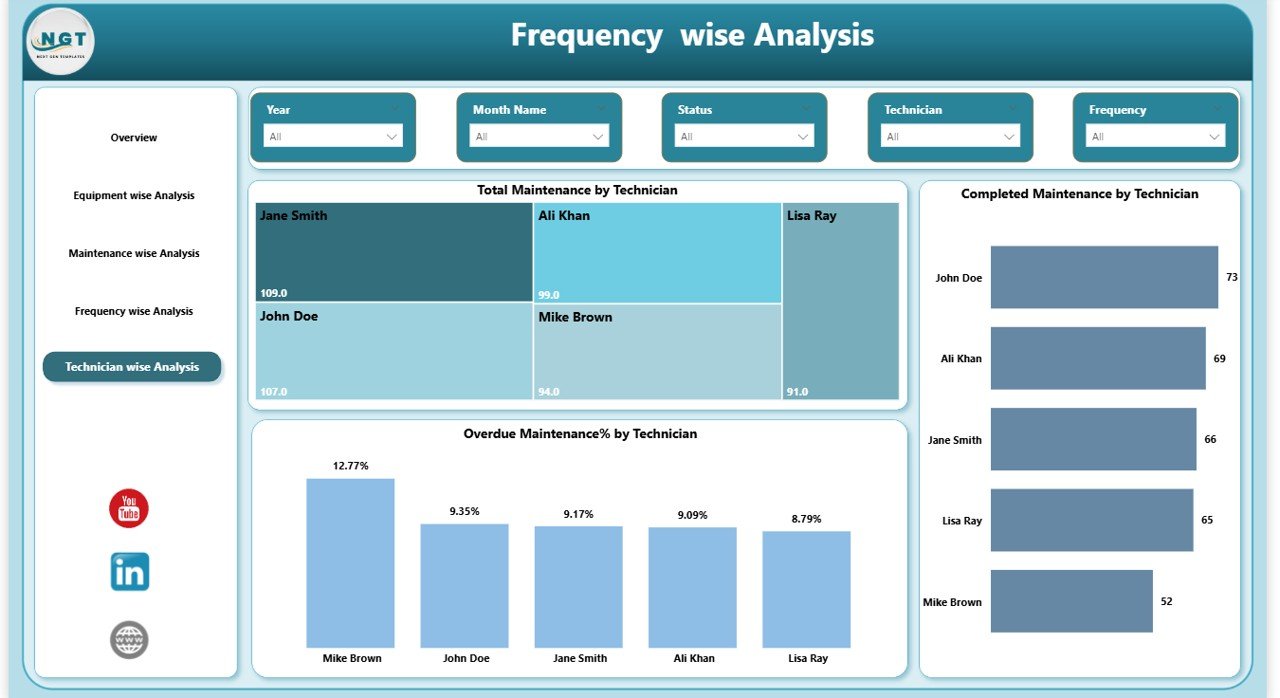
5️⃣ Technician Wise Analysis
Track workforce productivity:
-
Total Maintenance by Technician
-
Completed Maintenance by Technician
-
Overdue % by Technician
Improve accountability and balance workload distribution.
⚙️ How to Use the Preventive Maintenance Dashboard
Using this dashboard is simple and efficient:
1️⃣ Import your maintenance data (Excel or ERP)
2️⃣ Ensure required columns: Equipment, Type, Frequency, Status, Technician, Cost, Date
3️⃣ Refresh Power BI
4️⃣ Use slicers to filter data dynamically
5️⃣ Monitor KPIs and take action
Within minutes, you gain actionable insights that improve maintenance efficiency.
🎯 Who Can Benefit from This Preventive Maintenance Dashboard
This dashboard is ideal for:
-
Manufacturing Companies
-
Facility Management Teams
-
Hospitals & Healthcare Facilities
-
Hotels & Hospitality Businesses
-
Construction Firms
-
Logistics & Warehousing Companies
-
Oil & Gas Operations
-
Any Organization Managing Equipment Assets
If your business depends on equipment performance, this dashboard is essential.
By implementing this dashboard, you can:
✔ Reduce equipment downtime
✔ Improve asset reliability
✔ Control maintenance budgets
✔ Increase technician productivity
✔ Reduce operational risks
✔ Make data-driven maintenance decisions
Stop reacting to breakdowns. Start preventing them.
This Preventive Maintenance Dashboard in Power BI gives you clarity, control, and confidence in your maintenance operations.
Click here to read the Detailed blog post
Watch the step-by-step video tutorial: