Managing a Hotel Chains KPI Dashboard is complex. You need to monitor occupancy, revenue, guest satisfaction, staff productivity, and operating costs—often across multiple properties and departments. However, when performance data is spread across Excel files or static reports, leaders struggle to see the complete picture. As a result, decision-making slows down and growth opportunities are missed.
That is exactly where the Hotel Chains KPI Dashboard in Power BI becomes a game-changer. 🚀
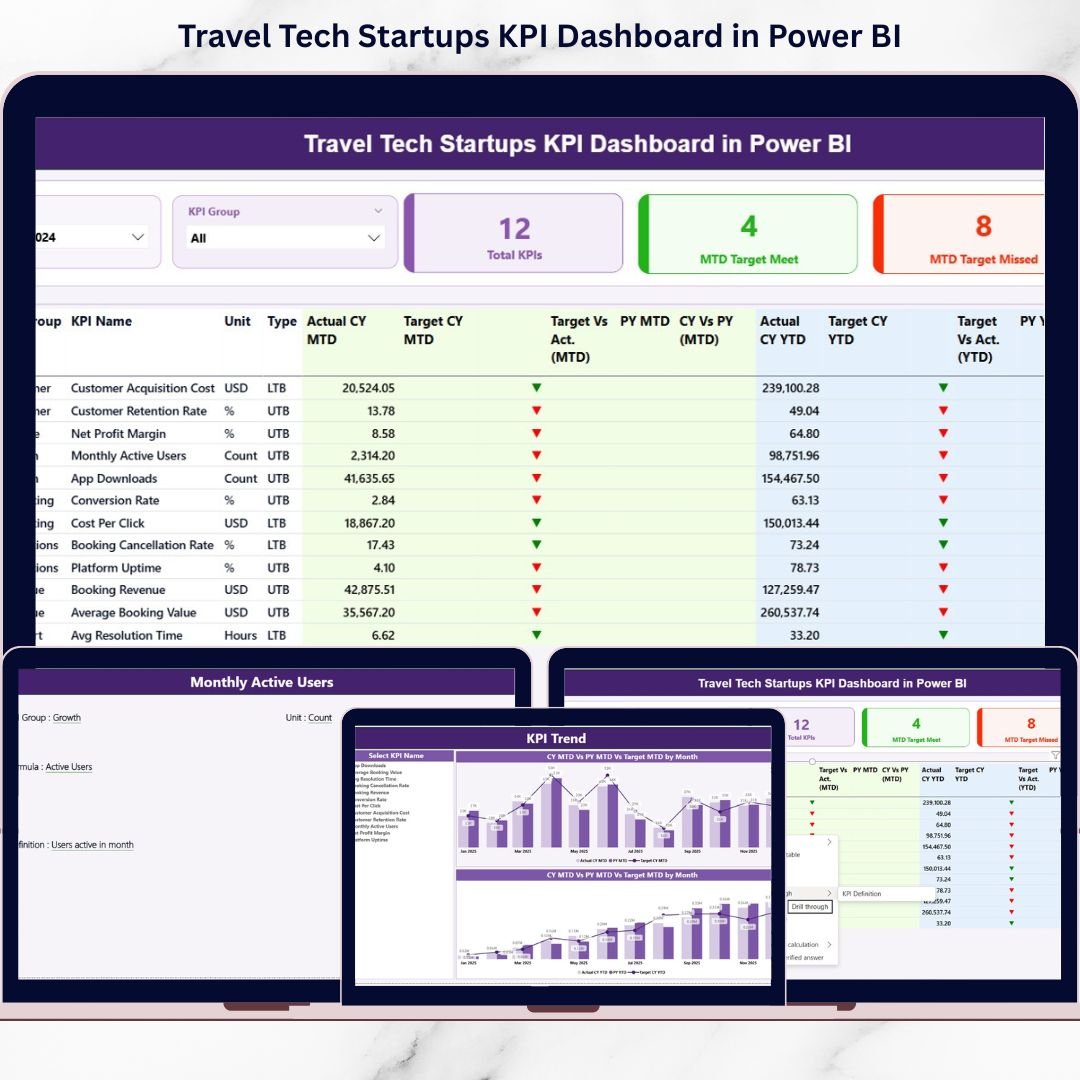
This ready-to-use Power BI dashboard is designed specifically for hotel chains that want clear, interactive, and actionable insights—without manual reporting or complicated systems.
By transforming Excel-based data into powerful visuals, this dashboard helps hotel leaders track KPIs, compare performance, and take faster, data-driven decisions with confidence.
🔑 Key Features of Hotel Chains KPI Dashboard in Power BI
📊 Interactive KPI Monitoring
Track all critical hotel KPIs in one centralized Power BI dashboard with slicers and dynamic visuals.
🎯 Actual vs Target vs Previous Year Analysis
Instantly compare performance against targets and last year’s results to identify gaps and improvements.
📆 MTD & YTD Performance Tracking
Analyze both Month-to-Date and Year-to-Date metrics to balance short-term actions and long-term strategy.
🚦 Target Met & Missed Indicators
Visual icons and color indicators clearly show whether KPIs are meeting or missing targets.
📈 Trend Analysis with Charts
Understand performance movement over time using MTD and YTD trend charts.
🔄 Excel-Based Data Source
Simply update Excel input files—Power BI automatically refreshes all calculations and visuals.
📦 What’s Inside the Hotel Chains KPI Dashboard in Power BI
This Power BI solution includes three powerful pages, each designed for clarity and ease of use:
📌 Summary Page
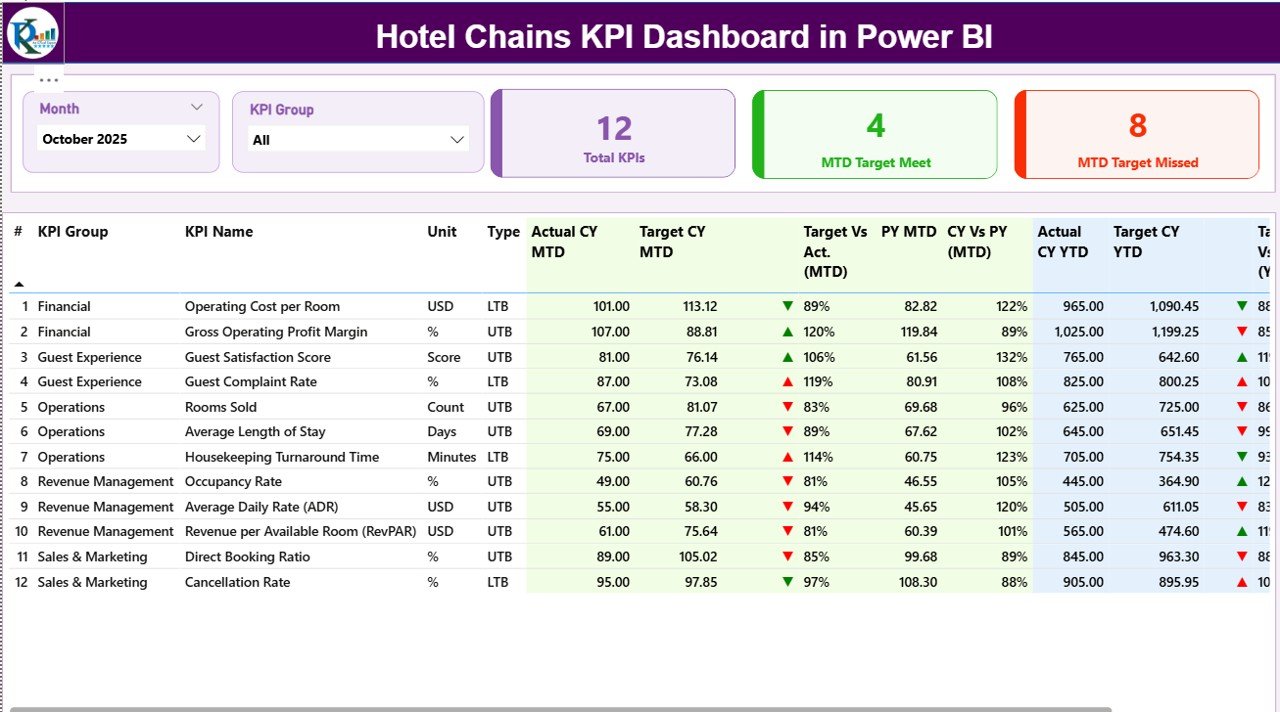
The control center of the dashboard, showing:
-
Month slicer for instant period selection
-
KPI Group slicer for category-wise analysis
-
KPI cards for Total KPIs, Target Met, and Target Missed
-
A detailed KPI table with MTD and YTD comparisons, icons, and percentages
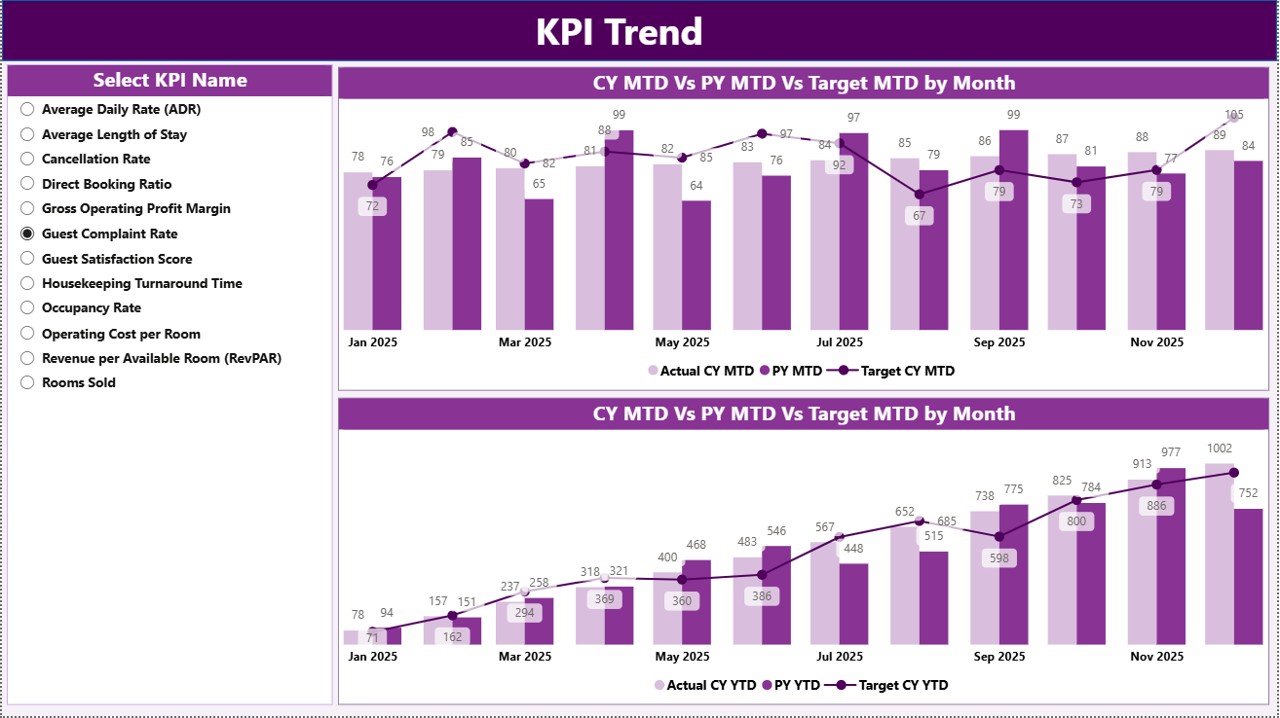
📉 KPI Trend Page
Focused on performance trends:
-
MTD trend chart (Actual, Target, Previous Year)
-
YTD trend chart (Actual, Target, Previous Year)
-
KPI slicer to analyze individual metrics
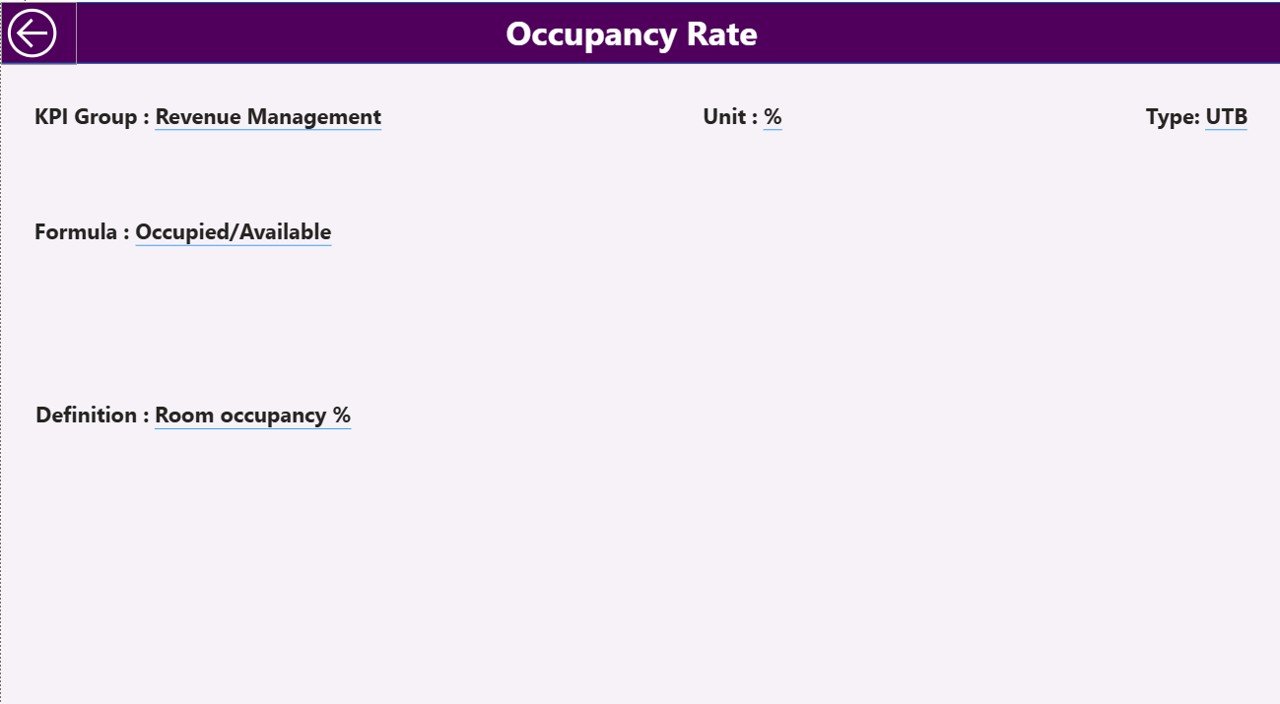
📘 KPI Definition Page
A drill-through page that displays:
-
KPI formula
-
KPI definition
-
KPI type (LTB or UTB)
This ensures consistency and avoids KPI misinterpretation across teams.
🛠️ How to Use the Hotel Chains KPI Dashboard in Power BI
Using the dashboard is simple and business-friendly:
1️⃣ Update KPI data in the Excel Input_Actual sheet
2️⃣ Enter target values in the Input_Target sheet
3️⃣ Maintain KPI structure in the KPI Definition sheet
4️⃣ Refresh the Power BI file
5️⃣ Use slicers to analyze KPIs by month and group
6️⃣ Review icons, trends, and comparisons for insights
Within minutes, your raw data turns into executive-ready analytics.
👥 Who Can Benefit from This Hotel Chains KPI Dashboard in Power BI
🏨 Hotel Chain Owners & Executives
📊 General Managers & Operations Heads
💰 Revenue & Finance Teams
🧠 Strategy & Corporate Planning Teams
🏢 Multi-Property Hotel Groups
📈 Hospitality Consultants
Whether you manage a single brand or a large hotel group, this dashboard provides clarity, speed, and control.


