Running a catering business is not just about cooking great food. It is about meeting tight timelines, controlling food and labor costs, managing fluctuating orders, and delivering consistent service quality—all at the same time. When performance data is scattered across multiple spreadsheets, important issues stay hidden. That is why the Catering Services KPI Dashboard in Excel becomes an essential business tool.
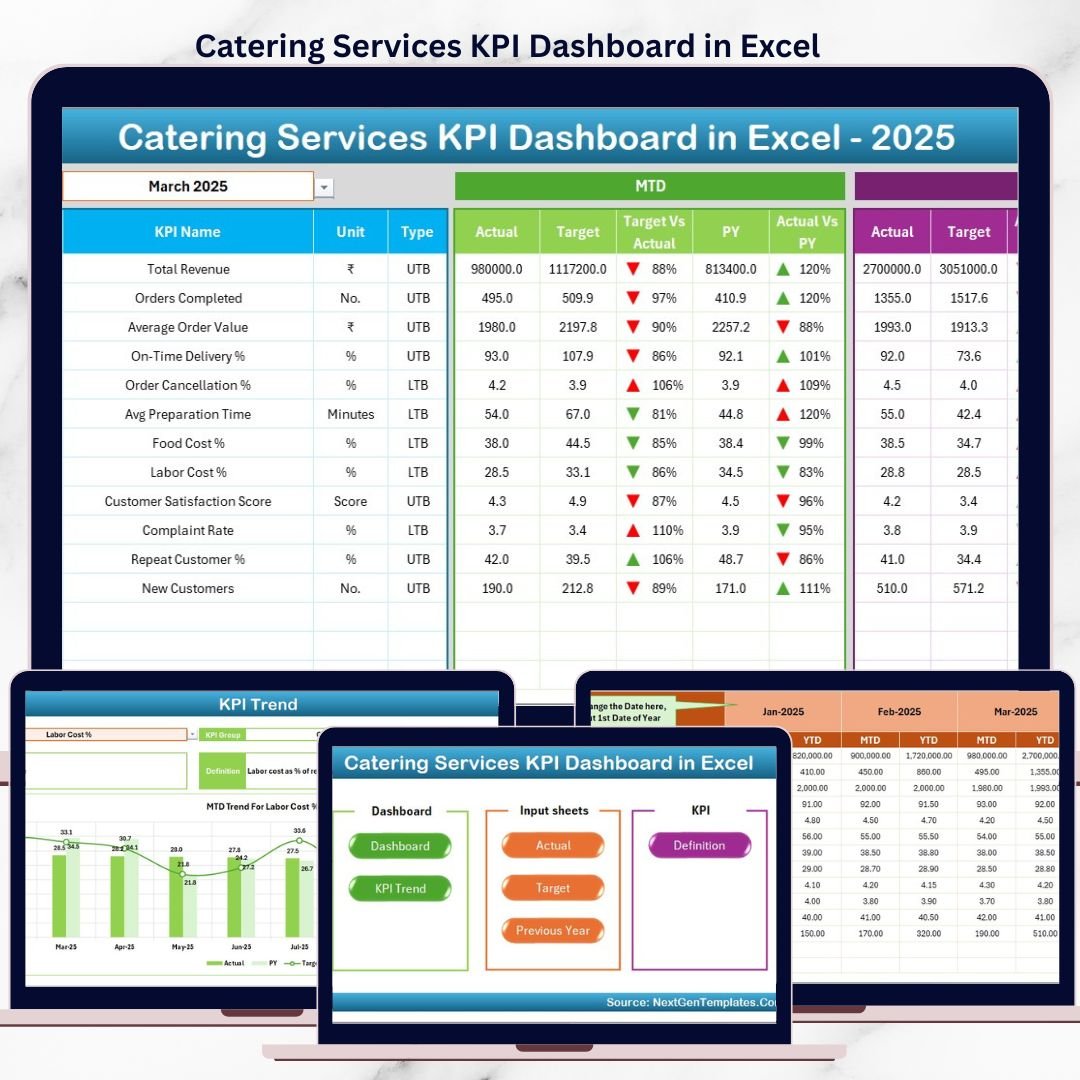
This ready-to-use Excel dashboard gives catering owners and managers complete visibility into operational, financial, and service performance. Instead of manually compiling reports, you get automated KPIs, visual indicators, and trend analysis in one structured dashboard. As a result, you make faster decisions, reduce waste, and improve profitability without changing your existing Excel workflow.
Designed for simplicity and clarity, this dashboard works perfectly for event catering companies, food service providers, corporate caterers, and restaurant groups.
🚀 Key Features of Catering Services KPI Dashboard in Excel
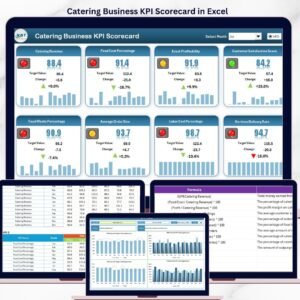
📊 All Catering KPIs in One Place
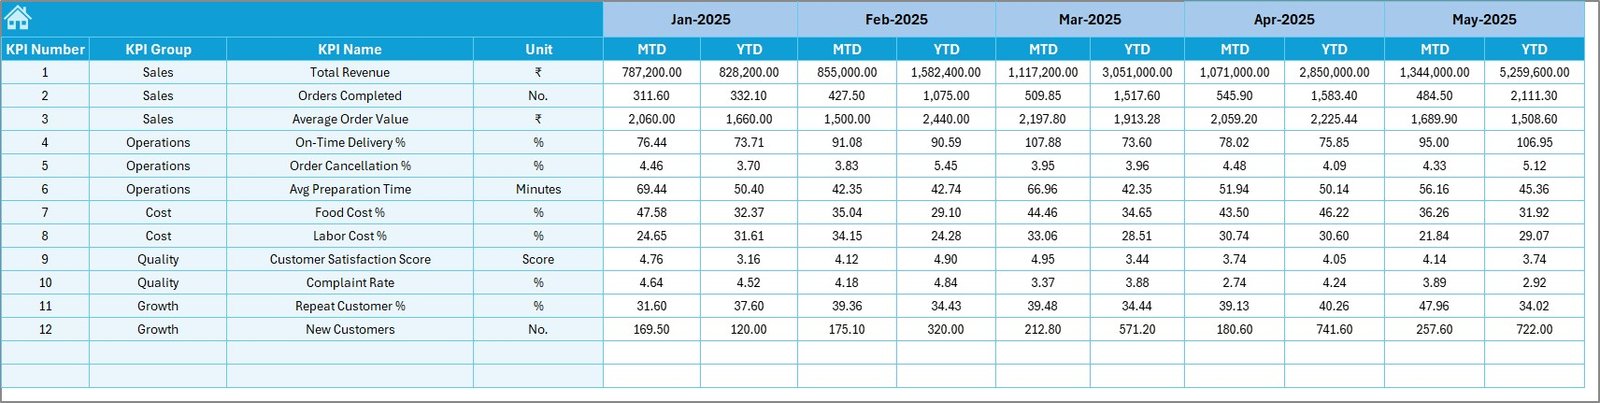
Track revenue, orders, food cost, labor cost, wastage, delivery performance, and customer satisfaction from a single dashboard.
📅 MTD & YTD Performance Tracking
Monitor Month-to-Date and Year-to-Date performance to understand short-term results and long-term trends.
🎯 Actual vs Target Comparison
Instantly compare actual results with targets to identify gaps and improvement areas.
📉 Previous Year Benchmarking
Analyze year-over-year performance using built-in historical comparison.
⬆️⬇️ Visual Performance Indicators
Conditional formatting arrows highlight improving and declining KPIs at a glance.
🧭 Easy Navigation with Home Page
Jump to any worksheet using one-click navigation buttons.
📈 Detailed KPI Trend Analysis
Analyze individual KPIs deeply using monthly and cumulative trend charts.
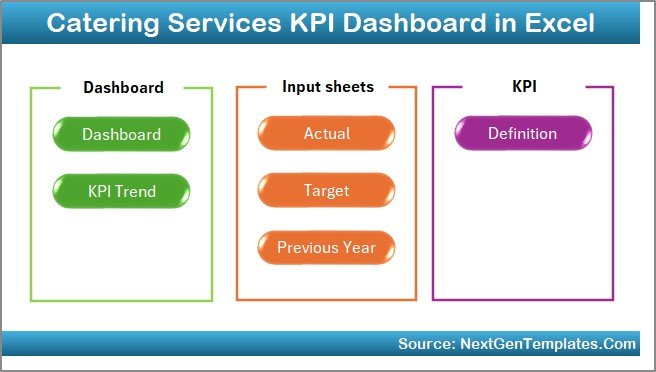
📂 What’s Inside the Catering Services KPI Dashboard in Excel
This professionally structured Excel file includes 7 interconnected worksheets:
🏠 Home Sheet
• Central navigation hub
• Six interactive buttons for easy sheet access
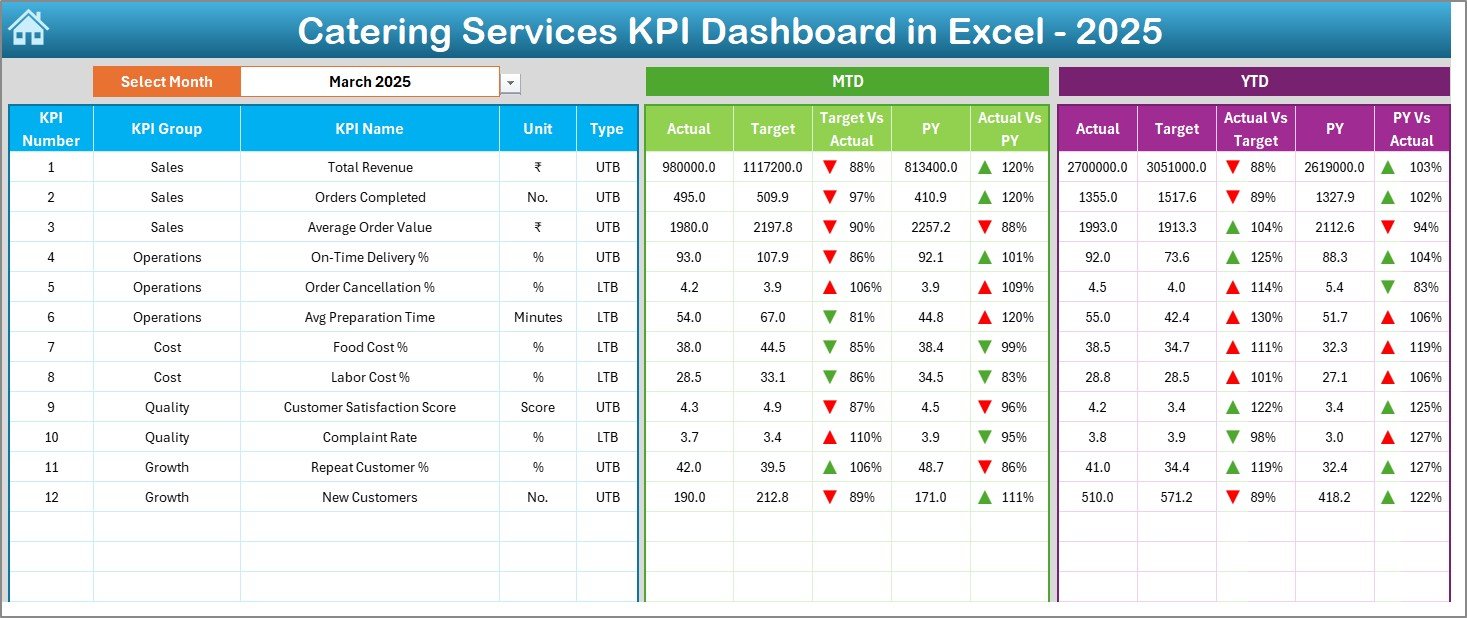
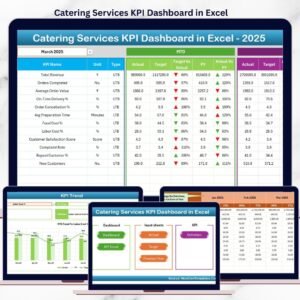
📊 Dashboard Sheet
• Month selector (Cell D3)
• MTD Actual vs Target
• MTD Actual vs Previous Year
• YTD Actual vs Target
• YTD Actual vs Previous Year
• Conditional formatting arrows for quick insights
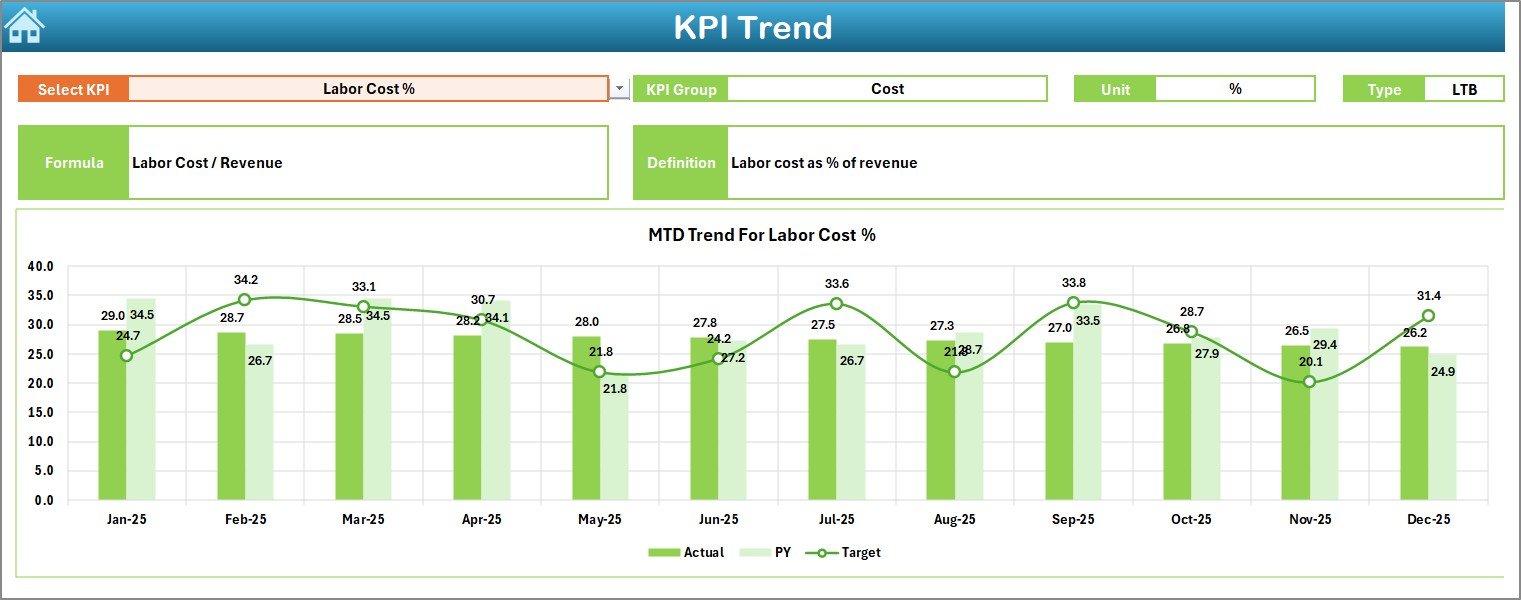
📈 KPI Trend Sheet
• KPI selector (Cell C3)
• KPI group, unit, type, formula, and definition
• Actual vs Target trends
• Actual vs Previous Year trends
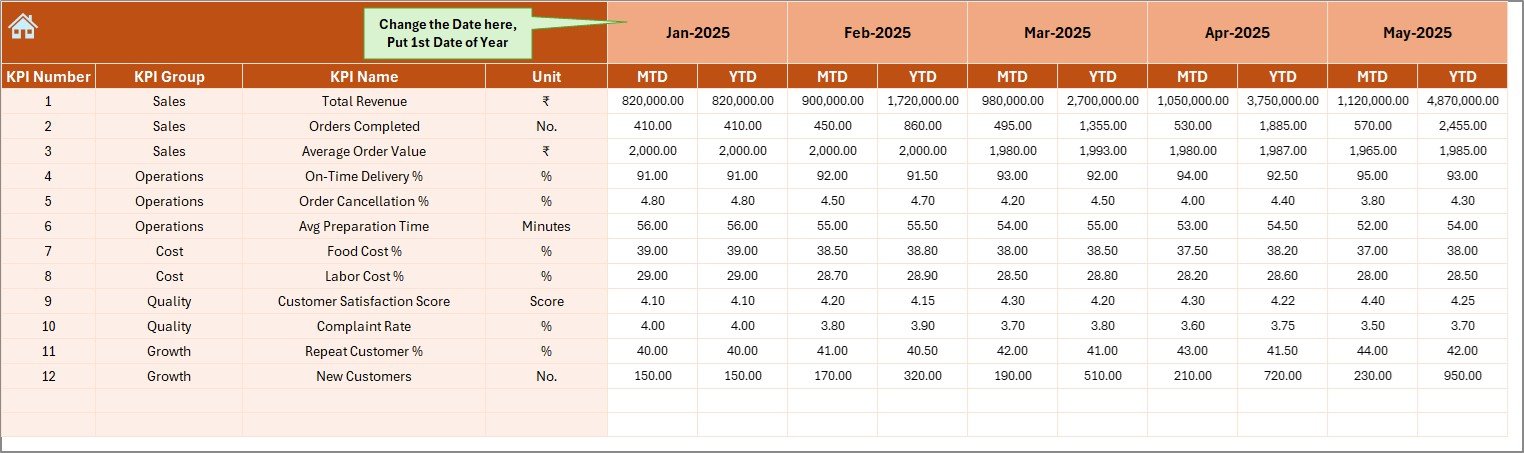
📝 Actual Numbers Input Sheet
• Clean data entry for MTD & YTD actuals
• Month selection (Cell E1)
• Automatic dashboard updates
🎯 Target Sheet
• Monthly and YTD KPI targets
• Clear performance benchmarks
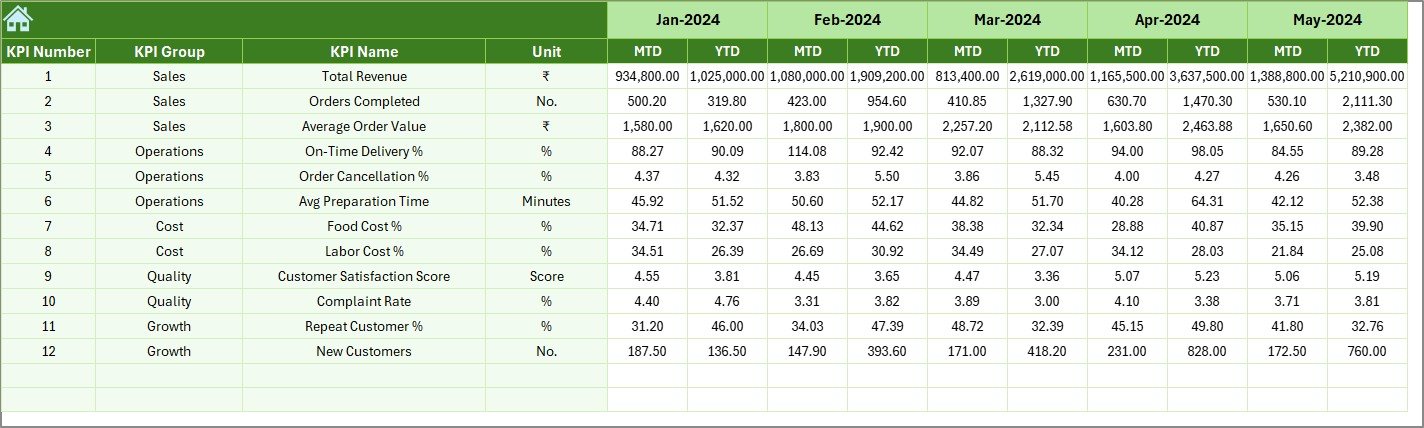
📅 Previous Year Number Sheet
• Historical performance data
• Year-over-year comparison support
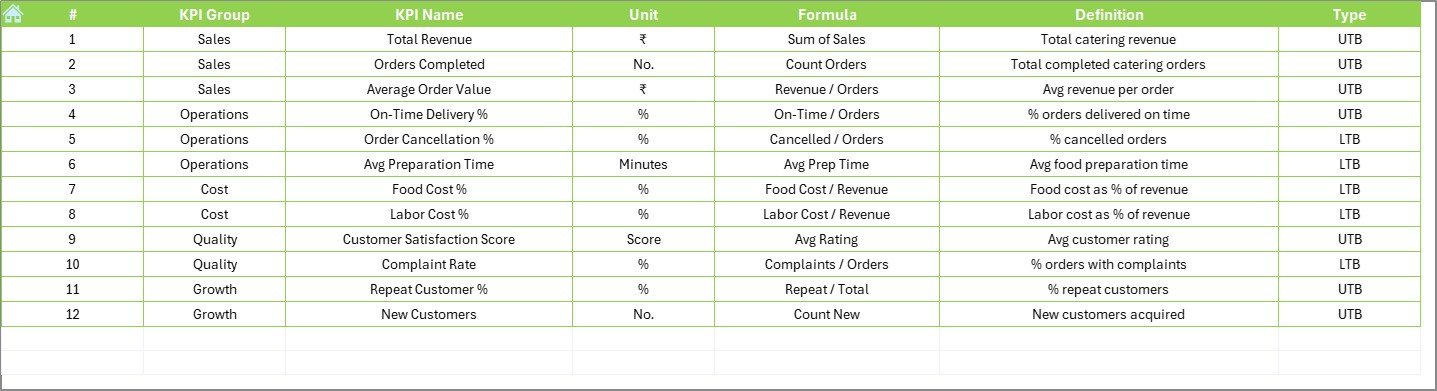
📘 KPI Definition Sheet
• KPI name, group, unit
• Formula and definition clarity
• Consistent KPI understanding across teams
🛠️ How to Use the Catering Services KPI Dashboard in Excel
1️⃣ Enter actual catering data in the Actual Numbers Input Sheet
2️⃣ Define targets in the Target Sheet
3️⃣ Add last year’s data in the Previous Year Sheet
4️⃣ Select the month from the Dashboard
5️⃣ Review KPI cards, arrows, and trends
6️⃣ Take action based on insights
No advanced Excel skills required. If you know basic Excel, you can use this dashboard confidently.
👥 Who Can Benefit from This Catering Services KPI Dashboard
🍽️ Catering Business Owners
📋 Operations Managers
🎉 Event Managers
💰 Finance & Cost Control Teams
🏢 Corporate Food Service Providers
🍴 Restaurant Groups Offering Catering
This dashboard scales easily from small catering firms to large food service operations.
🔗 Click here to read the Detailed blog post
▶️ Visit our YouTube channel to learn step-by-step video tutorials
👉
Visit our YouTube channel to learn step-by-step video tutorials


Reviews
There are no reviews yet.