Vocational training institutes operate in a results-driven environment where attendance, assessments, trainer performance, revenue, and learner outcomes must be tracked continuously. However, many institutes still depend on scattered Excel sheets, manual reports, and disconnected systems. As a result, leadership struggles to get real-time visibility, and critical decisions get delayed.
That is exactly where the Vocational Training Dashboard in Power BI becomes a game-changing analytics solution 🚀.
This ready-to-use Power BI dashboard transforms raw vocational training data into clear, interactive, and actionable insights. Instead of spending hours compiling reports, administrators and managers can instantly monitor training progress, attendance levels, assessment scores, trainer performance, course demand, and monthly revenue trends—all from one centralized dashboard.
Built for training institutes, skill development centers, NGOs, and corporate L&D teams, this dashboard helps organizations improve training quality, optimize operations, and scale confidently using data-driven decisions.
🔑 Key Features of Vocational Training Dashboard in Power BI
📊 Centralized Training Performance Monitoring
🏫 Training Center-Wise Performance Analysis
📚 Course Category & Trainer Effectiveness Tracking
🧑🏫 Attendance & Assessment Score Insights
💰 Fee & Revenue Trend Analysis
📈 Month-Wise Performance Tracking
🎯 Interactive Slicers & Drill-Down Capability
⚡ Real-Time, Decision-Ready Insights
This dashboard eliminates guesswork and replaces it with clear performance intelligence.
📂 What’s Inside the Vocational Training Dashboard in Power BI
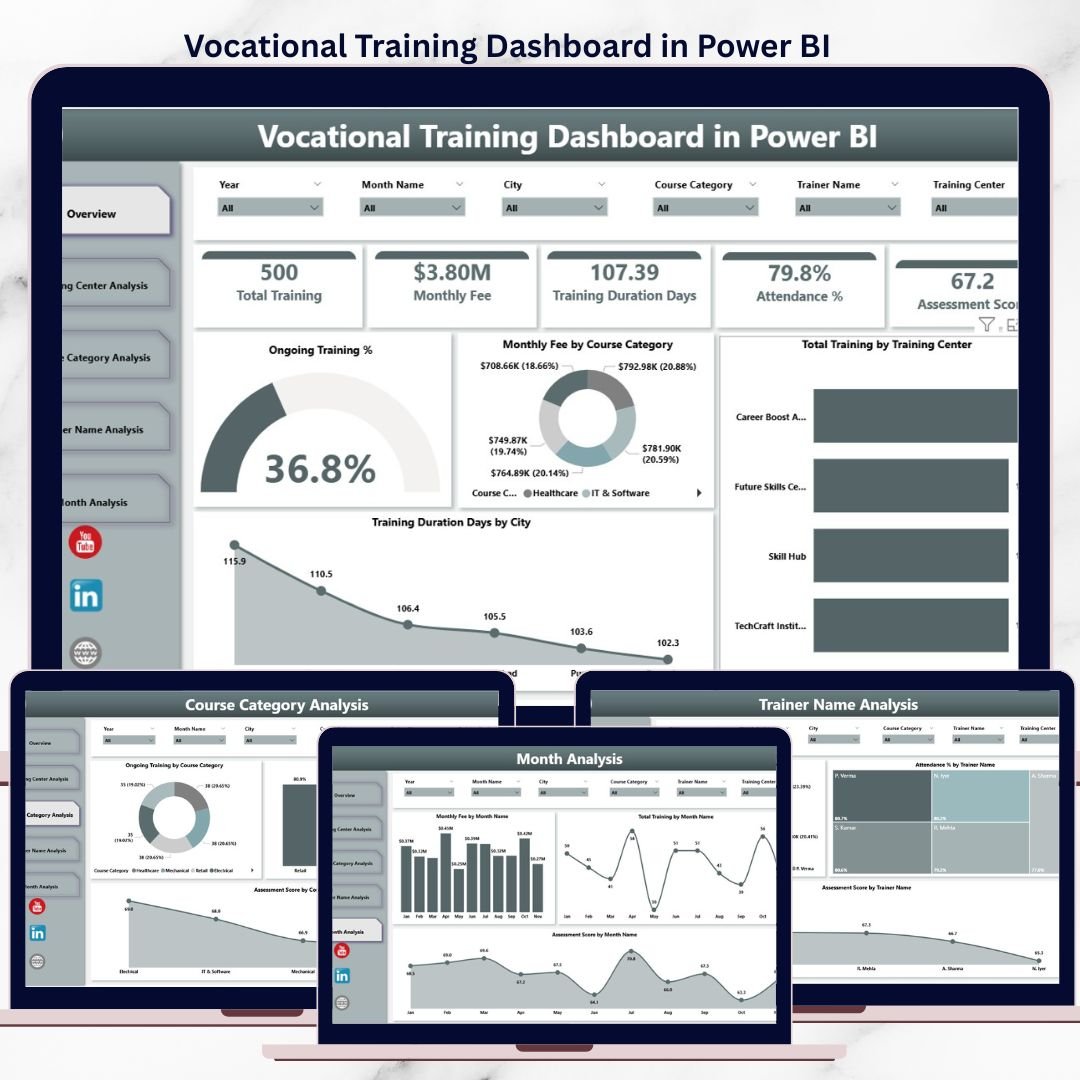
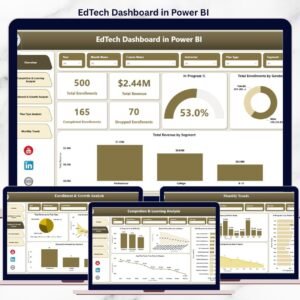
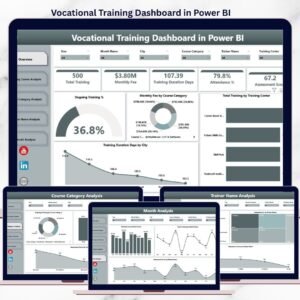
📊 Overview Page – Training Performance Snapshot
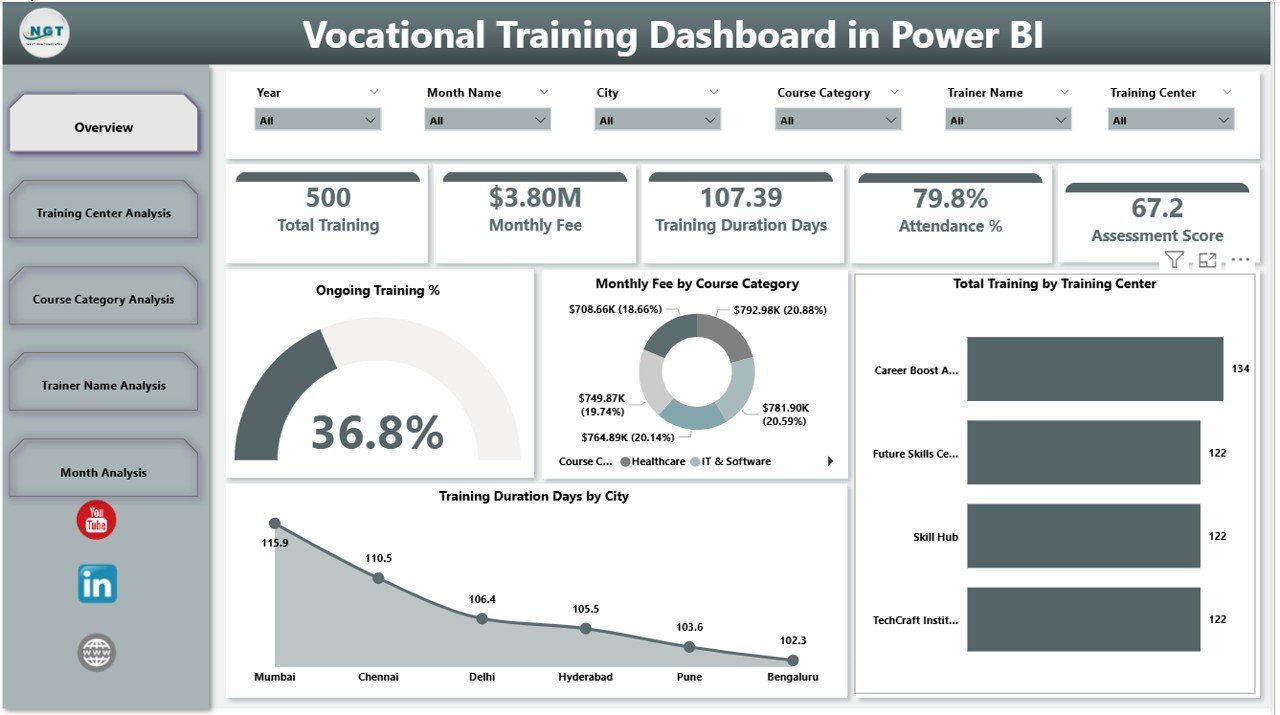
Vocational Training Dashboard
The Overview Page acts as the command center for leadership and management teams.
Key Insights Available:
-
Ongoing Training % – Track active training programs instantly
-
Monthly Fee by Course Category – Identify high-revenue programs
-
Total Training by Training Center – Compare center workload and output
-
Training Duration Days by City – Analyze regional training patterns
With interactive slicers, users filter data instantly by center, course, trainer, city, or month.
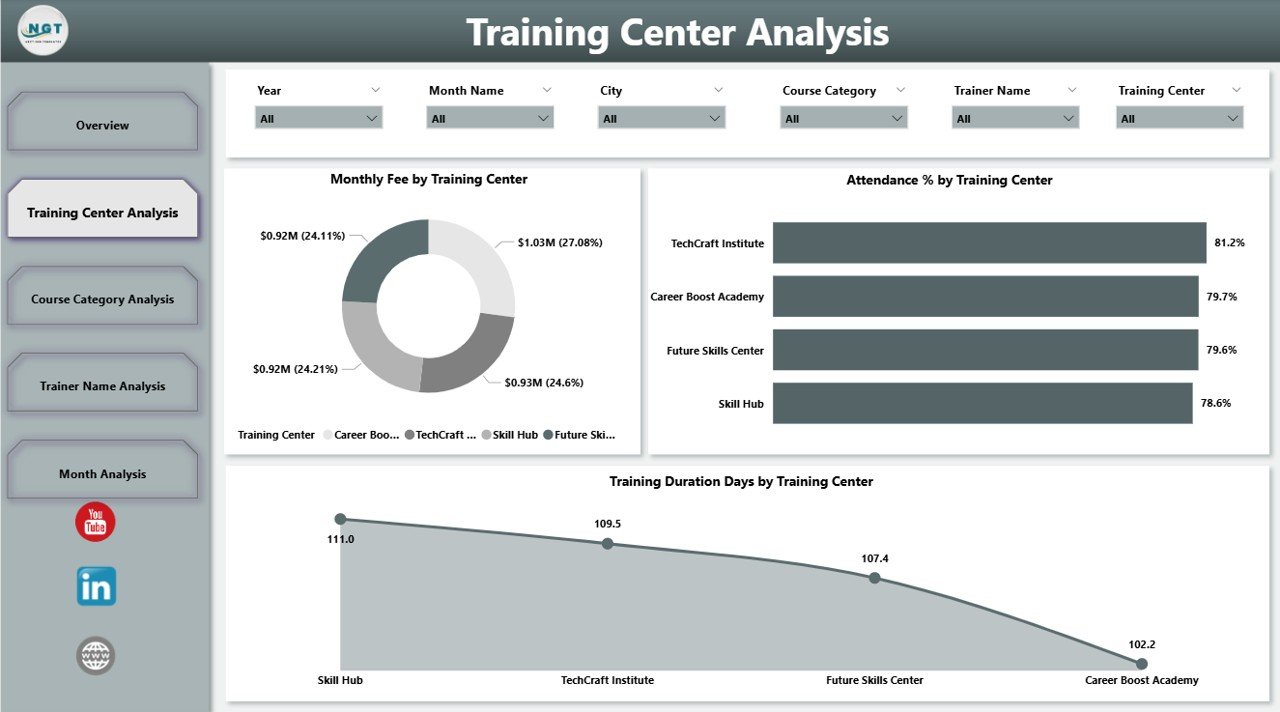
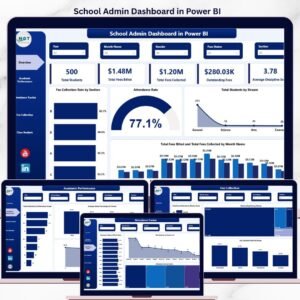
🏫 Training Center Analysis – Center-Wise Performance
This page focuses on operational efficiency across training centers.
Key Visuals:
-
Monthly Fee by Training Center
-
Attendance % by Training Center
-
Training Duration Days by Training Center
👉 Helps management balance resources, improve attendance, and optimize center operations.
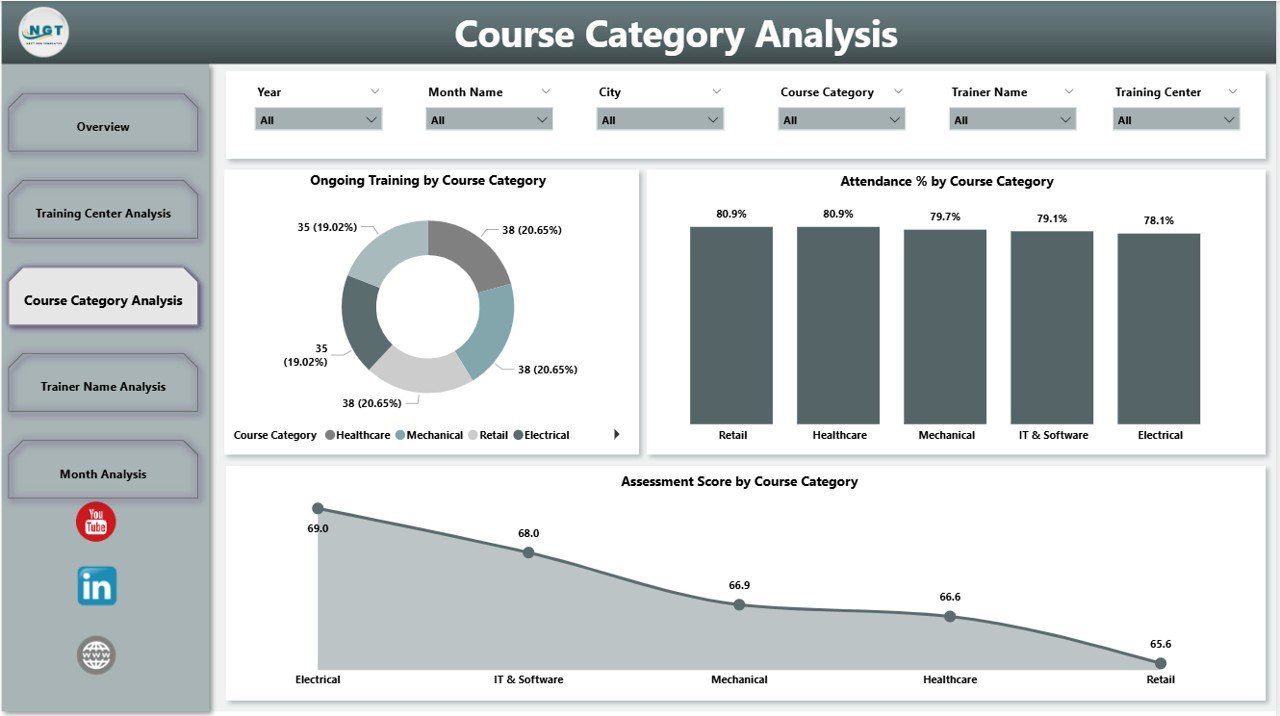
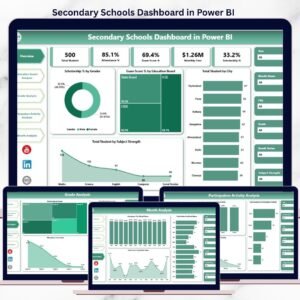
📚 Course Category Analysis – Program Effectiveness
Different courses deliver different outcomes. This page highlights those differences clearly.
Key Metrics:
-
Ongoing Training % by Course Category
-
Attendance % by Course Category
-
Assessment Score by Course Category
👉 Supports curriculum improvement, demand planning, and course optimization.
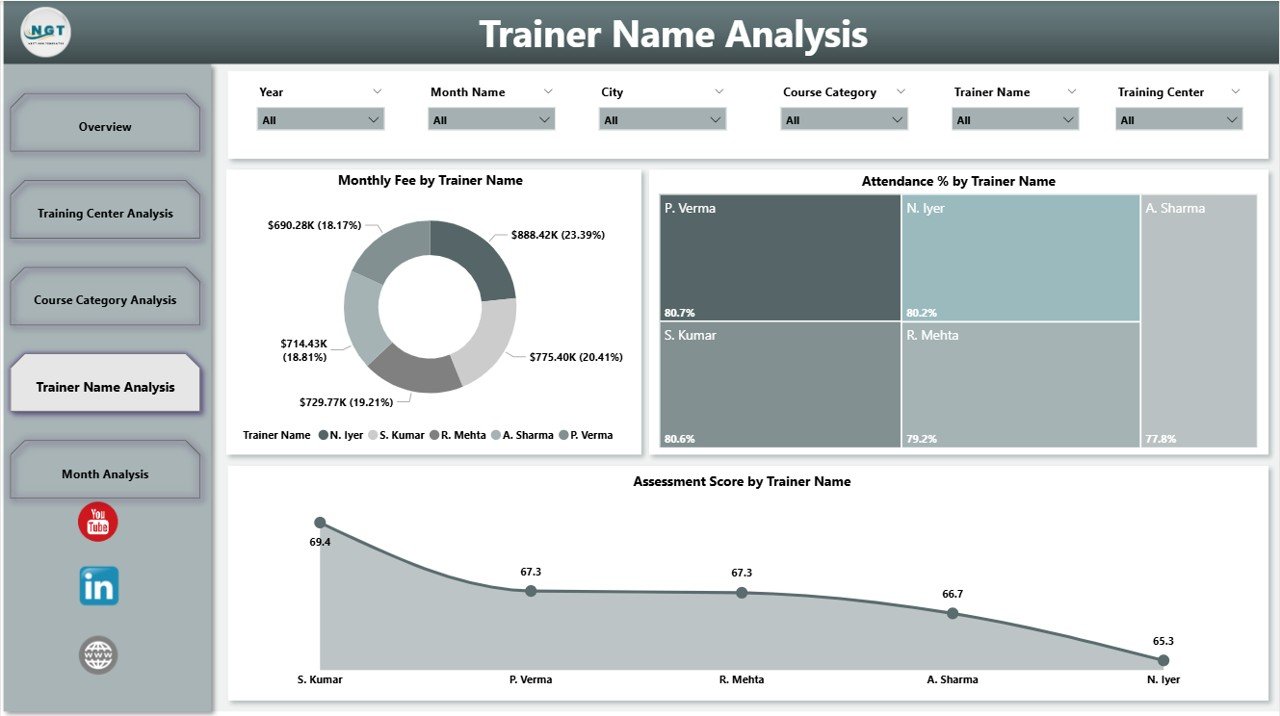
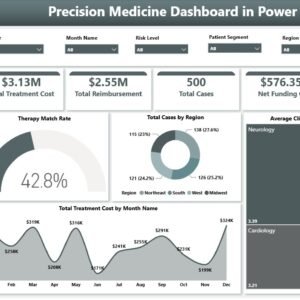
🧑🏫 Trainer Name Analysis – Trainer Performance Insights
Trainer quality directly impacts learner success.
Key Insights:
-
Monthly Fee by Trainer Name
-
Attendance % by Trainer Name
-
Assessment Score by Trainer Name
👉 Enables trainer recognition, performance improvement, and targeted coaching.
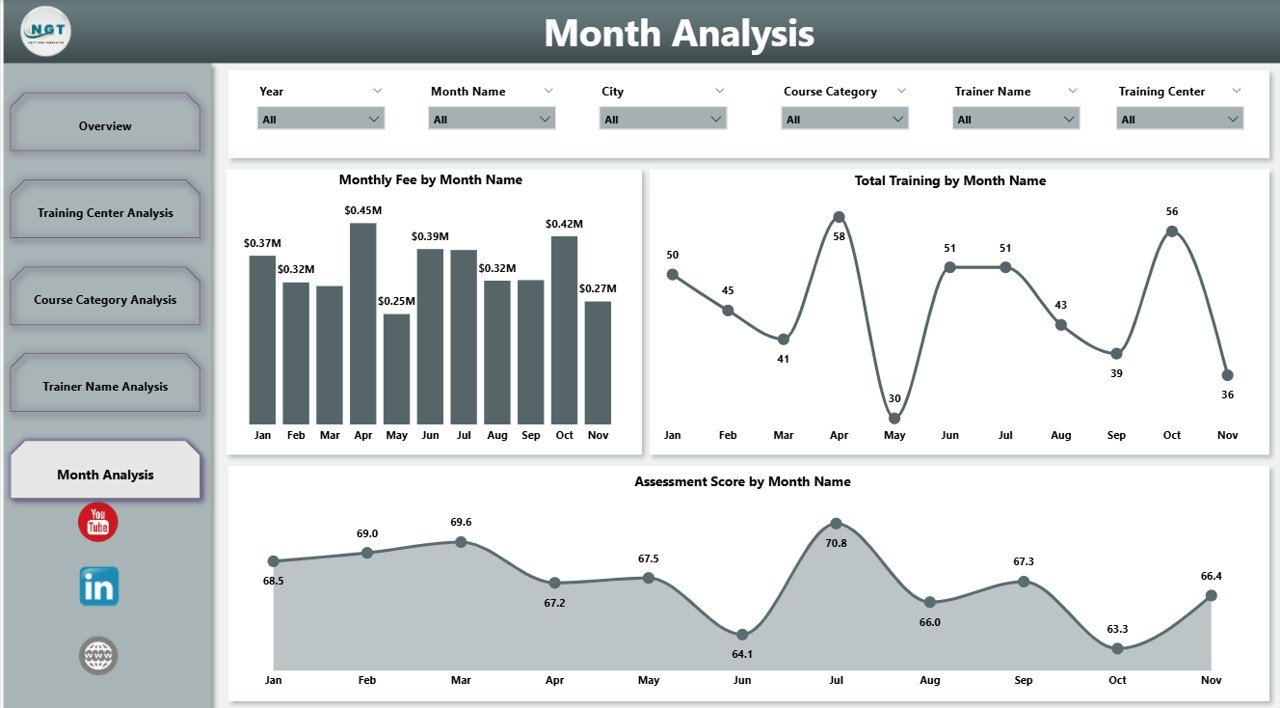
📆 Month Analysis – Trend & Growth Tracking
Time-based analysis supports long-term planning.
Key Trends:
-
Monthly Fee by Month
-
Attendance % by Month
-
Total Training by Month
👉 Helps institutes forecast demand, plan capacity, and improve financial stability.
⚙️ How to Use the Vocational Training Dashboard in Power BI
1️⃣ Connect training data from Excel or databases
2️⃣ Refresh data in Power BI
3️⃣ Use slicers to filter by center, course, trainer, or month
4️⃣ Analyze trends, gaps, and performance instantly
5️⃣ Take faster, smarter decisions
No advanced technical skills required.
🎯 Who Can Benefit from This Dashboard?
🏫 Vocational Training Institutes
🎓 Skill Development Centers
🏢 Corporate L&D Teams
🤝 NGOs & Government Training Programs
📊 Training Managers & Administrators
📈 Leadership & Decision-Makers
Perfect for single-center and multi-center training organizations.
### 👉 Click here to read the Detailed blog post
▶️ Visit our YouTube channel to learn step-by-step video tutorials
https://youtube.com/@PKAnExcelExpert


Reviews
There are no reviews yet.