Veterinary Services Dashboard clinic today goes far beyond medical care. Clinics must continuously monitor appointments, medication usage, service costs, billing performance, and customer satisfaction. However, when this information remains scattered across Excel files or billing systems, insights stay hidden and decisions slow down.
That is exactly where the Veterinary Services Dashboard in Power BI becomes an essential growth tool 🚀.
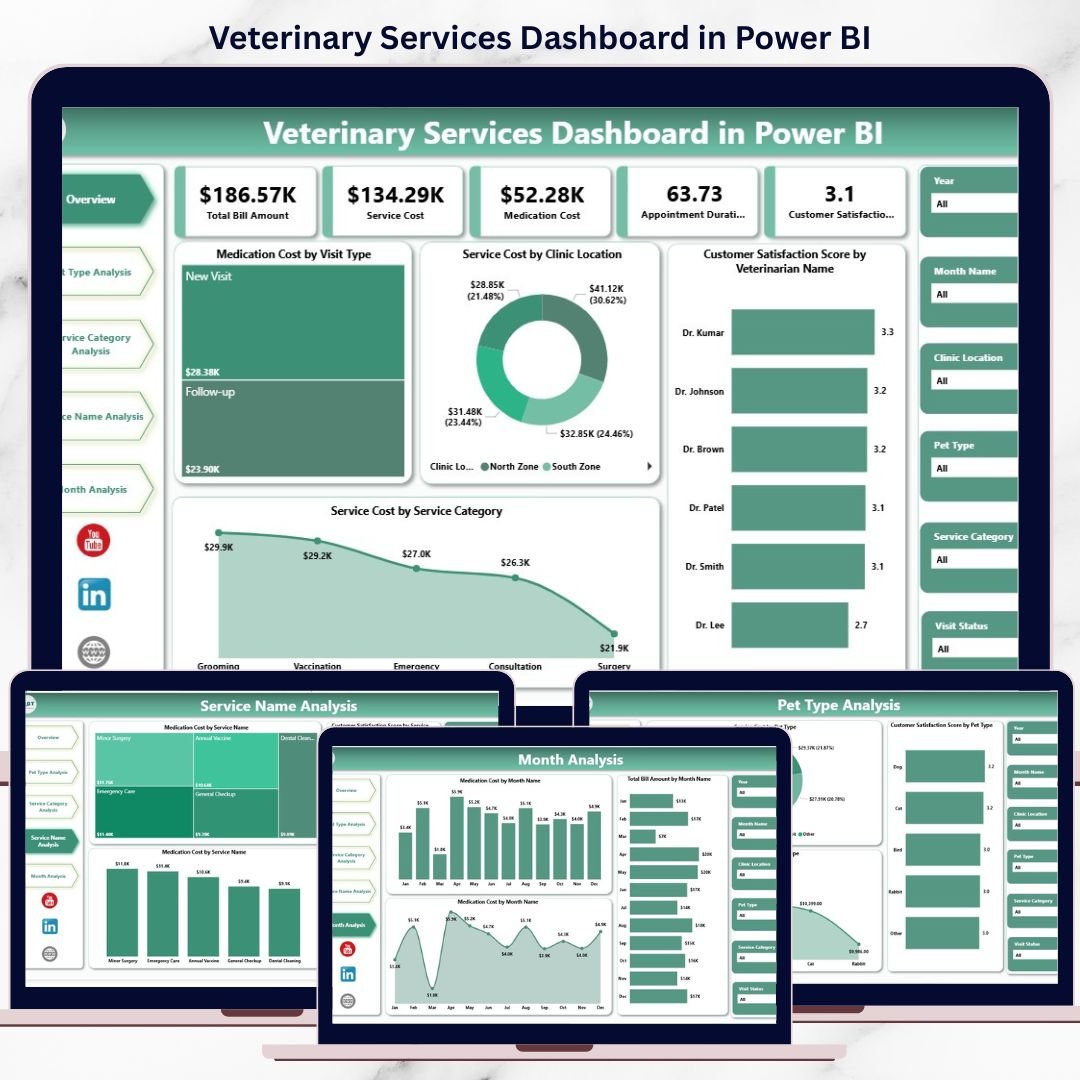
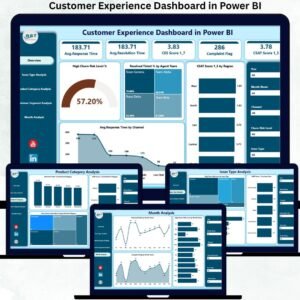
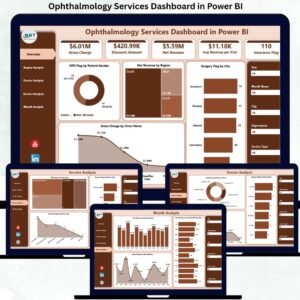
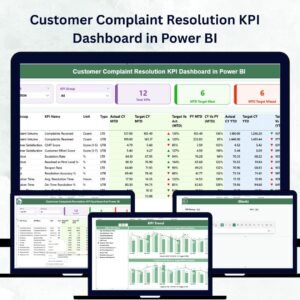
This ready-to-use Power BI dashboard transforms raw veterinary clinic data into interactive KPIs, dynamic visuals, and actionable insights. Instead of manually compiling reports, clinic owners and managers can instantly understand where money is spent, which services perform best, how customers feel, and how performance changes month by month—all from a single dashboard.
Designed for modern veterinary clinics, pet hospitals, and multi-location practices, this dashboard helps organizations control costs, improve service quality, and boost customer satisfaction using real data.
🔑 Key Features of Veterinary Services Dashboard in Power BI
📊 5 Structured Analytical Pages for complete clinic visibility
🎯 Interactive Slicers & Filters for instant drill-down analysis
📈 KPI Cards & Visual Charts for fast insights
💊 Medication Cost Tracking across services and pet types
🐶 Pet Type-Wise Performance Analysis
💰 Service Cost & Revenue Visibility
📆 Month-Wise Trend Monitoring
🔄 Automated Data Refresh from Excel or clinic systems
This dashboard delivers clarity, speed, and confidence—without manual reporting.
📂 What’s Inside the Veterinary Services Dashboard
🏠 Overview Page
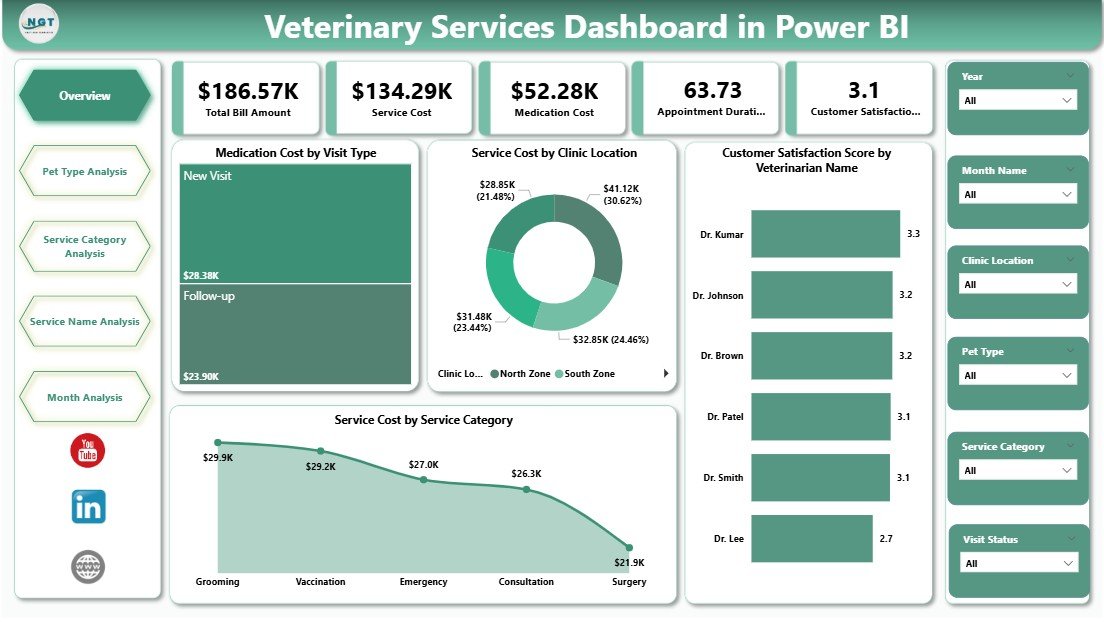
The Overview Page acts as the executive summary of the dashboard.
Key Insights Displayed:
-
Medication Cost by Visit Type
-
Service Cost by Clinic Location
-
Customer Satisfaction Score by Veterinarian Name
-
Service Cost by Service Category
This page allows management to spot cost drivers and service gaps within seconds.
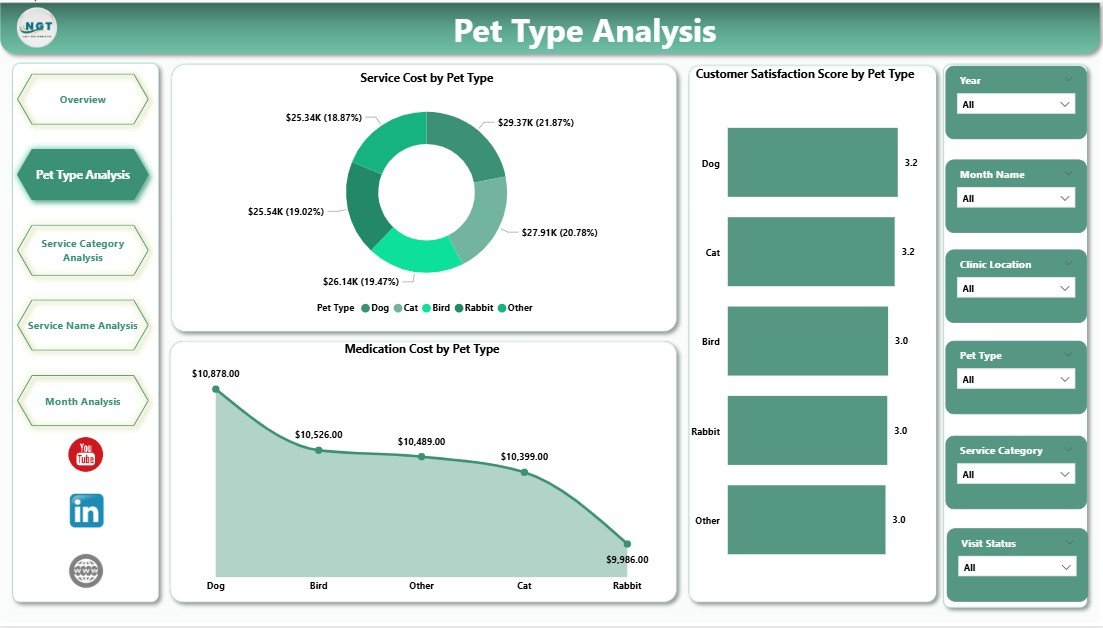
🐕 Pet Type Analysis Page
This page analyzes performance across pet categories such as dogs, cats, birds, and exotic animals.
Charts Included:
-
Medication Cost by Pet Type
-
Service Cost by Pet Type
-
Customer Satisfaction Score by Pet Type
Clinics quickly understand which pet types drive higher costs or satisfaction.
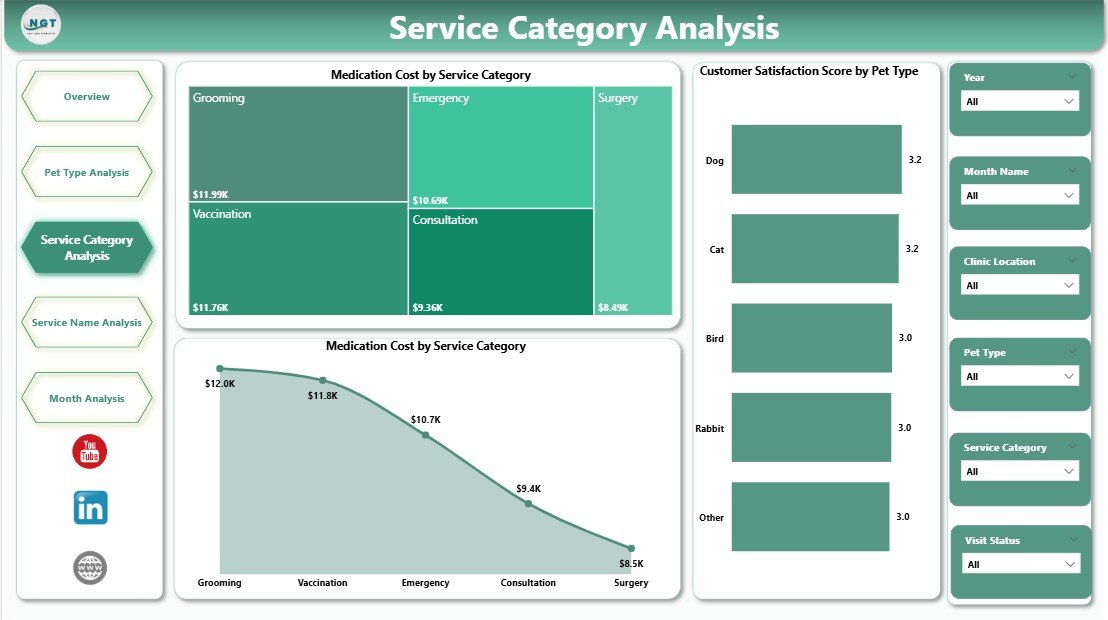
🏥 Service Category Analysis Page
Different veterinary services behave differently in terms of cost and revenue.
Key Visuals:
-
Medication Cost by Service Category
-
Total Bill Amount by Service Category
-
Customer Satisfaction Score by Service Category
This analysis supports pricing strategy, staffing decisions, and service optimization.
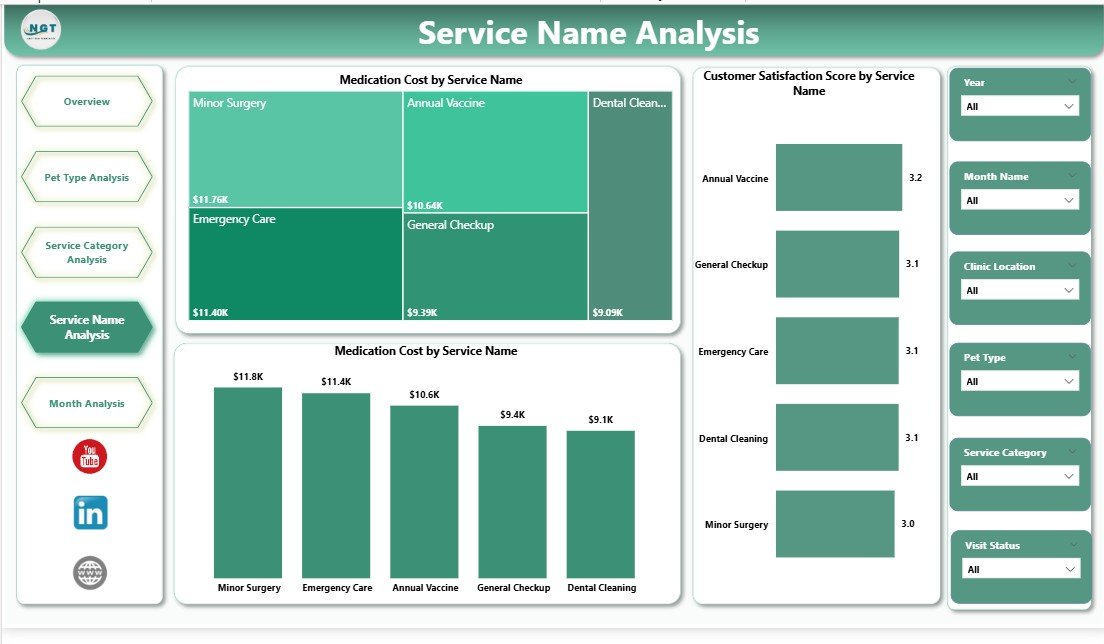
🩺 Service Name Analysis Page
This page provides deep insights into individual veterinary services.
Charts Available:
-
Medication Cost by Service Name
-
Total Bill Amount by Service Name
-
Customer Satisfaction Score by Service Name
Clinics can refine service-level pricing, quality, and protocols using real data.
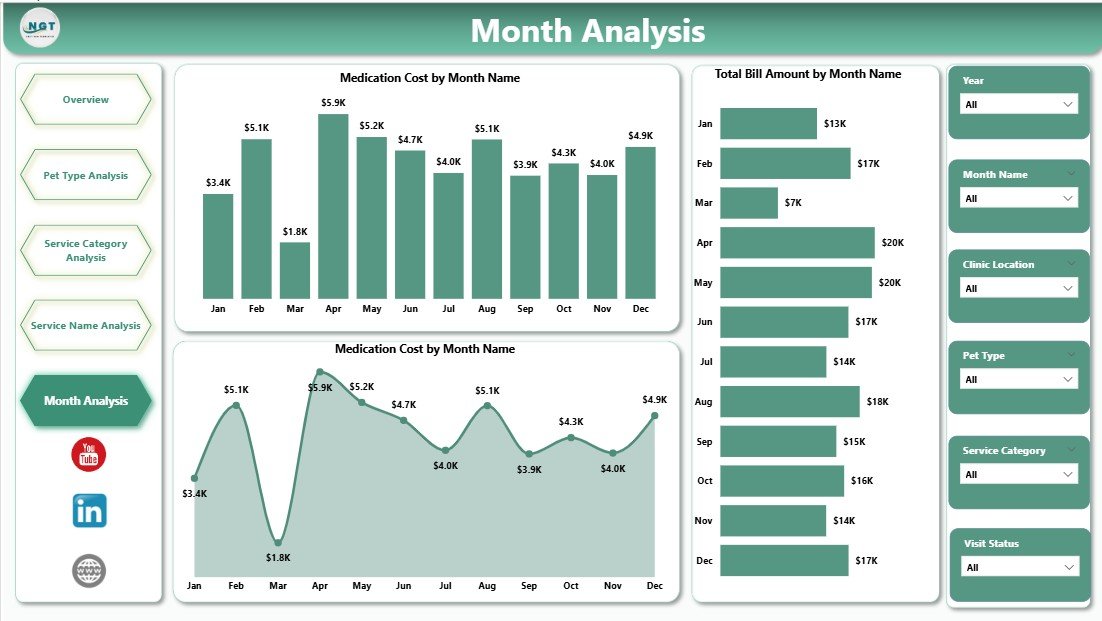
📆 Month Analysis Page
The Month Analysis Page highlights time-based trends and seasonality.
Key Metrics:
-
Medication Cost by Month
-
Total Bill Amount by Month
-
Service Cost by Month
This page helps clinics forecast demand, manage inventory, and plan budgets.
🛠️ How to Use the Veterinary Services Dashboard
✅ Connect Excel or clinic data to Power BI
✅ Refresh the dataset (manual or scheduled)
✅ Use slicers to filter by pet type, service, veterinarian, or month
✅ Review KPIs and trends instantly
✅ Make faster, data-driven clinic decisions
No advanced Power BI skills required for end users.
👥 Who Can Benefit from This Dashboard?
🐾 Veterinary Clinic Owners
🏥 Pet Hospitals & Animal Care Centers
📊 Practice Managers & Administrators
💰 Finance & Billing Teams
😊 Customer Experience Teams
Ideal for single-clinic practices and multi-location veterinary networks.
👉 Click here to read the Detailed blog post
▶️ Visit our YouTube channel to learn step-by-step video tutorials
https://youtube.com/@PKAnExcelExpert


Reviews
There are no reviews yet.