Modern agriculture no longer depends only on experience and intuition. Today, data-driven crop advisory platforms guide farmers, agribusinesses, and cooperatives in reducing costs, improving yields, managing risks, and increasing profitability. However, when advisory data remains scattered across farm logs, cost sheets, and yield reports, measuring real advisory impact becomes almost impossible.
That is exactly why the Crop Advisory Platforms Dashboard in Excel is a game-changing analytical solution 🚀.
This ready-to-use Excel dashboard transforms advisory, cost, yield, and risk data into clear KPIs, visual insights, and trend-based analysis, helping agritech organizations quantify advisory value and make smarter agricultural decisions.
Designed for crop advisory platforms, agritech companies, cooperatives, FPOs, research institutions, and sustainability teams, this dashboard helps you track advisory effectiveness, compare costs before and after advisory, analyze crop-wise and region-wise performance, and monitor risks over time—all inside Excel, without complex BI tools.
🔑 Key Features of Crop Advisory Platforms Dashboard in Excel
🌱 Clear Advisory Impact Measurement
Quantify savings, profit, and yield improvements before and after advisory.
📊 Centralized Agricultural Analytics
All advisory, cost, revenue, yield, and risk metrics in one dashboard.
💰 Cost, Revenue & Profit Visibility
Track financial outcomes of advisory services with clarity.
⚠ Risk Level Monitoring
Identify high-risk crops and regions early.
📈 Crop-Wise, Region-Wise & Advisory-Wise Analysis
Compare performance across multiple dimensions.
📅 Monthly Trend Analysis
Understand seasonality and long-term advisory impact.
🧭 Easy Page Navigation
Built-in page navigator for smooth, user-friendly navigation.
⚡ 100% Excel-Based & Easy to Use
No coding, no BI tools—simple, flexible, and scalable.
📂 What’s Inside the Crop Advisory Platforms Dashboard in Excel
🧭 Page Navigator
A left-side navigation panel that lets users move between pages instantly ideal for non-technical users.
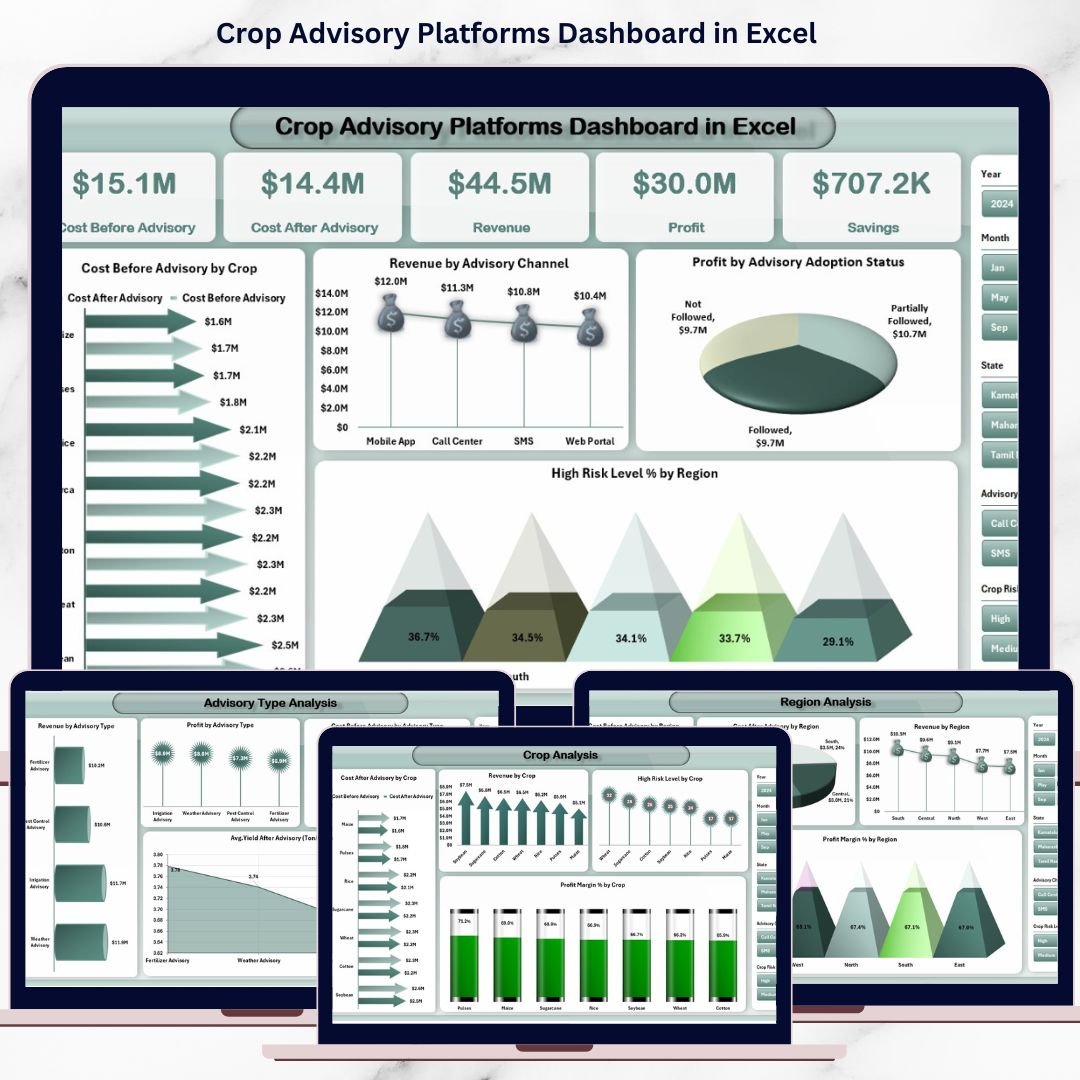
📊 Overview Page – Executive Performance Snapshot
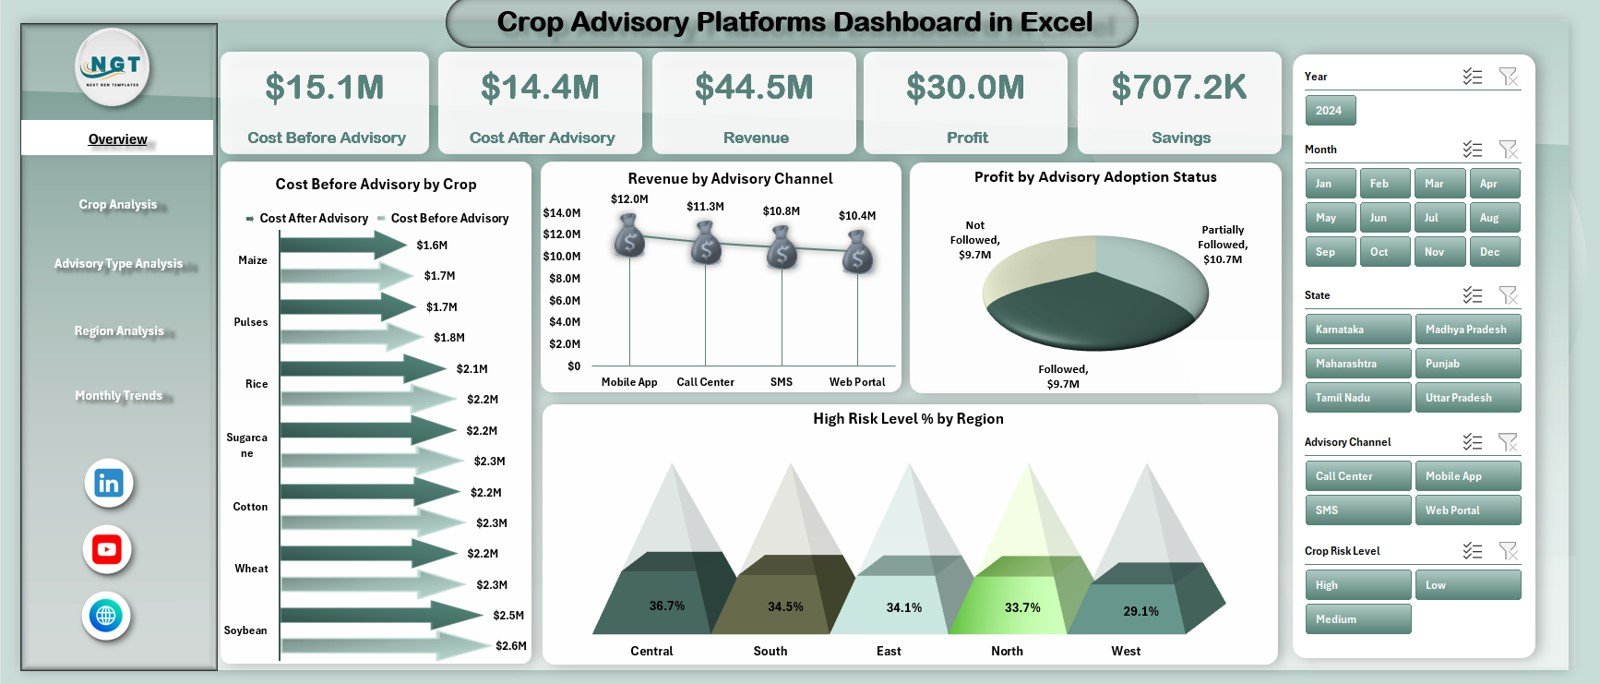
The Overview Page provides a high-level summary of advisory performance.
KPI Cards Display:
-
Cost Before Advisory
-
Cost After Advisory
-
Revenue
-
Profit
-
Savings
Charts Included:
📉 Cost Before vs Cost After Advisory by Crop
📊 Revenue by Advisory Channel
💰 Profit by Advisory Adoption Status
⚠ High-Risk Level (%) by Region
This page instantly shows where advisory creates value and where risks exist.
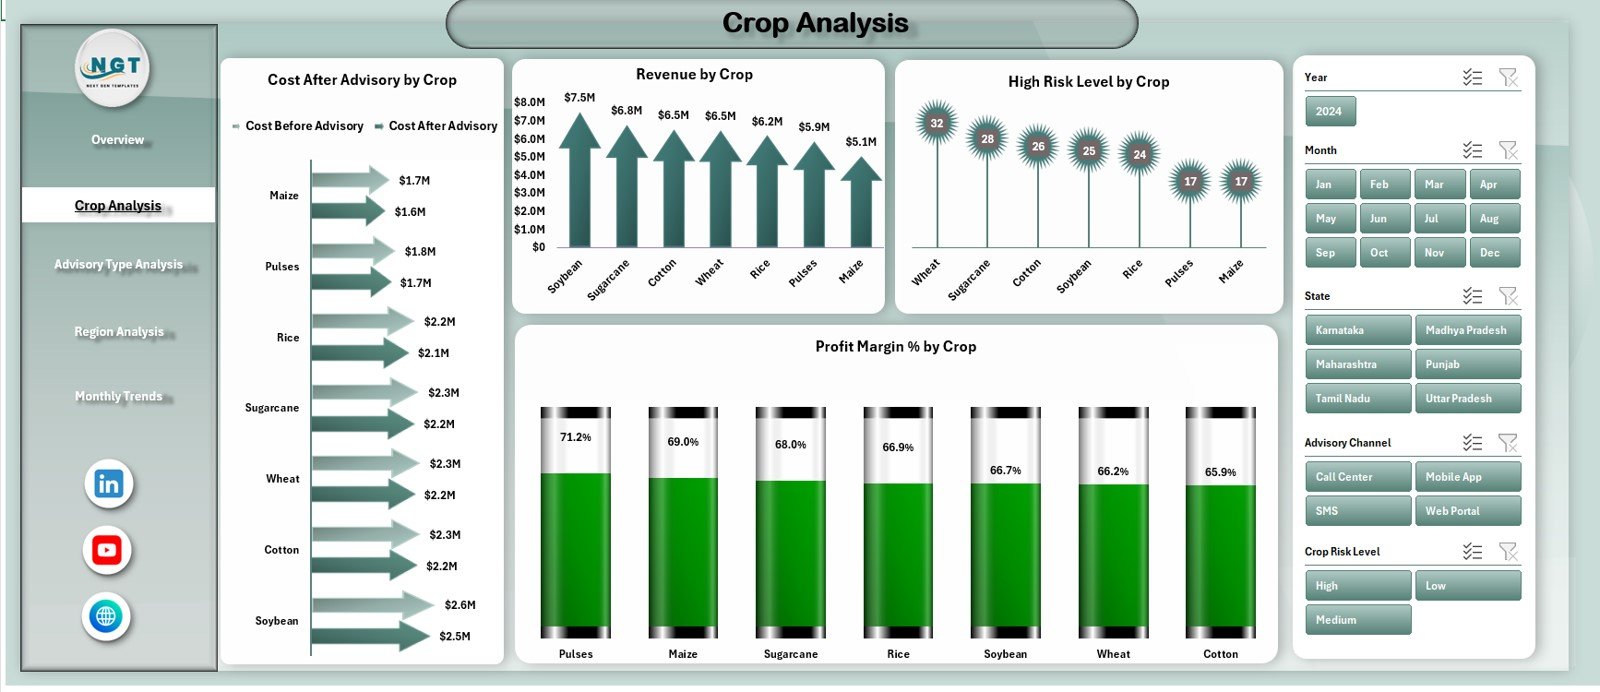
🌾 Crop Analysis Page – Crop-Wise Advisory Impact
Focuses on performance differences across crops.
Charts Included:
📉 Cost Before vs Cost After Advisory by Crop
💰 Revenue by Crop
⚠ High-Risk Level (%) by Crop
📈 Profit Margin (%) by Crop
Helps identify high-impact crops, risky crops, and profitability gaps.
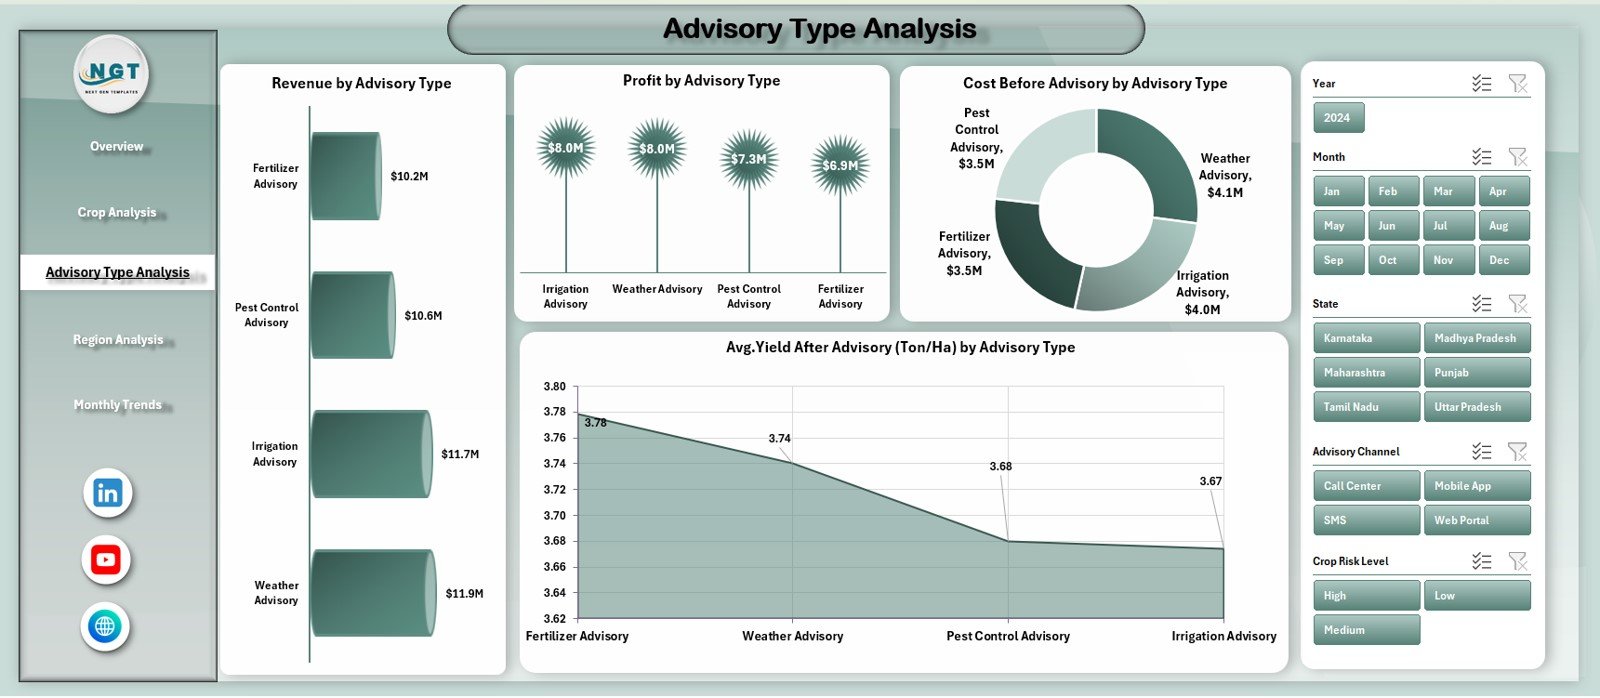
🧠 Advisory Type Analysis Page – Which Advisory Works Best?
Evaluates different advisory approaches and methods.
Charts Included:
💰 Revenue by Advisory Type
📈 Profit by Advisory Type
📉 Cost Before Advisory by Advisory Type
🌱 Avg. Yield After Advisory (Ton/Ha) by Advisory Type
Enables platforms to optimize advisory strategies and scale high-impact methods.
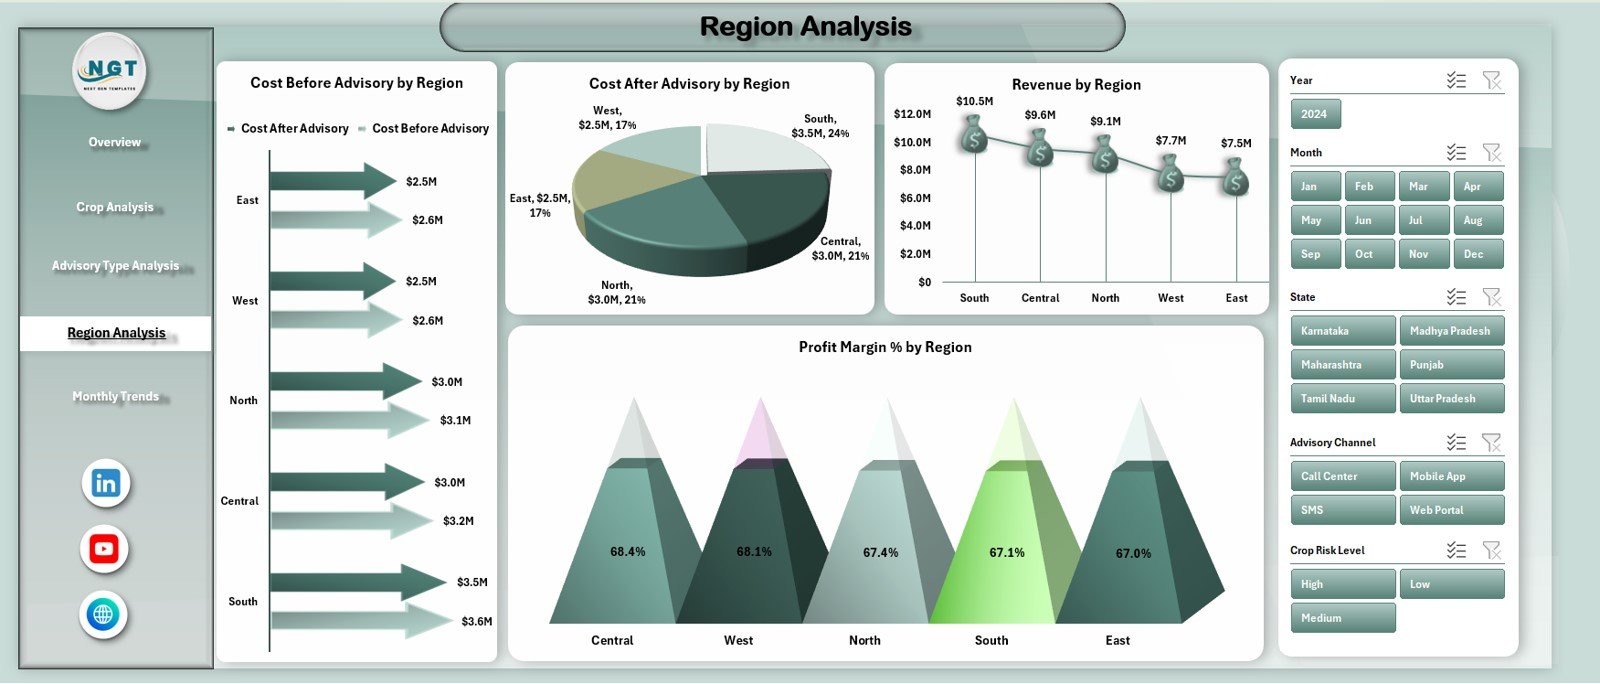
🌍 Region Analysis Page – Geographic Performance Comparison
Analyzes advisory outcomes across regions.
Charts Included:
📉 Cost After vs Cost Before Advisory by Region
📊 Cost After Advisory by Region
💰 Revenue by Region
📈 Profit Margin (%) by region
Supports regional planning, cost control, and risk management.
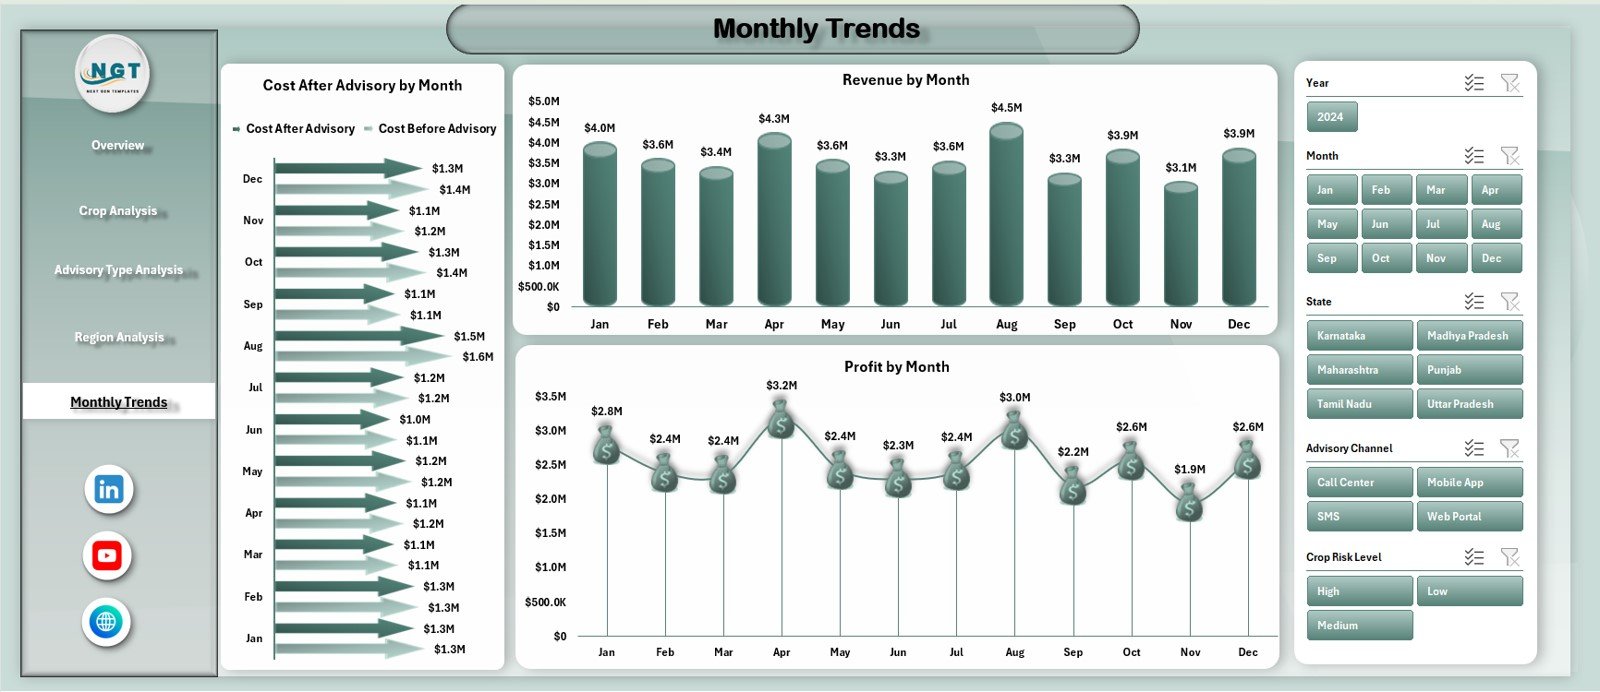
📅 Monthly Trends Page – Time-Based Advisory Insights
Tracks how performance changes over time.
Charts Included:
📉 Cost Before vs Cost After Advisory by Month
💰 Revenue by Month
📈 Profit by Month
Helps monitor seasonality, advisory consistency, and long-term impact.
⚙️ How to Use the Crop Advisory Platforms Dashboard in Excel
📝 Step 1: Update advisory, cost, revenue, yield, and risk data
📊 Step 2: Refresh calculations automatically in Excel
🔍 Step 3: Use slicers and navigator to explore insights
📈 Step 4: Review trends and performance gaps
🎯 Step 5: Improve advisory strategies and ROI
👥 Who Can Benefit from This Crop Advisory Platforms Dashboard
🌱 Agritech Companies – Measure advisory effectiveness
🚜 Crop Advisory Platforms – Track outcomes across farmers
🤝 FPOs & Cooperatives – Improve profitability and sustainability
📊 Research Institutions – Analyze advisory impact scientifically
♻ Sustainability Teams – Support data-driven farming practices
🔍 Click here to read the Detailed blog post
📺 Visit our YouTube channel to learn step-by-step video tutorials
👉 Youtube.com/@PKAnExcelExpert


Reviews
There are no reviews yet.