In the soil testing and agronomy services industry, accuracy, turnaround time, and operational efficiency decide credibility and long-term growth. However, when performance data sits across multiple Excel files, manual reports slow down decisions and increase errors.
That is where the Soil Testing Services KPI Dashboard in Excel becomes a powerful performance management solution 🚀.
This ready-to-use Excel dashboard transforms raw laboratory and service data into clear KPIs, instant comparisons, and actionable insights—all in one centralized file.
Designed for soil testing laboratories, agronomy consultants, and environmental service providers, this dashboard helps you track MTD and YTD performance, compare targets with actuals, analyze trends, and improve service quality consistently—without using any complex BI tools.
🔑 Key Features of Soil Testing Services KPI Dashboard in Excel
📊 Centralized KPI Monitoring
Track all soil testing service KPIs in one interactive dashboard instead of scattered reports.
📅 Dynamic Month Selection
Select any month from a drop-down, and the entire dashboard updates automatically.
🎯 Target vs Actual Analysis
Quickly identify performance gaps using percentages and visual indicators.
📈 MTD & YTD Performance Tracking
Monitor both short-term progress and long-term service performance.
🔁 Current Year vs Previous Year Comparison
Understand growth, decline, and seasonal patterns with YoY analysis.
📉 Trend Analysis by KPI
Analyze individual KPI trends using dedicated MTD and YTD charts.
📘 LTB & UTB KPI Logic
Accurately evaluate KPIs using Lower-the-Better and Upper-the-better logic.
⚡ 100% Excel-Based Solution
No BI tools required—easy adoption, easy maintenance, and full control.
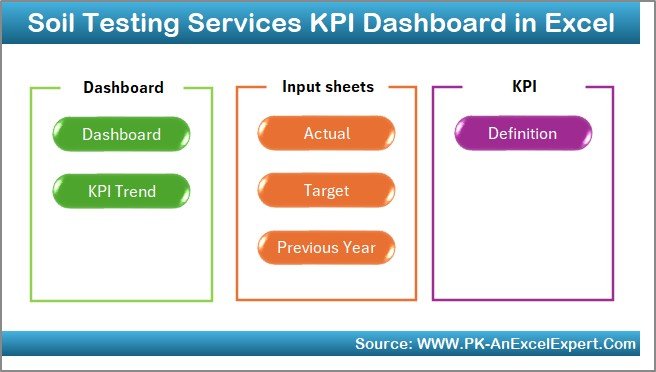
📂 What’s Inside the Soil Testing Services KPI Dashboard in Excel
📌 Home Sheet
An index page with navigation buttons for one-click access to all worksheets.
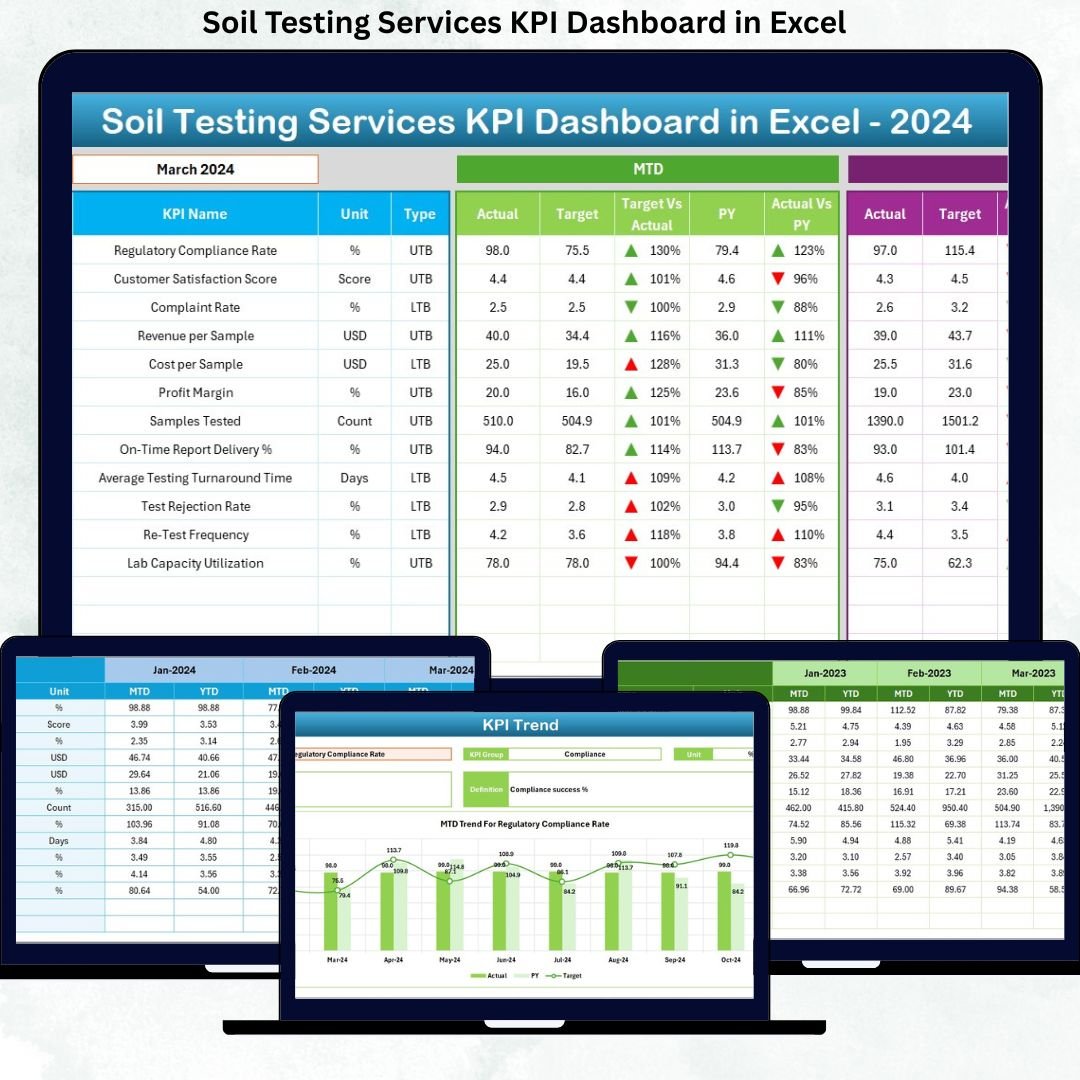
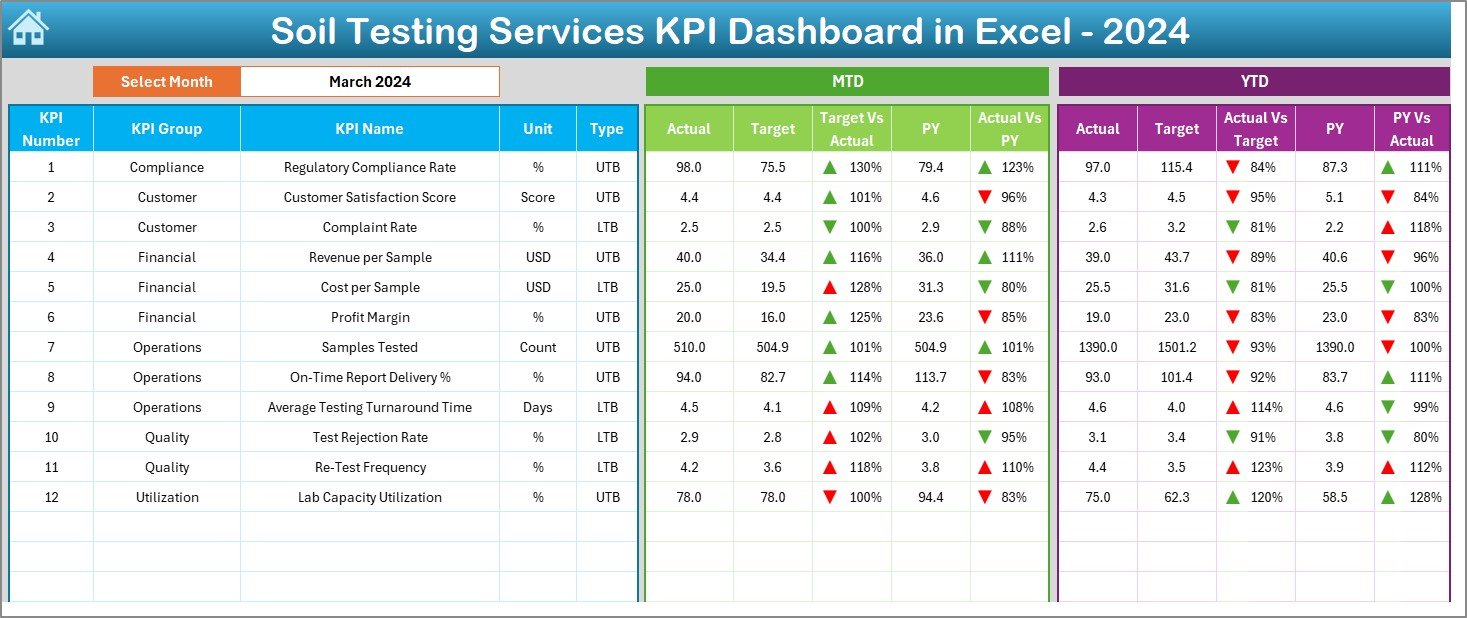
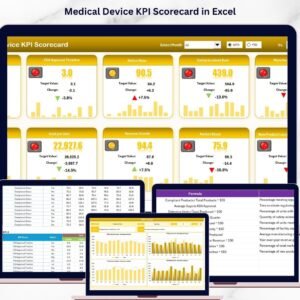
📊 Dashboard Sheet
The main performance page showing MTD and YTD actuals, targets, previous year values, and variance indicators.
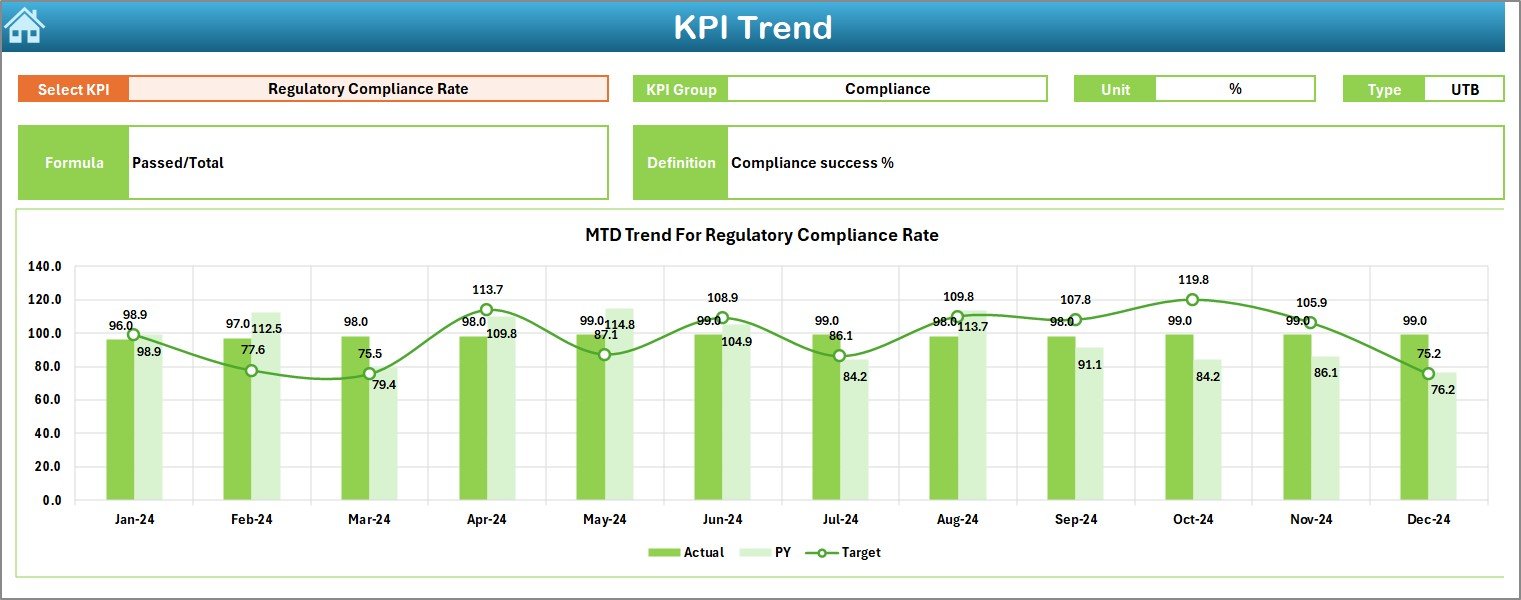
📈 KPI Trend Sheet
A detailed trend analysis page where users select a KPI and view its MTD and YTD trends instantly.
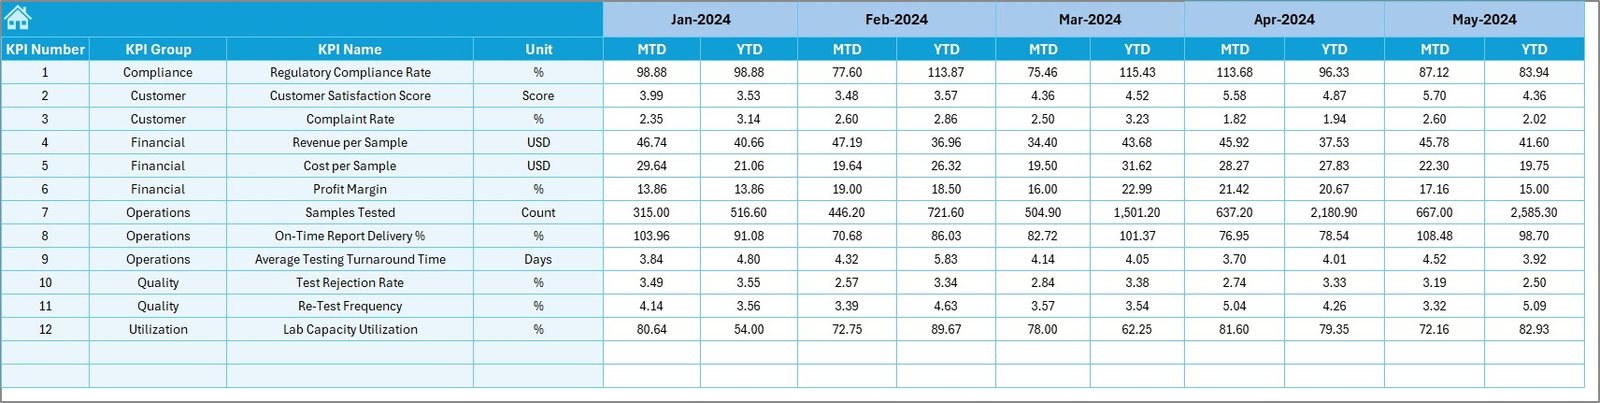
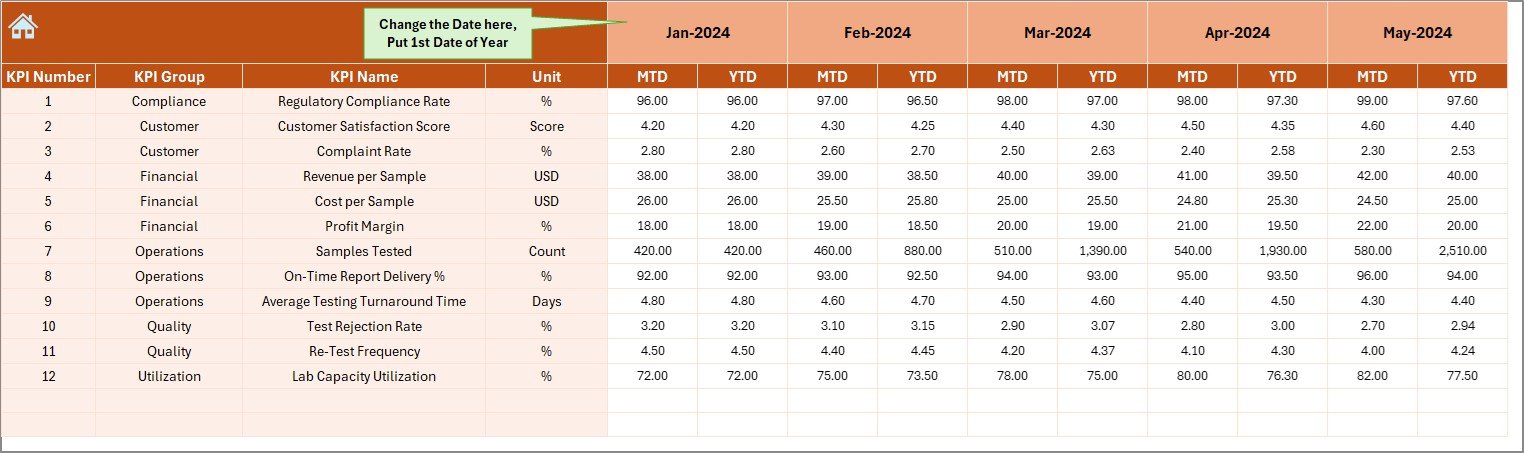
📥 Actual Numbers Input Sheet
Enter current-year MTD and YTD actual values in a structured format.
🎯 Target Sheet
Define monthly and yearly targets for each KPI to enable automatic comparisons.
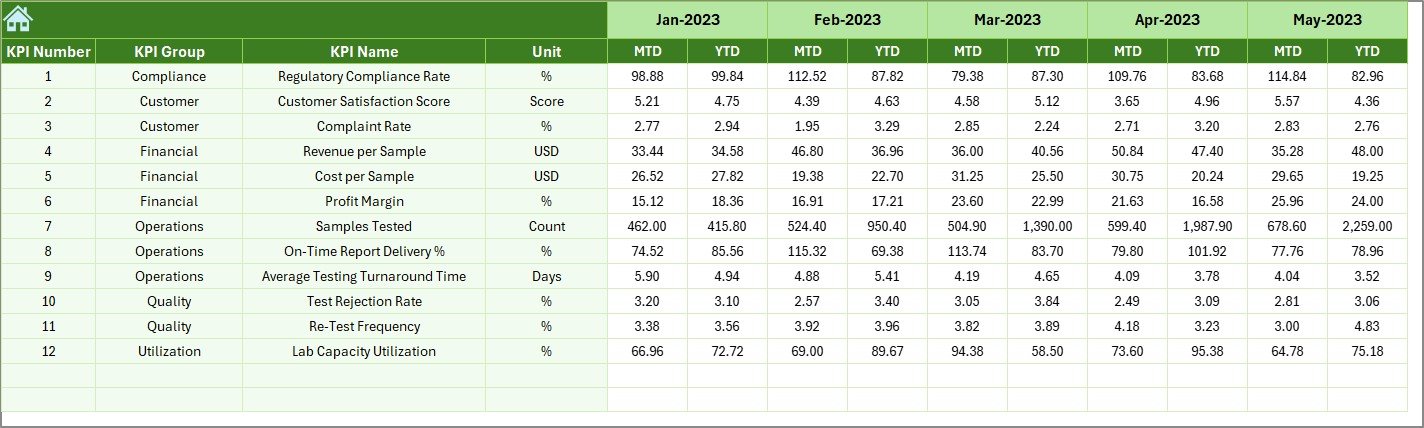
📅 Previous Year Number Sheet
Store last year’s data to support accurate year-over-year analysis.
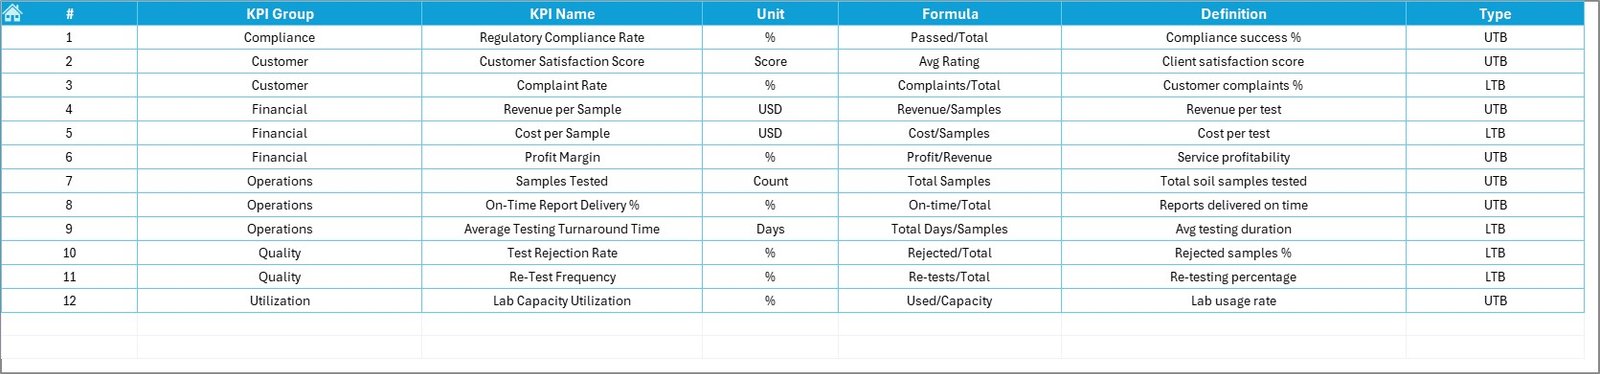
📘 KPI Definition Sheet
Clearly document KPI groups, units, formulas, definitions, and LTB/UTB type.
⚙️ How to Use the Soil Testing Services KPI Dashboard in Excel
📝 Step 1: Enter Data
Update actual values, targets, and previous year data in the input sheets.
📅 Step 2: Select Month
Choose a month from cell D3 to view MTD and YTD performance instantly.
📊 Step 3: Review Dashboard
Analyze KPI status using arrows, percentages, and comparisons.
📈 Step 4: Analyze Trends
Use the KPI Trend Sheet to identify patterns, delays, and improvement areas.
🎯 Step 5: Take Action
Improve turnaround time, accuracy, and operational efficiency using data-driven insights.
👥 Who Can Benefit from This Soil Testing Services KPI Dashboard in Excel
🧪 Soil Testing Laboratories – Monitor accuracy, volume, and turnaround KPIs
🌾 Agronomy Consultants – Track service efficiency and client performance
📊 Quality Managers – Identify error rates and quality deviations early
🏭 Operations Heads – Improve productivity and workflow efficiency
📈 Business Owners & Managers – Make confident, data-driven decisions
🔍 Click here to read the Detailed blog post
📺 Visit our YouTube channel to learn step-by-step video tutorials
👉 Youtube.com/@PKAnExcelExpert


Reviews
There are no reviews yet.