



Managing a consumer electronics service operation without clear performance visibility is like repairing devices without diagnostic tools. Delays, repeat repairs, rising service costs, and unhappy customers quickly become the norm. That is exactly why the Consumer Electronics Service KPI Dashboard in Excel is designed—to give you instant clarity, control, and confidence over your service operations.
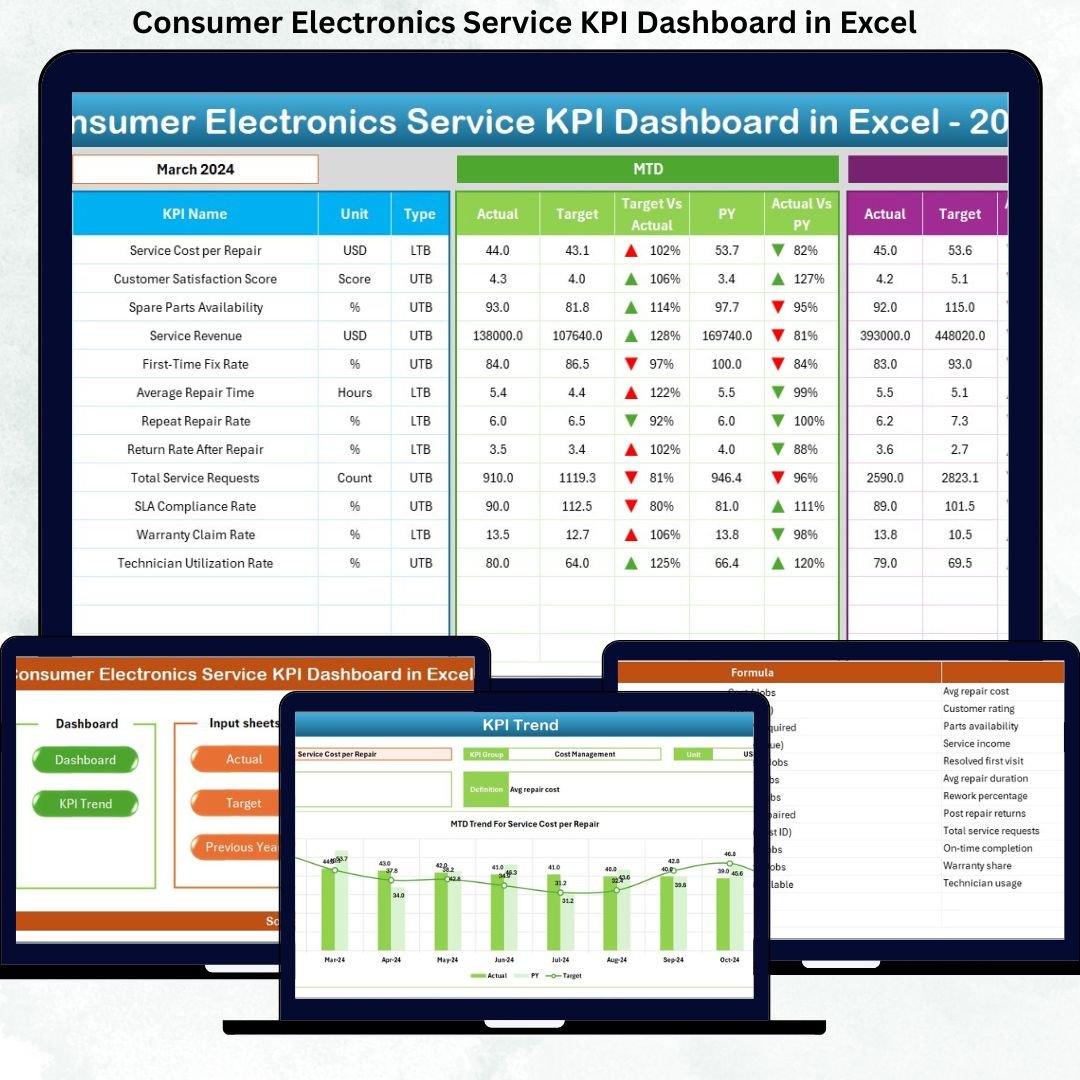
This powerful Excel-based dashboard transforms raw service data into actionable insights. Instead of juggling multiple spreadsheets, you get a single, centralized performance command center to monitor service efficiency, turnaround time, technician productivity, service quality, and cost control—all in one place.
Whether you manage a small service center or a large electronics service operation, this dashboard helps you identify problems early, track progress accurately, and improve service outcomes faster.
🚀 Key Features of Consumer Electronics Service KPI Dashboard in Excel
📌 Centralized KPI Monitoring
Track all critical consumer electronics service KPIs in one interactive dashboard without switching between files.
📅 Dynamic Month Selection
Select any month using a dropdown (cell D3), and the entire dashboard updates automatically.
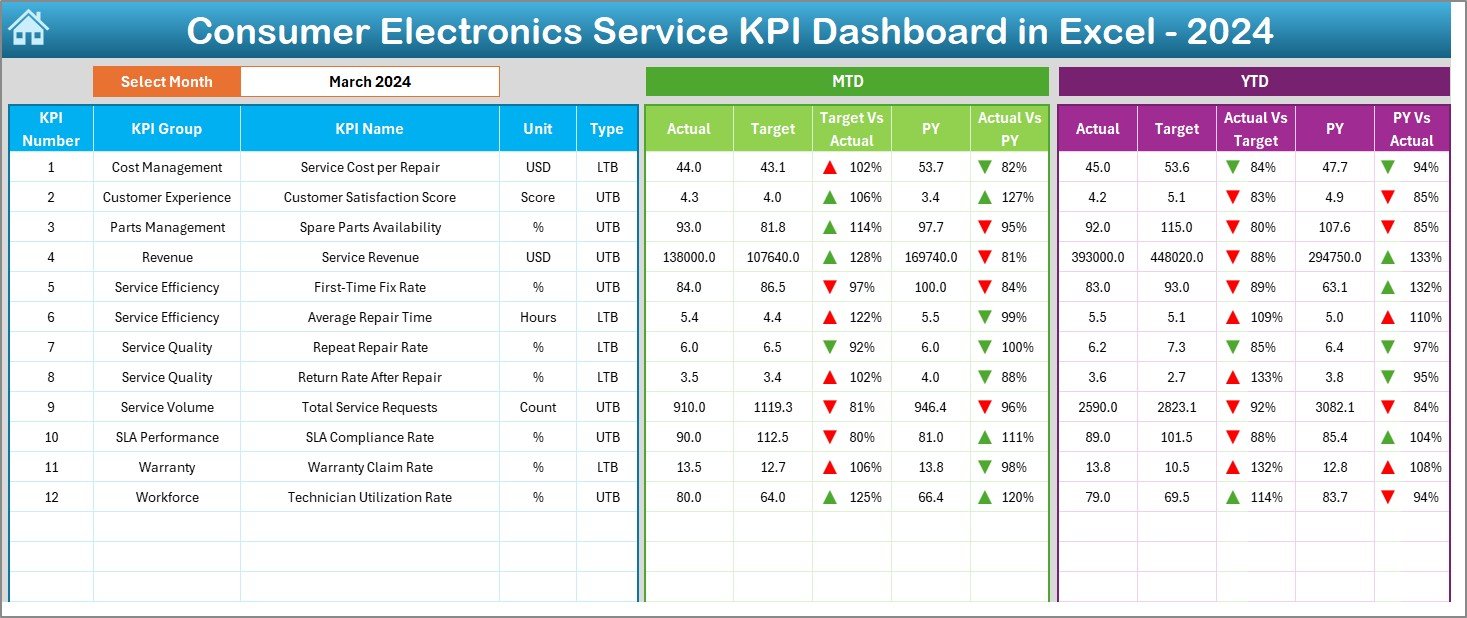
📊 MTD & YTD Performance Tracking
Monitor Month-to-Date and Year-to-Date performance side by side for better operational control.
🎯 Target vs Actual Comparison
Instantly identify performance gaps using variance analysis and visual indicators.
📈 Previous Year Benchmarking
Compare current performance with last year’s numbers to measure improvement or decline.
🔻🔺 Smart Conditional Formatting
Up-down arrows highlight underperforming and outperforming KPIs instantly.
🧠 Built-in KPI Knowledge Base
Clear KPI definitions, formulas, units, and performance direction ensure everyone speaks the same language.
📁 What’s Inside the Consumer Electronics Service KPI Dashboard
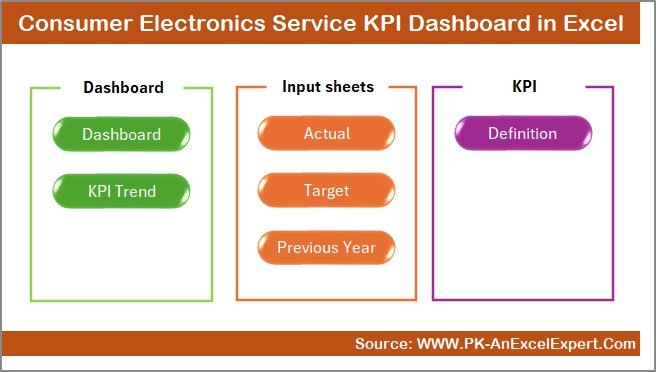
This Excel dashboard includes 7 well-structured worksheets, each designed for a specific purpose:
📄 Summary Page – Acts as an index with navigation buttons for quick access
📊 Dashboard Sheet – Displays all KPIs with MTD, YTD, targets, and comparisons
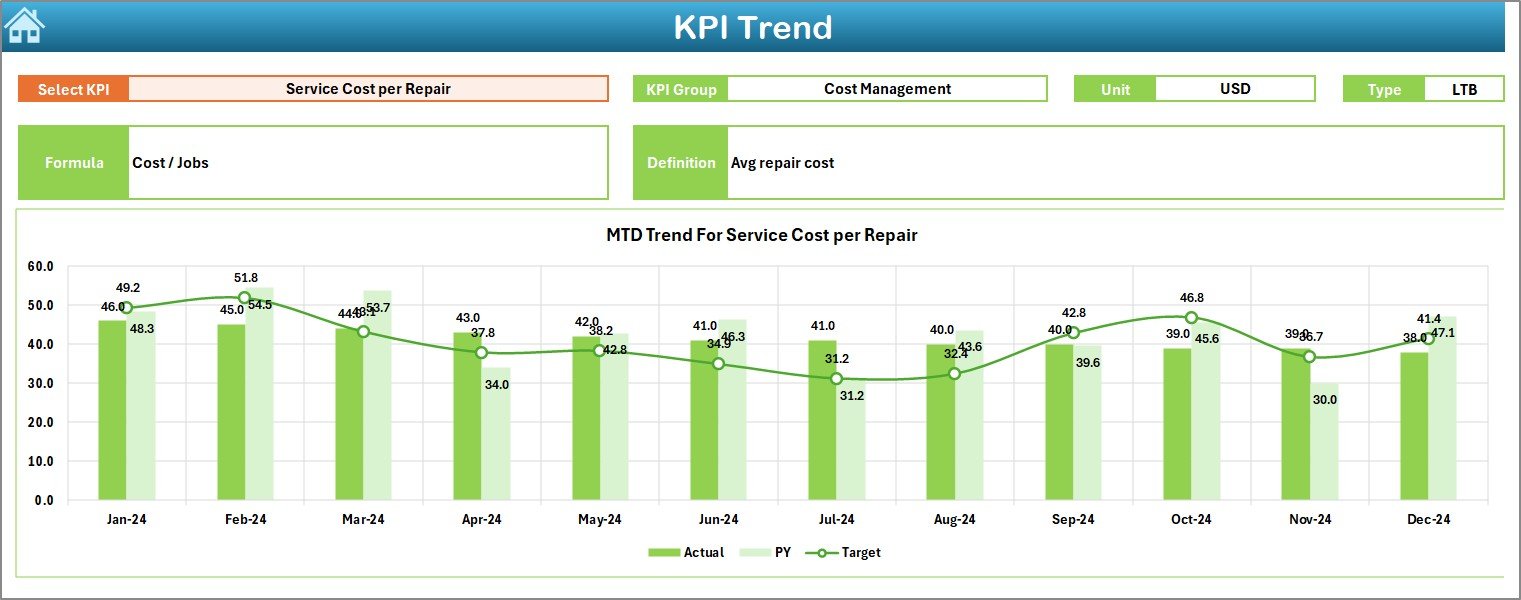
📈 Trend Sheet – Deep-dive KPI analysis with MTD & YTD trend charts
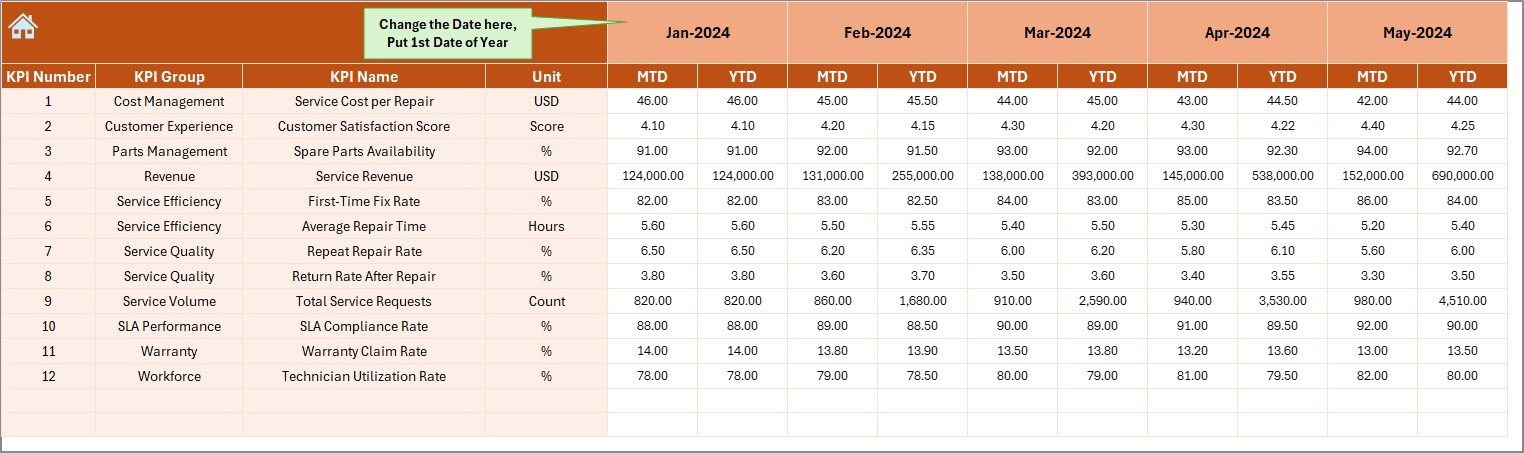
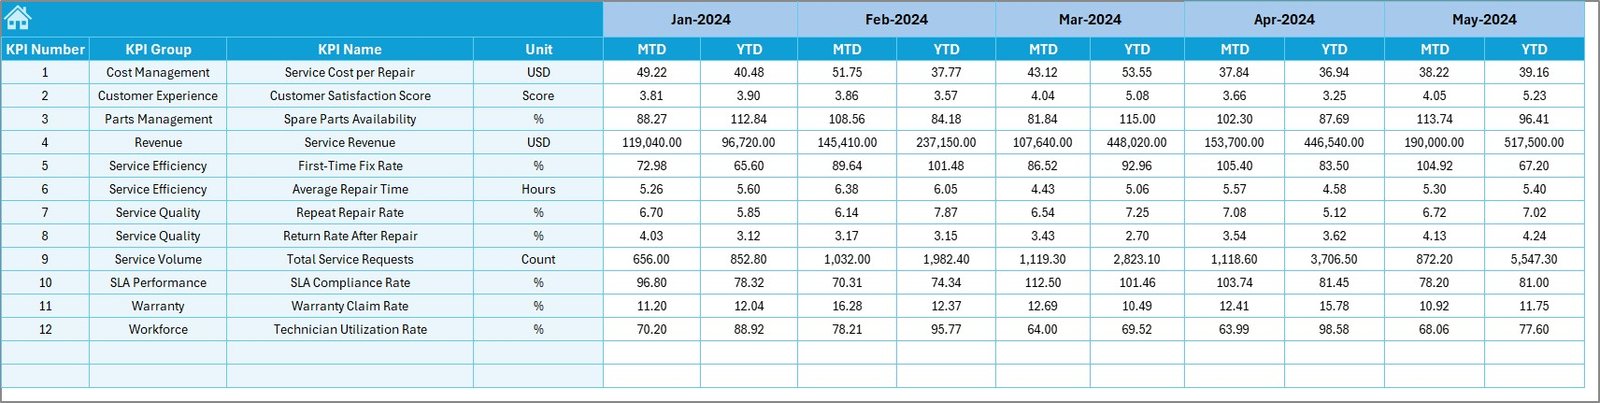
✍️ Actual Number Sheet – Enter real service performance data
🎯 Target Sheet – Define monthly and yearly service targets
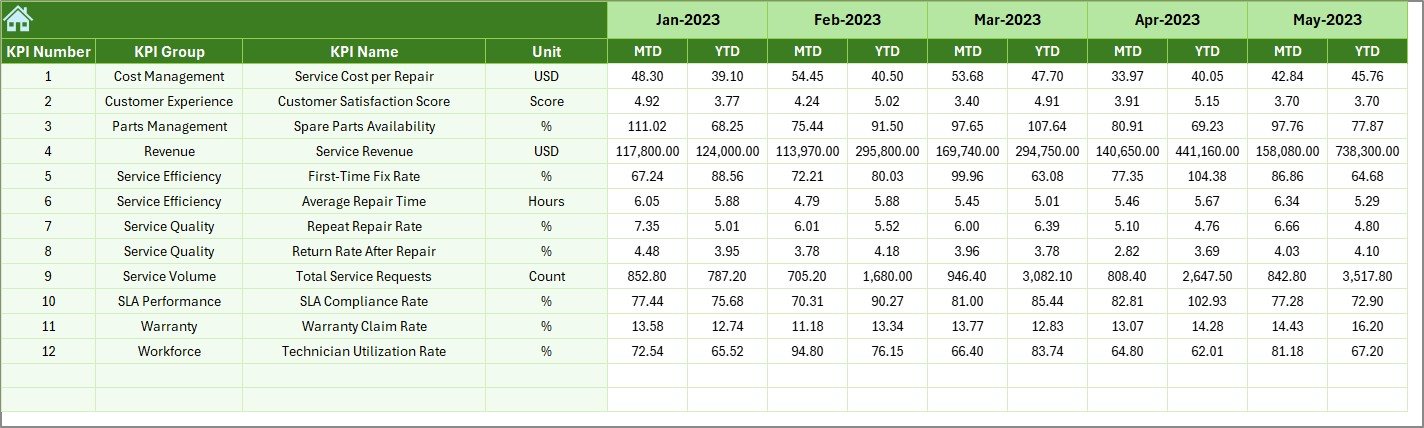
📅 Previous Year Sheet – Store last year’s data for benchmarking
📘 KPI Definition Sheet – KPI name, group, unit, formula, and definition
Together, these sheets form a complete service performance management system in Excel.
🛠️ How to Use the Consumer Electronics Service KPI Dashboard
Using this dashboard is simple and business-friendly:
1️⃣ Enter actual service performance data in the Actual Number Sheet
2️⃣ Define expected goals in the Target Sheet
3️⃣ Add historical values in the Previous Year Sheet
4️⃣ Select a month from the dropdown
5️⃣ Instantly analyze KPIs, trends, and performance gaps
No advanced Excel skills required—just update data and review insights.
👥 Who Can Benefit from This Consumer Electronics Service KPI Dashboard?
This dashboard is ideal for:
👨💼 Service Center Managers – Improve turnaround time and service efficiency
📦 Operations Heads – Monitor cost, productivity, and performance trends
🛠️ Technician Supervisors – Track productivity and repeat repair issues
📊 Quality Assurance Teams – Improve service quality and customer satisfaction
🏢 Electronics Service Business Owners – Make data-driven decisions confidently
Whether small or large, any electronics service operation can benefit from this Excel dashboard.
Click here to read the Detailed blog post
Visit our YouTube channel to learn step-by-step video tutorials
Watch the step-by-step video tutorial:
Compatibility and Requirements
- Works in Microsoft Excel desktop (Excel 2016 or later, or Microsoft 365).
- You pick the month from a dropdown in cell D3 of the Dashboard sheet. Microsoft explains dropdowns in Create a drop-down list.
Frequently Asked Questions
How many sheets does the dashboard have?
Seven sheets: Summary Page, Dashboard, Trend, Actual Number, Target, Previous Year and KPI Definition.
How do I change the month?
Select a month from the dropdown in cell D3 on the Dashboard sheet. The whole dashboard updates for that month.
Where do I enter my own service data?
Enter actual figures in the Actual Number sheet, goals in the Target sheet and last year’s figures in the Previous Year sheet.
Does it show MTD and YTD results?
Yes. The Dashboard sheet shows Month-to-Date and Year-to-Date values side by side with targets and previous year numbers. Up and down arrows mark KPIs that are above or below target.
Is there a similar dashboard in Power BI or Google Sheets?
There is a Consumer Electronics Service Dashboard in Power BI and a Consumer Electronics KPI Dashboard in Google Sheets.
Related Service and Electronics Templates
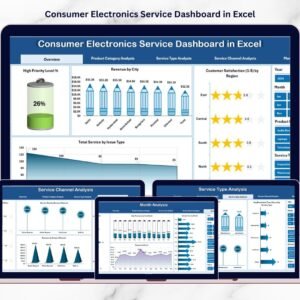
- Consumer Electronics Service Dashboard in Excel: another service view in Excel
- Consumer Electronics Service Dashboard in Power BI: the Power BI edition
- Consumer Electronics KPI Dashboard in Excel: KPIs for the wider electronics business
- After-Sales Service KPI Dashboard in Excel: KPIs for after-sales support
- KPI Dashboard Library (Excel): 15 KPI dashboards in one download
Browse all Excel KPI dashboards.






Reviews
There are no reviews yet.