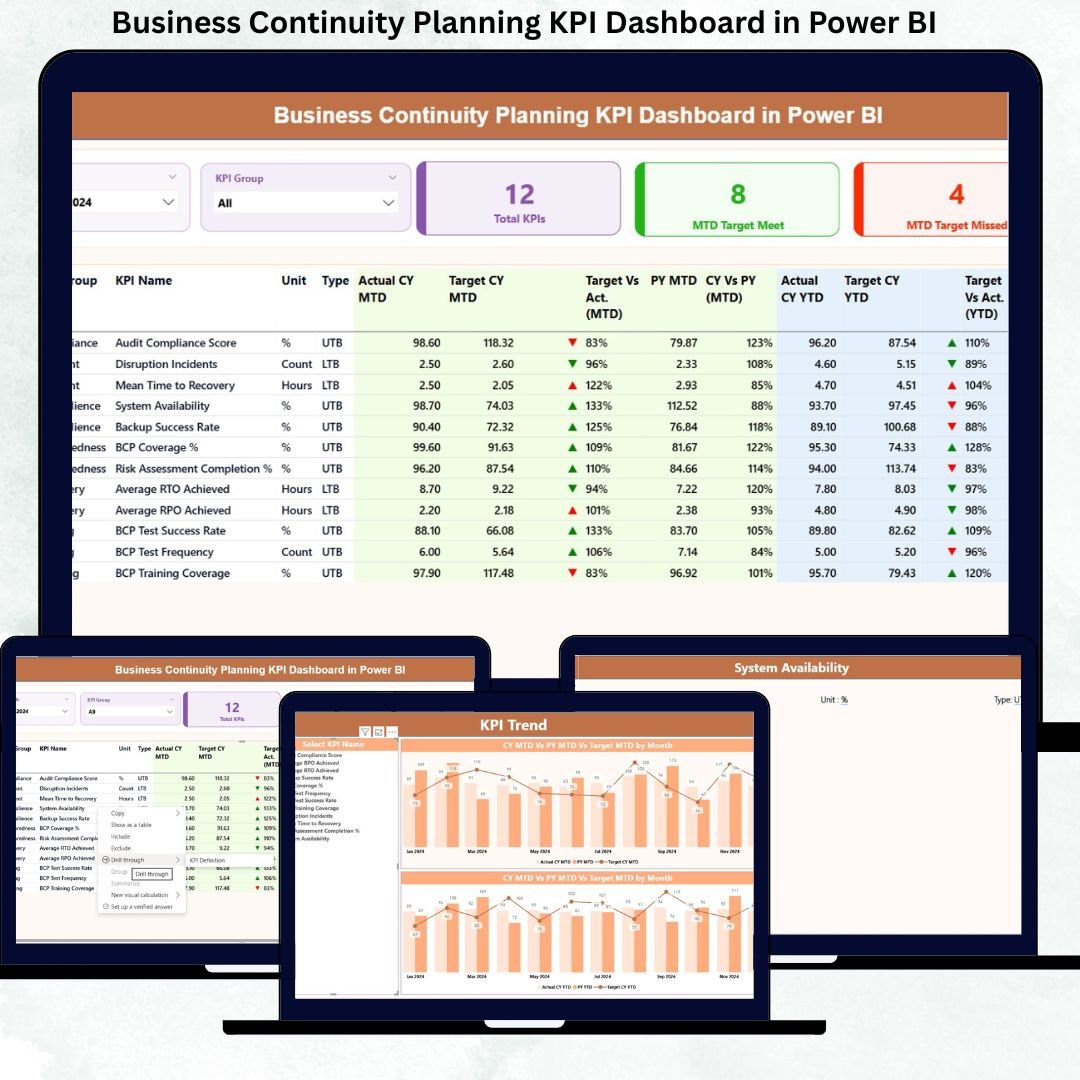
Business disruptions are no longer rare events—they are inevitable. Cyberattacks, system failures, supply chain breakdowns, natural disasters, and operational risks can strike without warning. That is exactly why organizations need a Business Continuity Planning KPI Dashboard in Power BI that goes beyond static reports and reactive planning.
The Business Continuity Planning KPI Dashboard in Power BI is a ready-to-use, business-ready analytics solution designed to help organizations measure preparedness, monitor response efficiency, and evaluate recovery performance using structured KPIs. Instead of managing scattered Excel files, manual reports, and delayed insights, this dashboard provides a single source of truth for continuity performance.
Built using Excel for data input and Power BI for visualization, this dashboard delivers clarity, control, and confidence to decision-makers—without technical complexity.
## 🚀 Key Features of Business Continuity Planning KPI Dashboard in Power BI
📊 Centralized KPI Monitoring
Track all business continuity KPIs from one structured Power BI dashboard instead of multiple disconnected reports.
📅 MTD & YTD Performance Tracking
Monitor Month-to-Date and Year-to-Date continuity performance simultaneously for short-term control and long-term planning.
🎯 Target vs Actual Visibility
Instantly identify target-met and target-missed KPIs using clear visual indicators and status arrows.
📈 Trend-Based Insights
Analyze KPI performance trends over time to detect early warning signs and recurring continuity risks.
🧩 KPI Classification Logic
Supports both LTB (Lower the Better) and UTB (Upper the Better) KPI types for accurate performance evaluation.
🛡️ Audit & Compliance Ready
Structured KPI definitions, formulas, and historical comparisons support ISO 22301, internal audits, and compliance reviews.
## 📦 What’s Inside the Business Continuity Planning KPI Dashboard
This dashboard includes three well-structured Power BI pages, each designed for a specific analytical purpose:
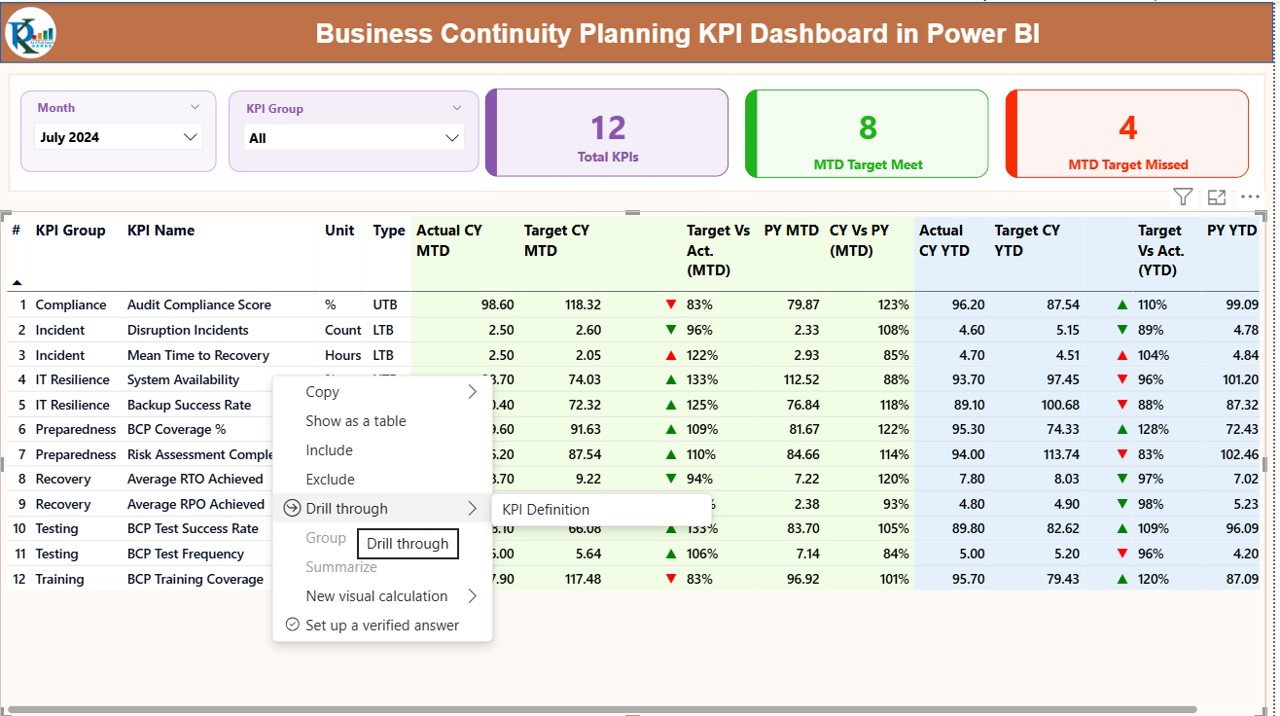
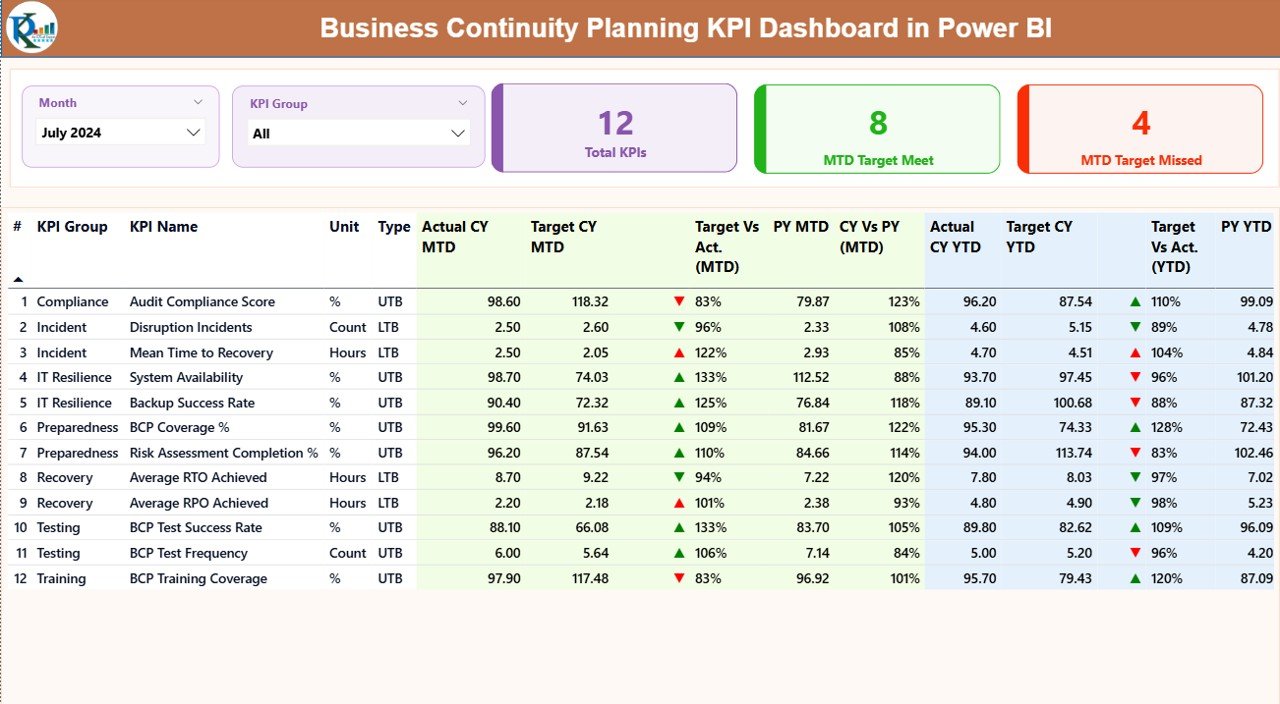
📌 Summary Page
Acts as the control center with Month and KPI Group slicers, KPI count cards, MTD target meet/miss indicators, and a detailed KPI table covering MTD, YTD, CY vs PY, and status icons.
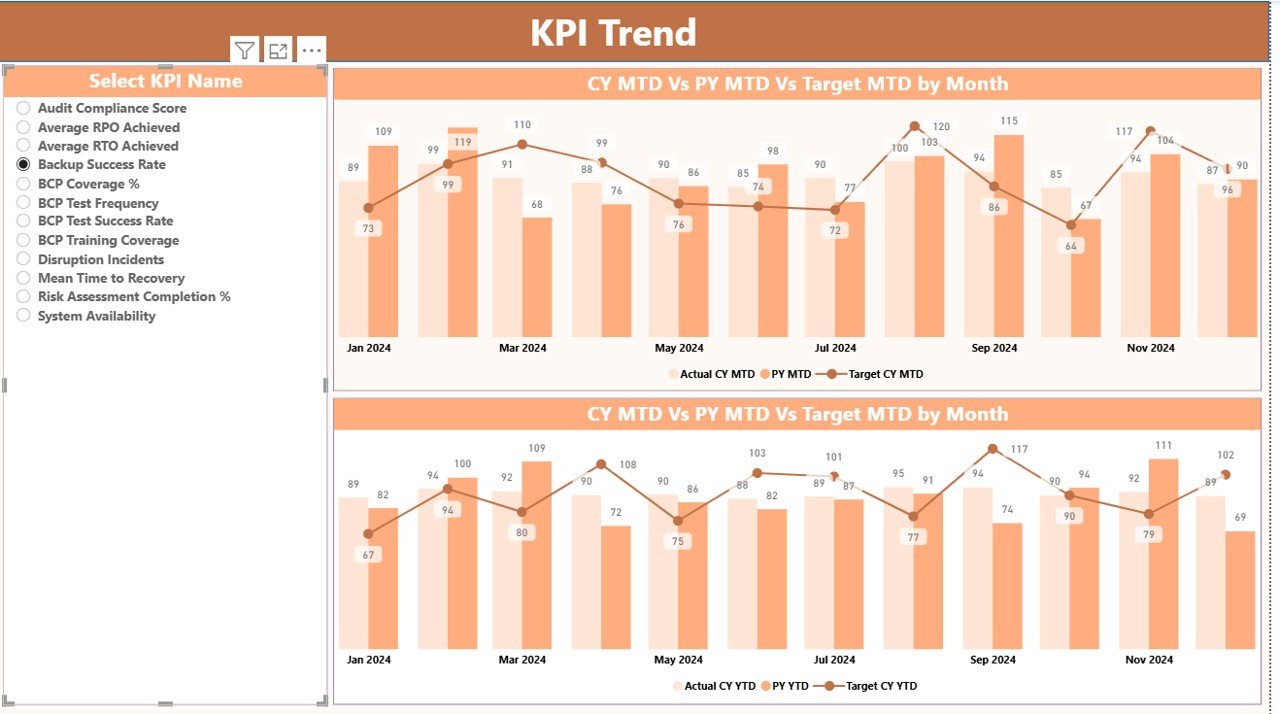
📌 KPI Trend Page
Includes dynamic combo charts comparing Actual vs Target vs Previous Year for both MTD and YTD performance, along with a KPI Name slicer for focused analysis.
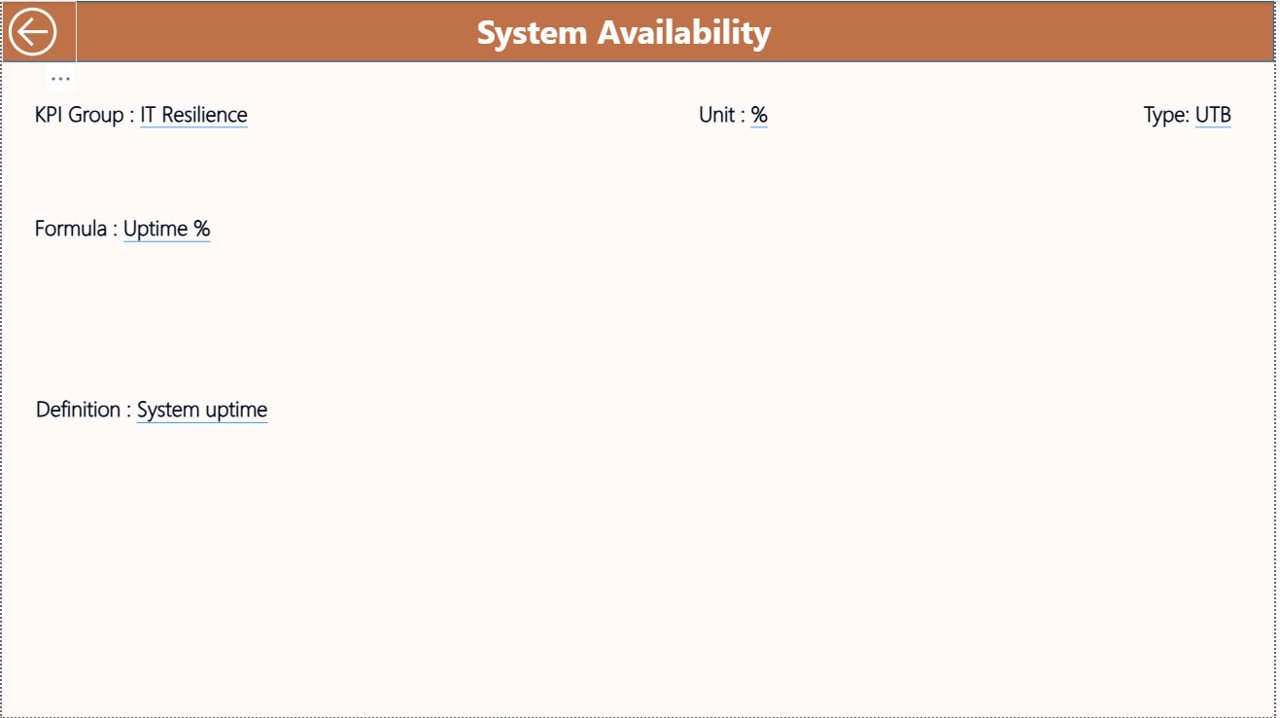
📌 KPI Definition Page (Drill-Through)
Displays KPI formulas, definitions, measurement logic, and KPI type, ensuring consistency and clarity across teams.
📊 Excel Data Model Included
-
Input_Actual sheet for MTD & YTD actual values
-
Input_Target sheet for target values
-
KPI Definition sheet for KPI structure, formulas, and logic
## 🧭 How to Use the Business Continuity Planning KPI Dashboard
✅ Step 1: Enter KPI actual and target values in the provided Excel sheets
✅ Step 2: Define KPI groups, formulas, and types (LTB/UTB)
✅ Step 3: Refresh the Power BI report
✅ Step 4: Analyze performance using slicers, tables, and charts
✅ Step 5: Identify gaps, prioritize actions, and track improvements
Because of its simple architecture, no advanced Power BI or coding skills are required.
## 👥 Who Can Benefit from This Business Continuity Planning KPI Dashboard
👔 Business Continuity Managers – Monitor preparedness and recovery readiness
⚠️ Risk & Compliance Teams – Ensure regulatory and audit alignment
🖥️ IT & Disaster Recovery Teams – Track system resilience KPIs
🏭 Operations Leaders – Identify operational continuity gaps
📋 Internal Audit Teams – Access clear KPI documentation
📊 Executives & Senior Management – Make confident, data-driven decisions
This dashboard delivers value across the organization without additional reporting effort.
Click here to read the Detailed blog post
Watch the step-by-step video tutorial:


Reviews
There are no reviews yet.