


In today’s hyper-competitive streaming industry, data moves fast—but decisions must move faster. Subscriber growth, churn rates, engagement trends, content performance, and revenue KPIs change every single month. If you rely on scattered Excel files or static reports, you risk reacting too late.
That is exactly why the Digital Streaming Platforms KPI Dashboard in Power BI is a game-changing analytics solution.
This ready-to-use Power BI dashboard transforms raw KPI data into clear visuals, instant insights, and executive-level performance tracking. Instead of spending hours building reports, your teams can focus on action, strategy, and growth.
Designed specifically for OTT platforms, video streaming services, and subscription-based media companies, this dashboard gives you full control over MTD, YTD, target vs actual, and year-over-year performance—all in one place.
🚀 Key Features of Digital Streaming Platforms KPI Dashboard in Power BI
📊 Centralized KPI Monitoring
Track all critical streaming KPIs in one interactive Power BI dashboard without switching between files.
🎯 MTD & YTD Performance Tracking
Monitor month-to-date and year-to-date performance to stay aligned with short-term and long-term goals.
📈 Target vs Actual Comparison
Instantly identify KPIs that meet or miss targets using visual indicators and calculated ratios.
🔍 Year-Over-Year Analysis
Compare current year performance against previous year values for deeper trend insights.
⚡ Interactive Slicers & Filters
Analyze KPIs by Month and KPI Group with just one click.
📘 Built-in KPI Definitions
Drill through to view KPI formulas, definitions, units, and logic—no external documentation required.
🧩 Excel-Based Data Input
Easily maintain data using structured Excel sheets without technical complexity.
⚙️ Low Maintenance & Scalable
Add new KPIs or update targets effortlessly as your business grows.
📦 What’s Inside the Digital Streaming Platforms KPI Dashboard in Power BI
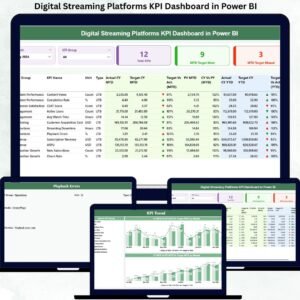
This product includes a professionally designed Power BI Desktop (.pixy) file connected to an Excel-based data model.

📄 Dashboard Pages Included:
-
Summary Page – Executive snapshot with KPI cards, slicers, and detailed KPI table
-
KPI Trend Page – MTD & YTD trend analysis using combo charts
-
KPI Definition Page – Hidden drill-through page for KPI governance
📊 Excel Data Sheets Included:
-
Input Actual – Enter actual MTD & YTD KPI values
-
Input Target – Maintain monthly target values
-
KPI Definition – Define KPI number, group, unit, formula, and type (LTB / UTB)
Everything is pre-built, structured, and business-ready—just plug in your data and refresh.
🛠️ How to Use the Digital Streaming Platforms KPI Dashboard in Power BI
1️⃣ Update actual KPI values in the Input Actual Excel sheet
2️⃣ Maintain target values in the Input Target sheet
3️⃣ Define or update KPIs in the KPI Definition sheet
4️⃣ Open the Power BI file and click Refresh
5️⃣ Use slicers to analyze KPIs by month, group, or individual KPI
6️⃣ Drill through any KPI to view its definition instantly
No advanced Power BI skills required—perfect for both analysts and leadership teams.
👥 Who Can Benefit from This Digital Streaming Platforms KPI Dashboard in Power BI
🎥 OTT & Streaming Platform Founders
📊 Business & Data Analysts
📈 Product & Growth Managers
💼 Strategy & Leadership Teams
💰 Finance & Revenue Teams
🧠 Operations & Performance Managers
If your business depends on subscriber growth, engagement metrics, churn control, and revenue optimization, this dashboard is built for you.
🔎 Click here to read the Detailed blog post
👉 Visit our YouTube channel to learn step-by-step video tutorials and real dashboard walkthroughs.


Reviews
There are no reviews yet.