Glass manufacturing runs on precision, efficiency, and quality. Even a small delay, defect, or energy spike can significantly impact profitability. Yet, many glass plants still depend on scattered Excel files, manual reporting, and delayed reviews. As a result, critical performance gaps often go unnoticed until they become costly problems.
That is exactly where the Glass Manufacturing KPI Dashboard in Power BI becomes a game-changing solution.
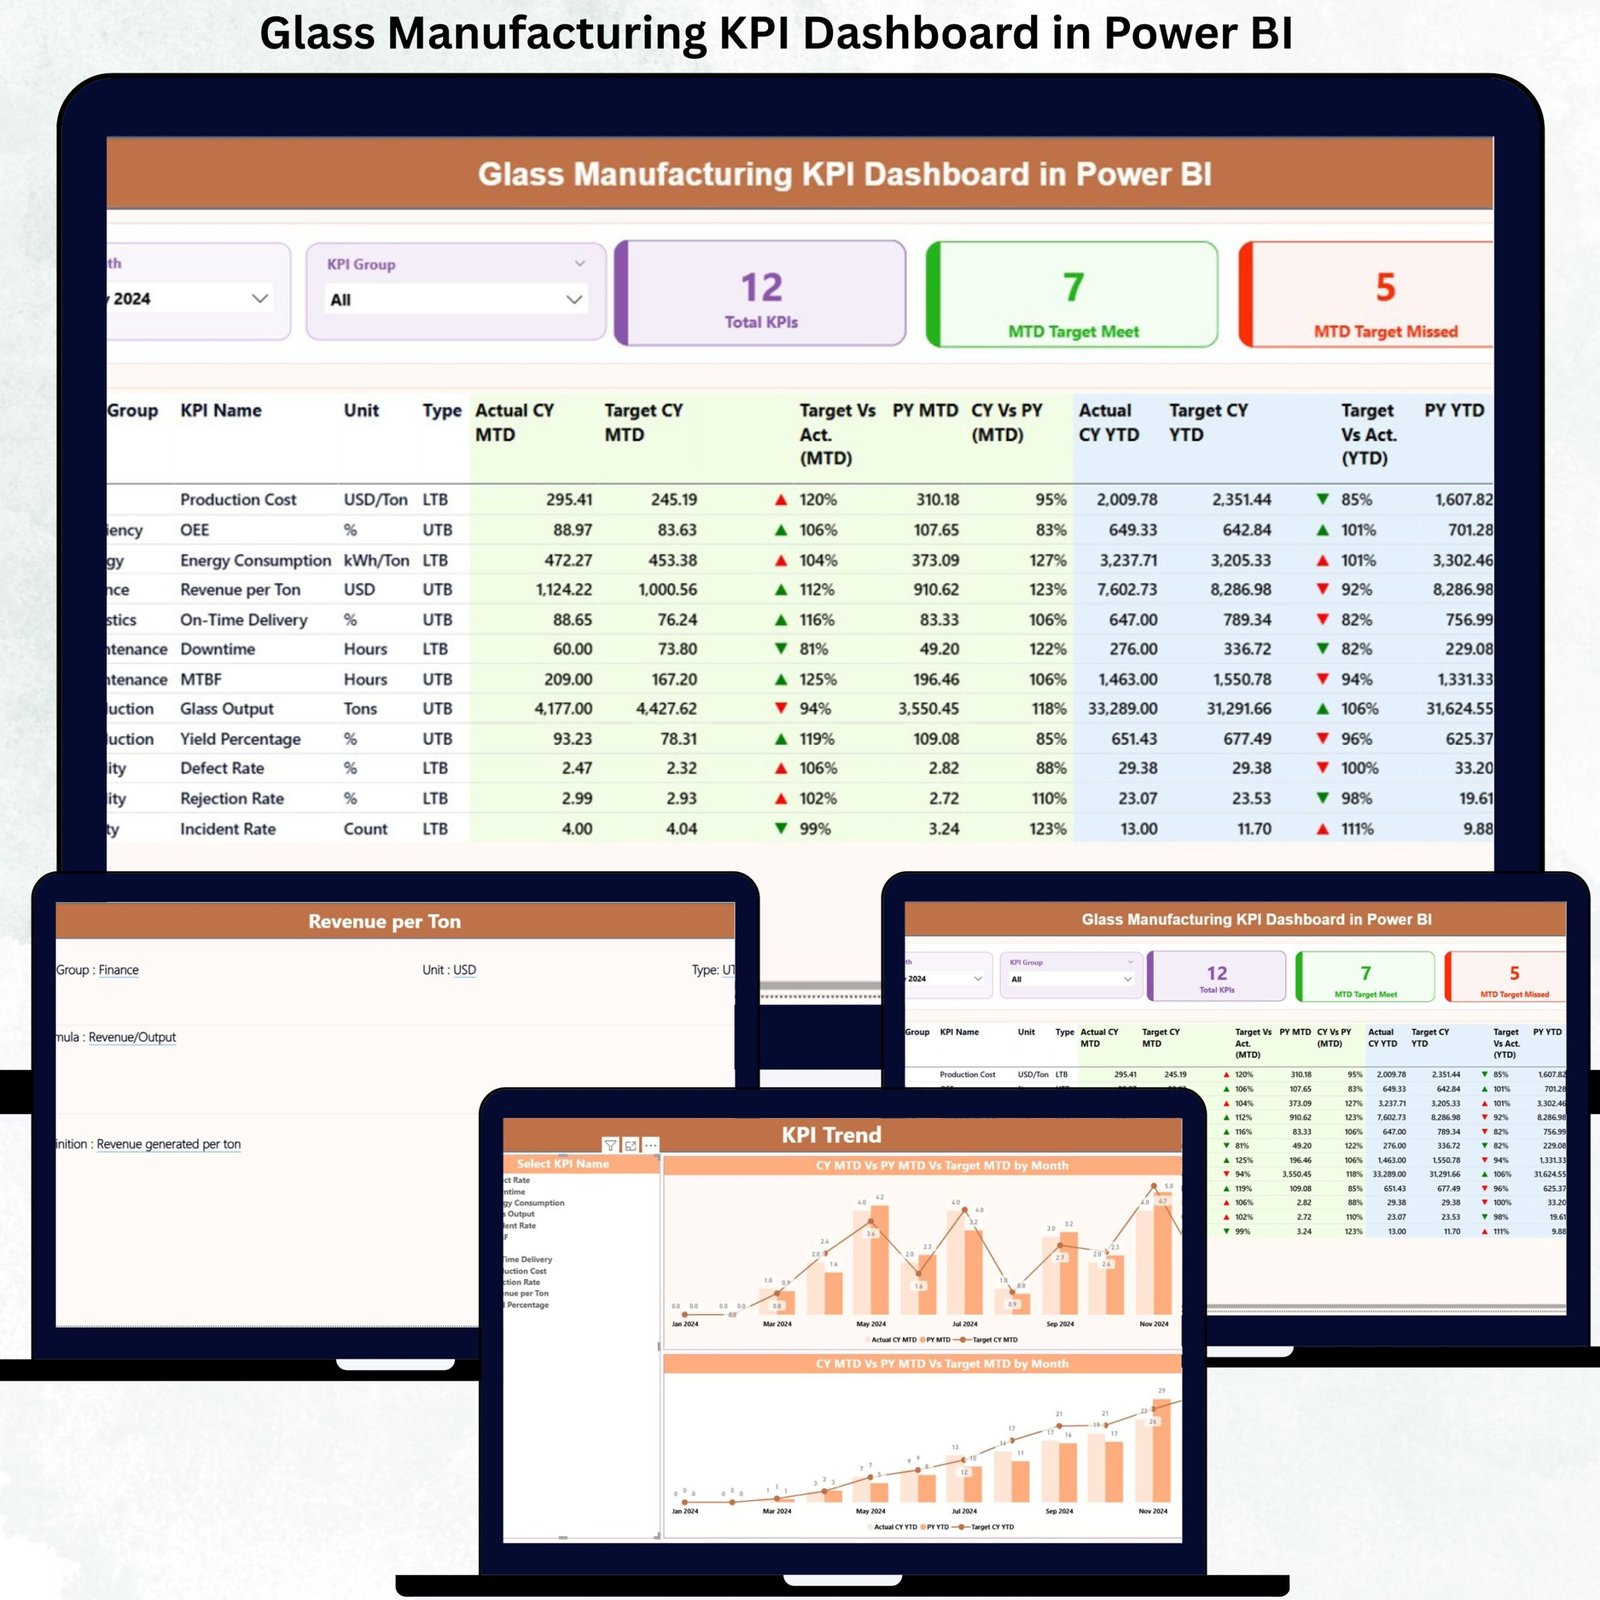
This ready-to-use dashboard helps glass manufacturers track, analyze, and optimize KPIs related to production efficiency, quality control, waste reduction, energy usage, and financial performance—all in one interactive Power BI file. Instead of spending hours compiling reports, teams gain instant visibility into MTD and YTD performance, allowing faster and smarter decision-making.
Built with Excel as the data source and Power BI as the visualization layer, this dashboard remains practical, scalable, and easy to maintain—without requiring advanced technical skills.
🚀 Key Features of Glass Manufacturing KPI Dashboard in Power BI
📊 Centralized KPI Monitoring
Track all production, quality, and operational KPIs in one interactive Power BI dashboard instead of multiple disconnected files.
📅 Dynamic Month & KPI Group Slicers
Analyze performance by selecting specific months or KPI categories instantly—no manual filtering required.
📈 MTD & YTD Performance Tracking
Monitor Month-to-Date and Year-to-Date actuals, targets, and previous year values side by side.
🚦 Visual Performance Indicators
Automatic green/red arrows and icons clearly highlight target achievements and missed KPIs.
📉 Trend-Based Analysis
Compare Actual vs Target vs Previous Year using interactive combo charts for deeper insights.
📘 Built-in KPI Definitions
Ensure KPI clarity with a dedicated definition page containing formulas, descriptions, and KPI types.
🔄 Excel-Driven Data Entry
Update KPI data easily in Excel without complex Power BI modeling or scripting.
📐 Scalable & Customizable Design
Add new KPIs, plants, or categories as your business grows.
📦 What’s Inside the Glass Manufacturing KPI Dashboard in Power BI
This dashboard includes three well-structured Power BI pages, each designed for a specific analytical purpose:
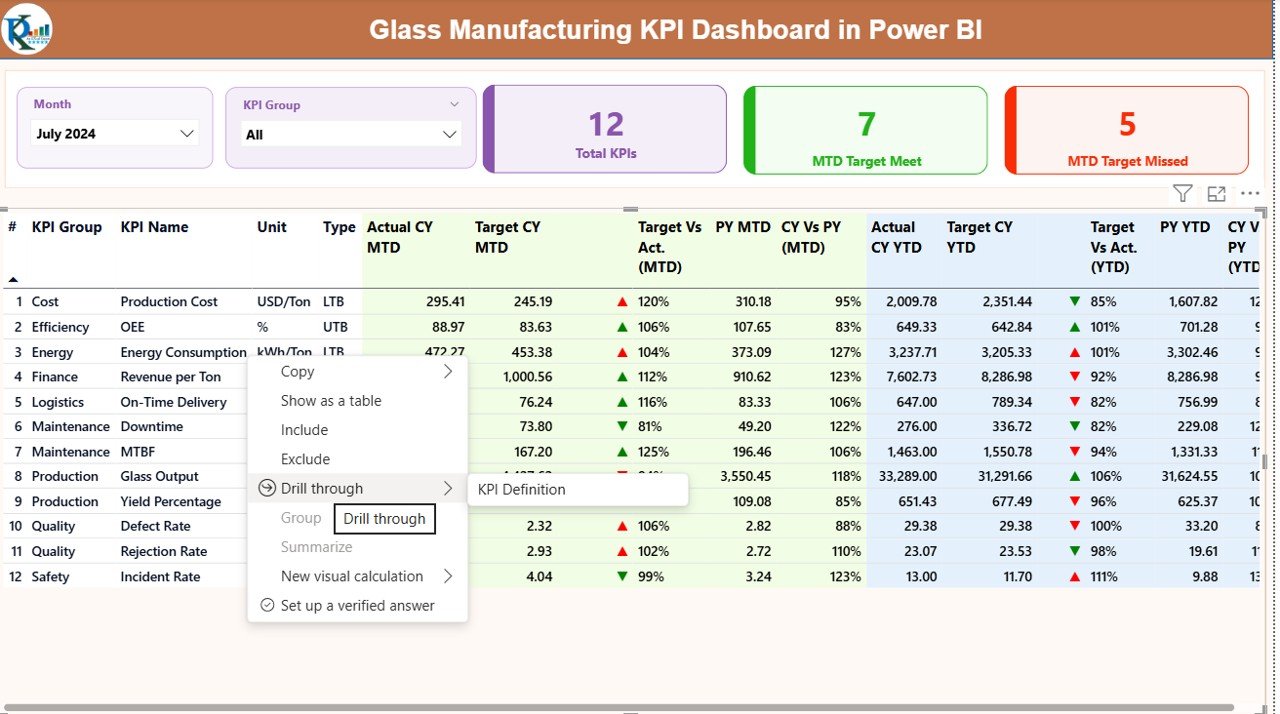
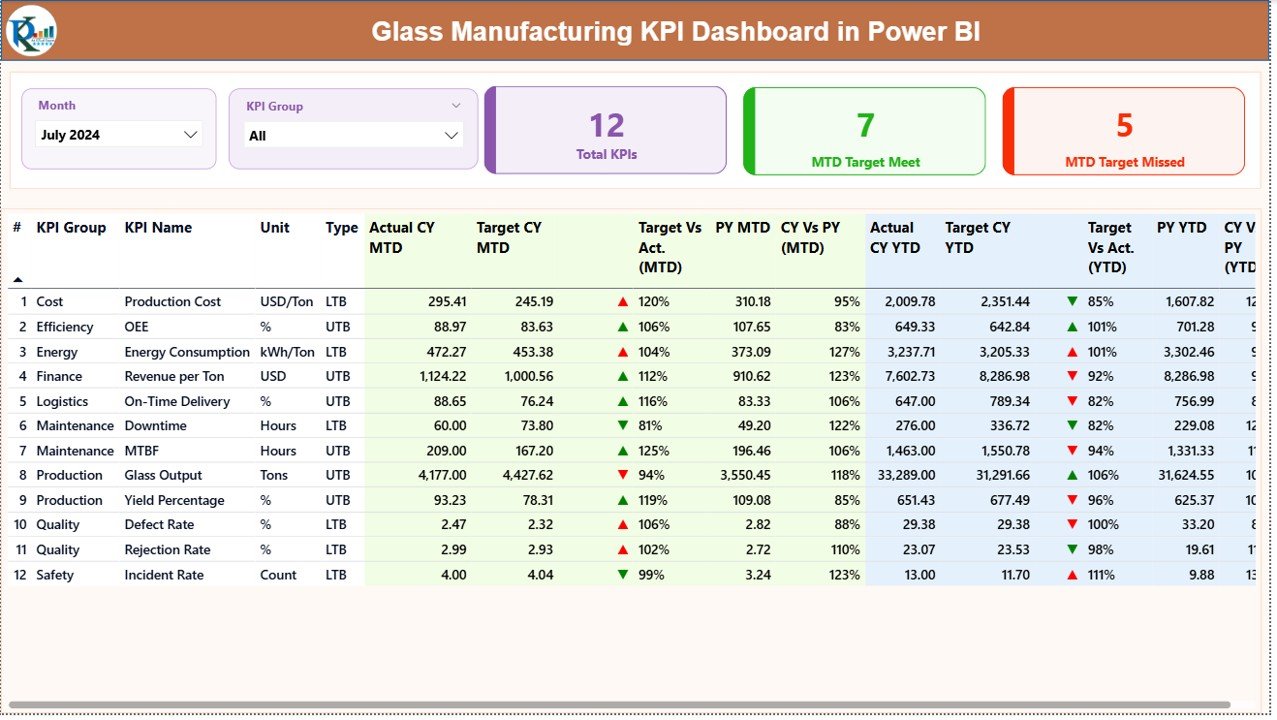
🧩 Summary Page
Acts as the control center with:
-
Month and KPI Group slicers
-
KPI cards showing Total KPIs, Target Met, and Target Missed
-
A detailed KPI table with MTD & YTD performance, icons, and CY vs PY comparisons
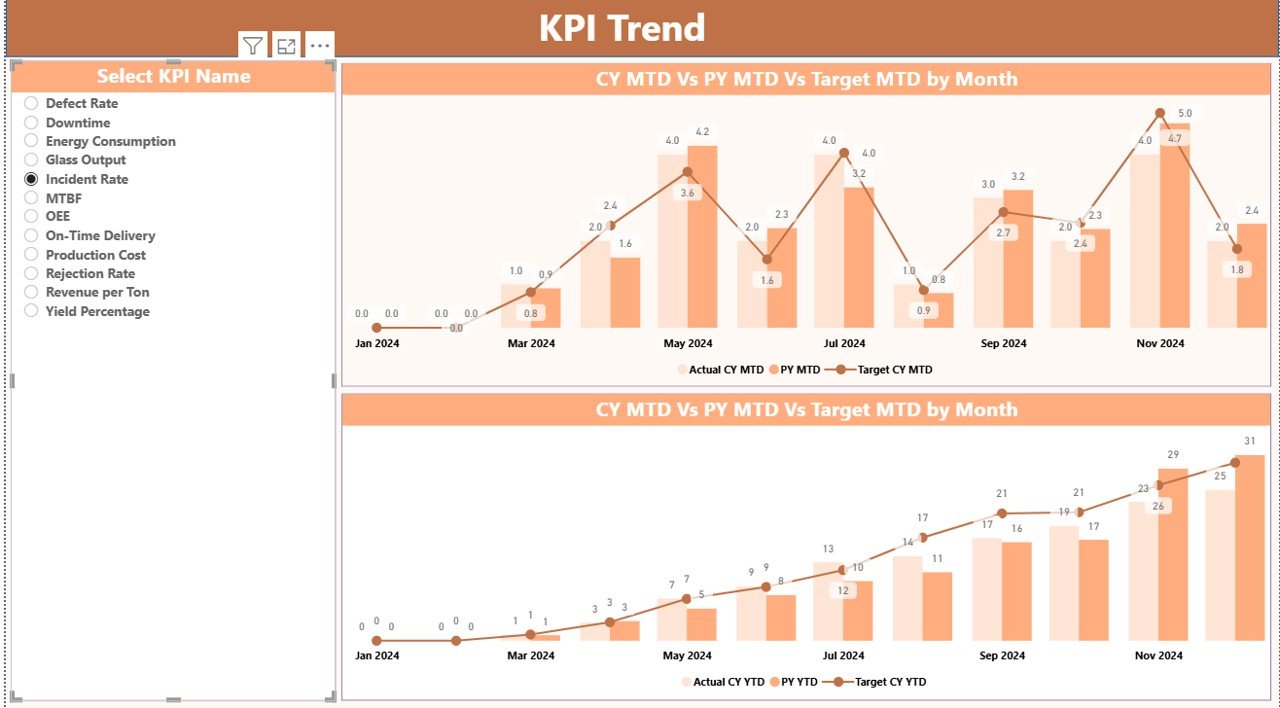
📊 KPI Trend Page
Focuses on time-based analysis with:
-
KPI Name slicer
-
MTD Actual vs Target vs PY chart
-
YTD Actual vs Target vs PY chart
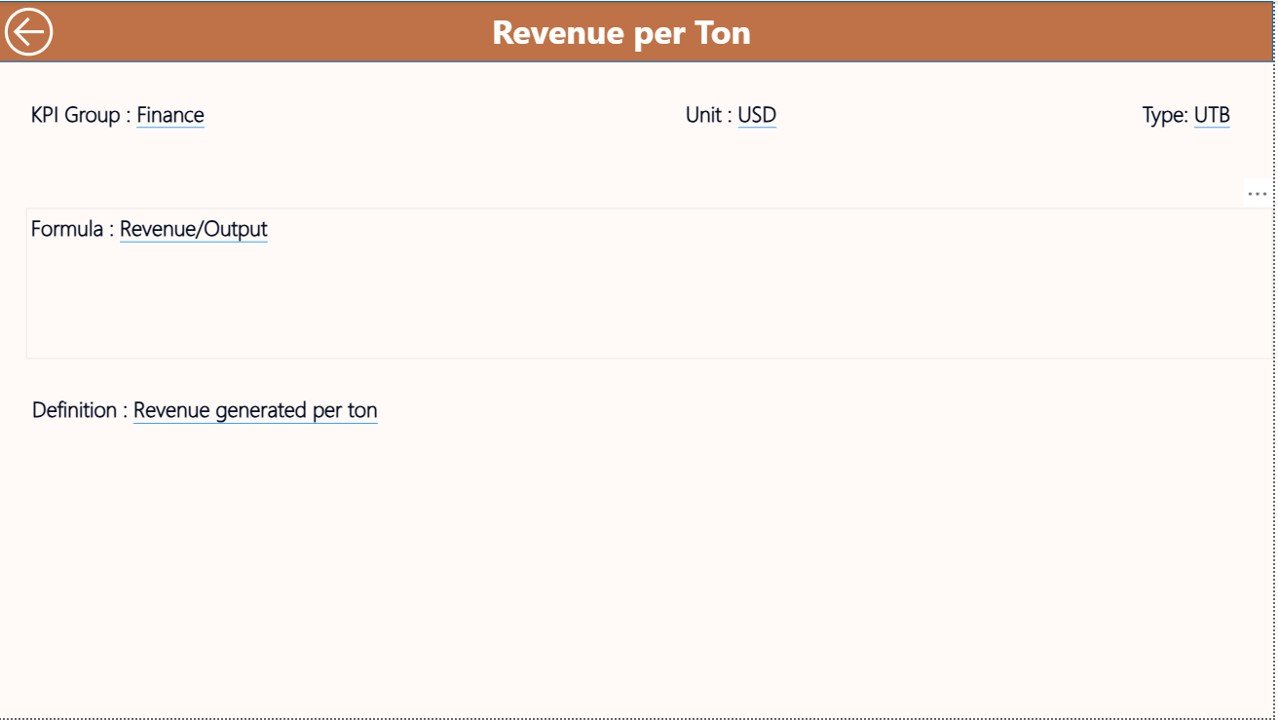
📘 KPI Definition Page
A drill-through reference page displaying:
-
KPI number, name, group, and unit
-
Formula and KPI definition
-
KPI type (UTB or LTB)
Additionally, the dashboard connects to three structured Excel sheets:
-
Input_Actual
-
Input_Target
-
KPI Definition
This setup ensures clean data, consistency, and audit-ready documentation.
🛠️ How to Use the Glass Manufacturing KPI Dashboard in Power BI
1️⃣ Enter actual and target KPI values in the Excel input sheets
2️⃣ Open the Power BI file and refresh the data
3️⃣ Use slicers to select Month and KPI Group
4️⃣ Review MTD and YTD performance instantly
5️⃣ Analyze trends and drill into KPI definitions when needed
Because the workflow is simple and intuitive, teams can start using the dashboard immediately—without training delays.
👥 Who Can Benefit from This Glass Manufacturing KPI Dashboard?
🏭 Glass Manufacturing Plant Managers
📊 Production & Operations Teams
🔍 Quality Assurance & Process Improvement Teams
⚡ Energy & Waste Management Teams
📈 Business Analysts & Strategy Teams
👔 Plant Heads & Executive Leadership
Anyone responsible for improving efficiency, quality, and profitability will find this dashboard extremely valuable.
Click here to read the Detailed blog post
Watch the step-by-step video tutorial:
Visit our YouTube channel to learn step-by-step video tutorials
👉 <a href=”https://www.youtube.com/@PKAnExcelExpert” target=”_blank”>YouTube.com/@PKAnExcelExpert</a>


Reviews
There are no reviews yet.