

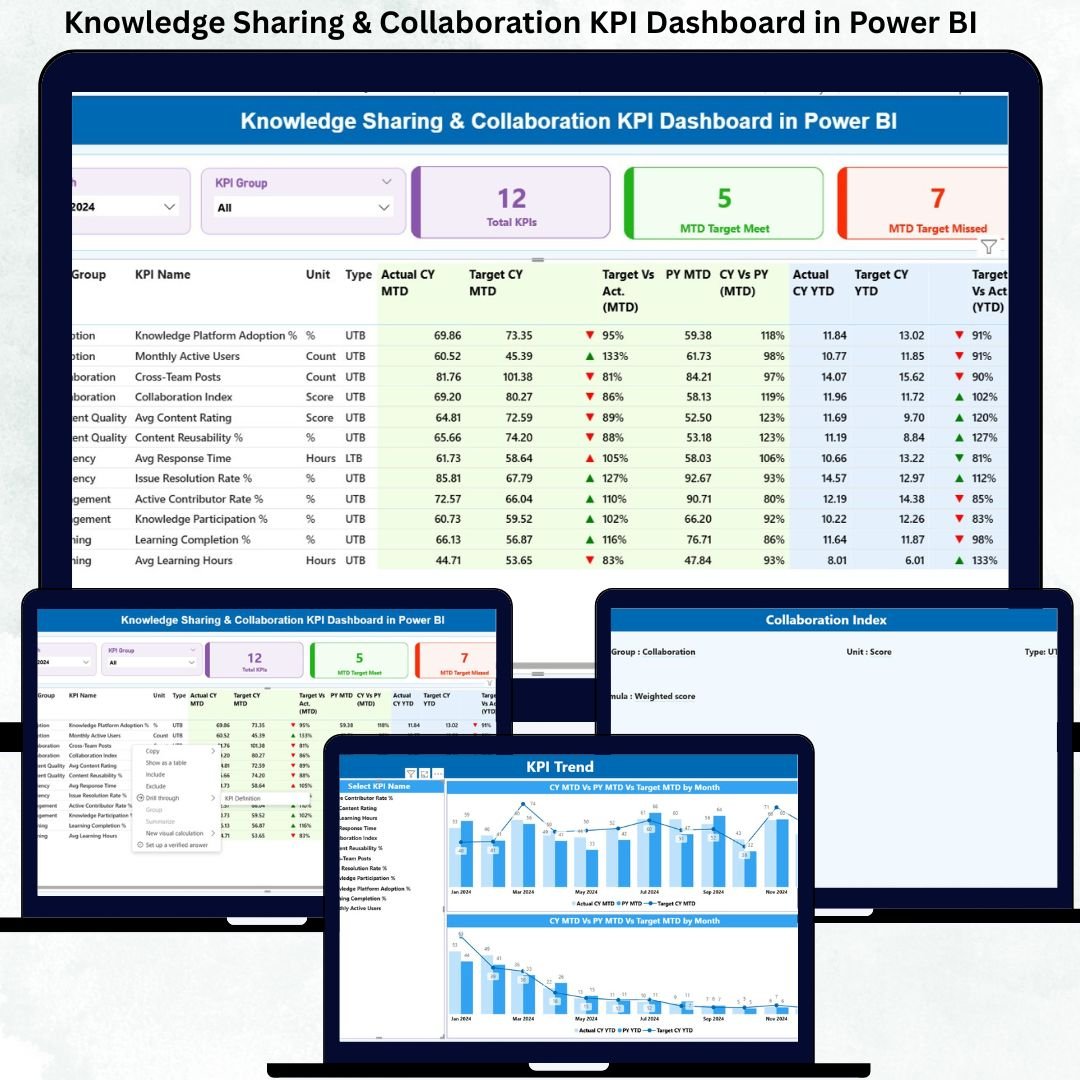

In today’s competitive digital workplace, knowledge sharing and collaboration are no longer optional—they are performance drivers. Teams that share insights faster, collaborate effectively, and reuse organizational knowledge consistently outperform others. However, most organizations still struggle to measure collaboration impact in a structured, data-driven way.
That is exactly where the Knowledge Sharing & Collaboration KPI Dashboard in Power BI becomes a game-changing solution 🚀.
This ready-to-use Power BI dashboard helps organizations track, analyze, and improve knowledge-sharing behavior using clearly defined KPIs, trends, and performance indicators. Instead of relying on assumptions, scattered reports, or subjective feedback, this dashboard converts collaboration data into clear visuals, comparisons, and actionable insights.
Designed with simplicity and business impact in mind, the dashboard connects seamlessly with Excel and transforms raw data into a powerful decision-making tool for leaders, HR teams, and knowledge managers.
🔑 Key Features of Knowledge Sharing & Collaboration KPI Dashboard in Power BI
📊 Centralized KPI Monitoring
Track all knowledge sharing and collaboration KPIs in one interactive Power BI dashboard.
📅 MTD & YTD Performance Tracking
Monitor Month-to-Date and Year-to-Date performance for better operational and strategic control.
🎯 Target vs Actual Analysis
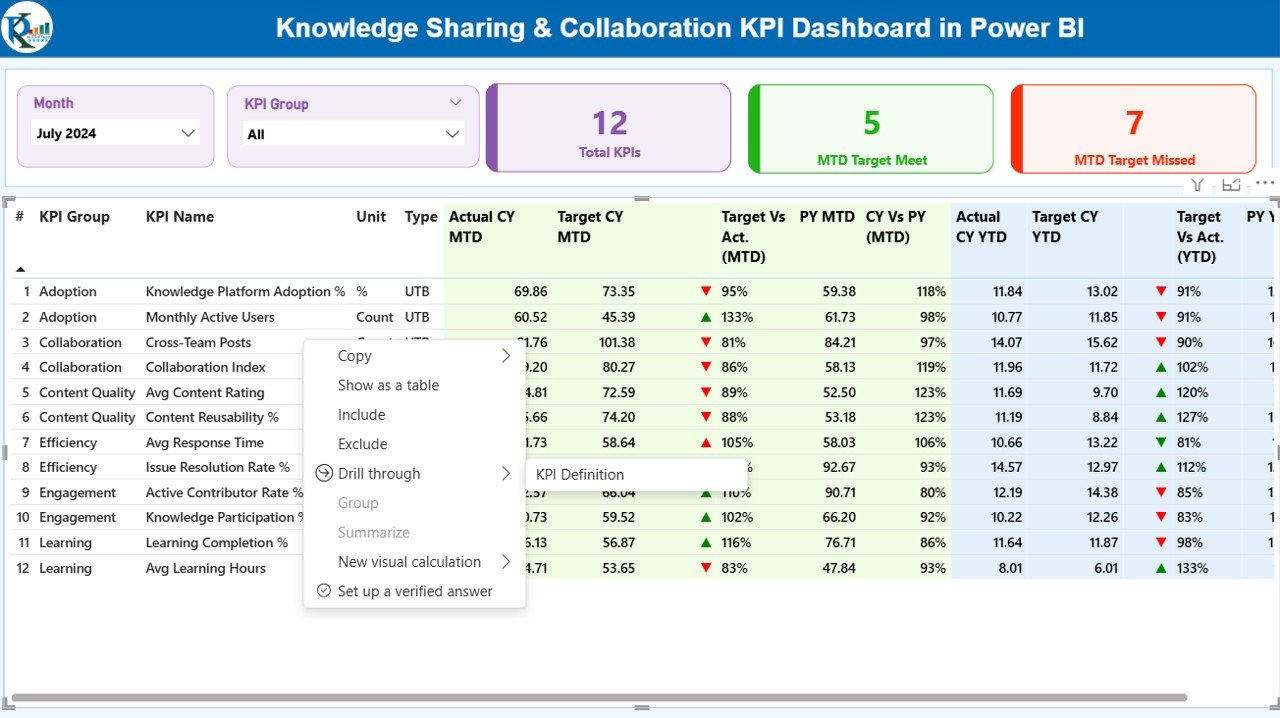
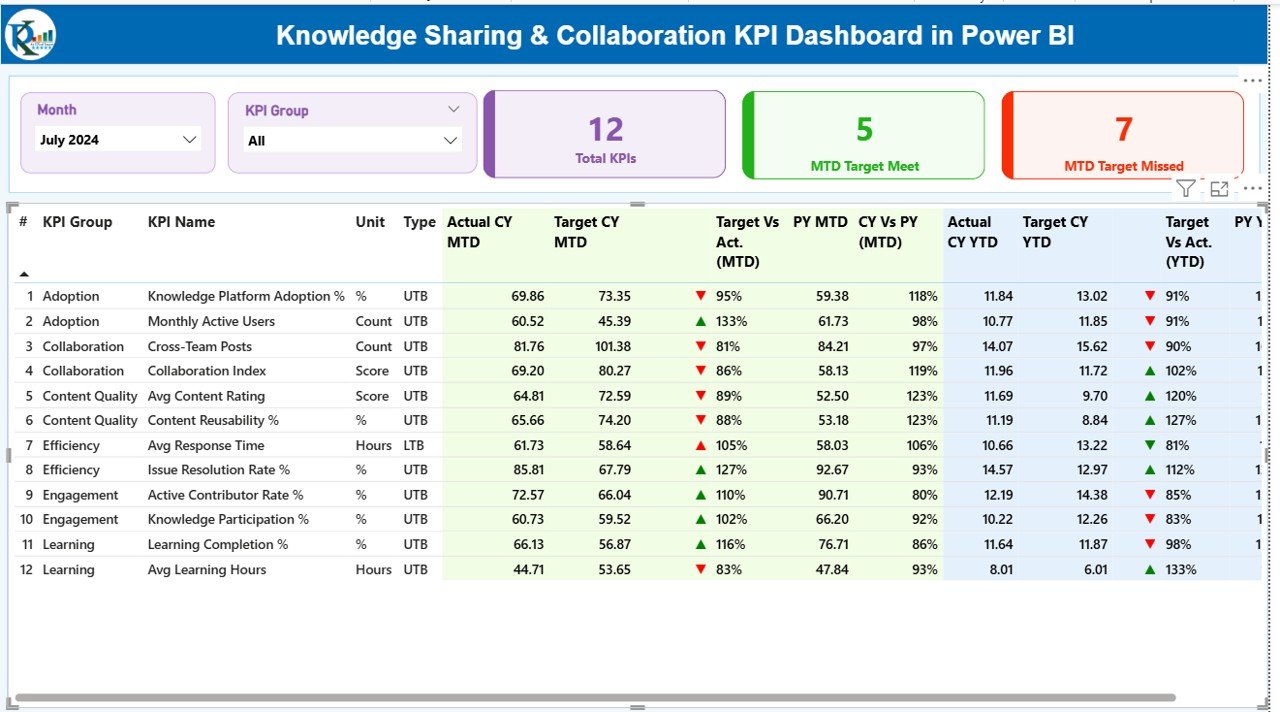
Instantly identify KPIs that meet or miss targets using visual indicators and icons.
📈 Current Year vs Previous Year Comparison
Analyze collaboration improvement trends with CY vs PY comparisons.
🎛️ Interactive Slicers
Filter data by Month and KPI Group to focus on specific insights.
📋 Detailed KPI-Level Table
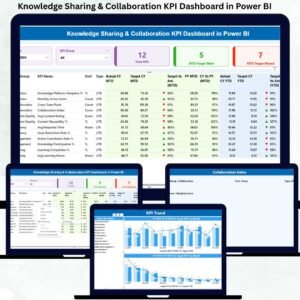
View KPI number, group, unit, type (LTB/UTB), actuals, targets, variance, and trend indicators in one structured table.
📉 Trend Analysis Page
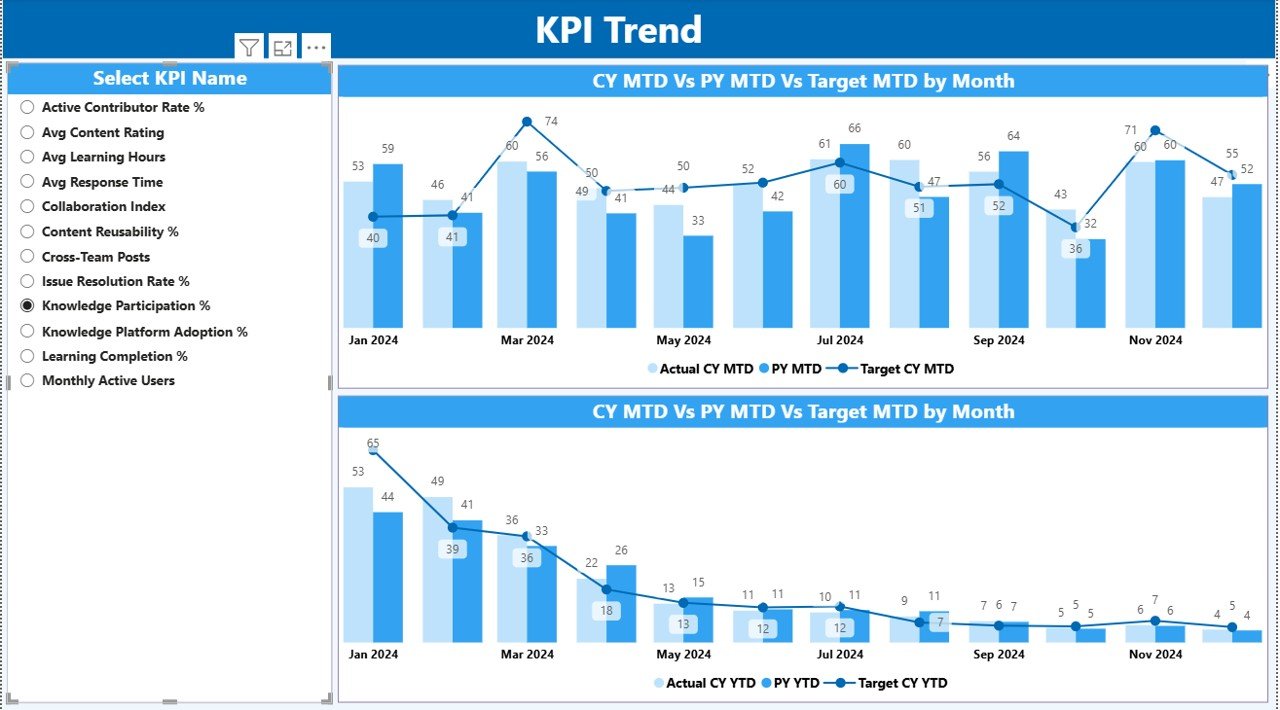
Visualize KPI performance over time using combo charts for deeper understanding.
📘 KPI Definition Drill-Through
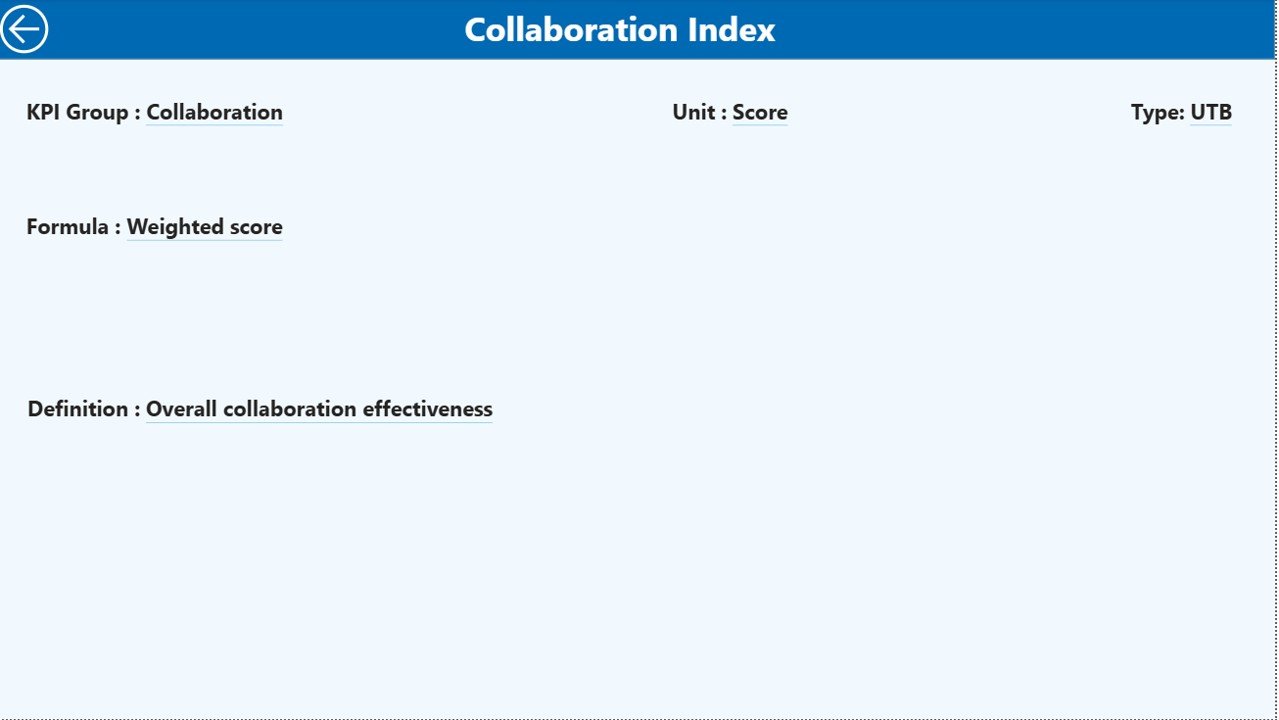
Access clear KPI formulas and definitions to avoid confusion and ensure consistency.
📦 What’s Inside the Knowledge Sharing & Collaboration KPI Dashboard
🗂️ Power BI Desktop File (.pbix)
Fully designed, interactive, and ready-to-use dashboard.
📊 Excel Input File
Structured sheets for Actual, Target, and KPI Definition data.
📄 Three Dashboard Pages
Summary Page – Overall KPI status with cards, slicers, and detailed table
KPI Trend Page – MTD & YTD trend analysis with CY, PY, and Target comparisons
KPI Definition Page – Drill-through view with formulas and explanations
🔄 Automated Calculations
All KPIs, comparisons, and icons update automatically after data refresh.
⚙️ How to Use the Knowledge Sharing & Collaboration KPI Dashboard
1️⃣ Enter Actual values in the Excel Input_Actual sheet
2️⃣ Enter Target values in the Excel Input_Target sheet
3️⃣ Update or manage KPIs using the KPI Definition sheet
4️⃣ Refresh the Power BI dashboard
5️⃣ Instantly view updated KPIs, trends, and insights
No advanced Power BI skills are required. Even non-technical users can maintain and use this dashboard effortlessly.
👥 Who Can Benefit from This Knowledge Sharing & Collaboration KPI Dashboard
✅ HR & L&D Teams
Measure learning participation and knowledge contribution.
✅ Knowledge Management Teams
Track content creation, reuse, and engagement metrics.
✅ Project Managers
Monitor cross-team collaboration effectiveness.
✅ Department Heads
Identify collaboration gaps and improvement areas.
✅ Senior Leadership
Make data-driven decisions to strengthen collaboration culture.
Because of its flexible design, this dashboard is suitable for small teams, growing organizations, and large enterprises alike.
Click here to read the Detailed blog post
Watch the step-by-step video tutorial:
Visit our YouTube channel to learn step-by-step video tutorials and practical dashboard walkthroughs.
Compatibility and Requirements
- Works in Power BI Desktop, which is free to download. Microsoft explains the install in Get Power BI Desktop.
- Your Actual, Target and KPI Definition data lives in an Excel input file that comes with the dashboard.
Frequently Asked Questions
What do I get in the download?
A Power BI Desktop file (.pbix) and an Excel input file with sheets for Actual, Target and KPI Definition data. The dashboard has three pages: Summary, KPI Trend and KPI Definition.
Where do I enter my numbers?
Enter actual values in the Input_Actual sheet and target values in the Input_Target sheet of the Excel file. Update KPIs in the KPI Definition sheet, then refresh the dashboard in Power BI.
Can I filter the dashboard by month?
Yes. Slicers on the Summary page filter by Month and KPI Group.
Does it compare this year with last year?
Yes. The dashboard shows Month-to-Date and Year-to-Date results against targets, and compares the current year with the previous year.
Is there an Excel version?
Yes. See the Knowledge Sharing & Collaboration KPI Dashboard in Excel.
Related Knowledge Management Templates
- Knowledge Sharing & Collaboration KPI Dashboard in Excel: the same KPIs in Excel
- Knowledge Sharing KPI Dashboard in Google Sheets: a Google Sheets version for knowledge sharing
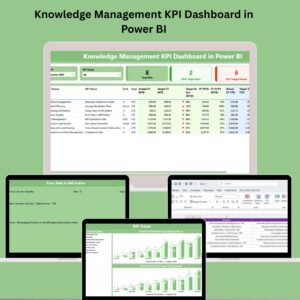
- Knowledge Management KPI Dashboard in Power BI: another Power BI KPI dashboard on knowledge management
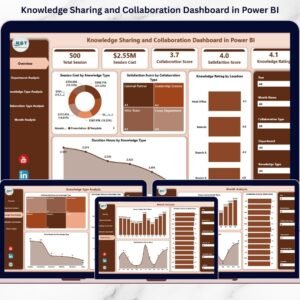
- Knowledge Sharing and Collaboration Dashboard in Power BI: a related Power BI dashboard on the same topic
- Power BI Dashboard Mega Collection: 15 Power BI templates in one download
Browse all Power BI KPI dashboards.
























Reviews
There are no reviews yet.