Port operations form the backbone of global trade and logistics. Every day, ports manage vessel arrivals, cargo handling, yard utilization, equipment productivity, and turnaround schedules. Port Operations KPI Dashboard in Excel However, when operational data remains scattered across multiple spreadsheets and manual reports, port authorities struggle to identify delays, bottlenecks, and efficiency gaps in time.
Port Operations KPI Dashboard in Excel That is exactly why the Port Operations KPI Dashboard in Excel becomes a powerful, practical, and must-have operational analytics tool.
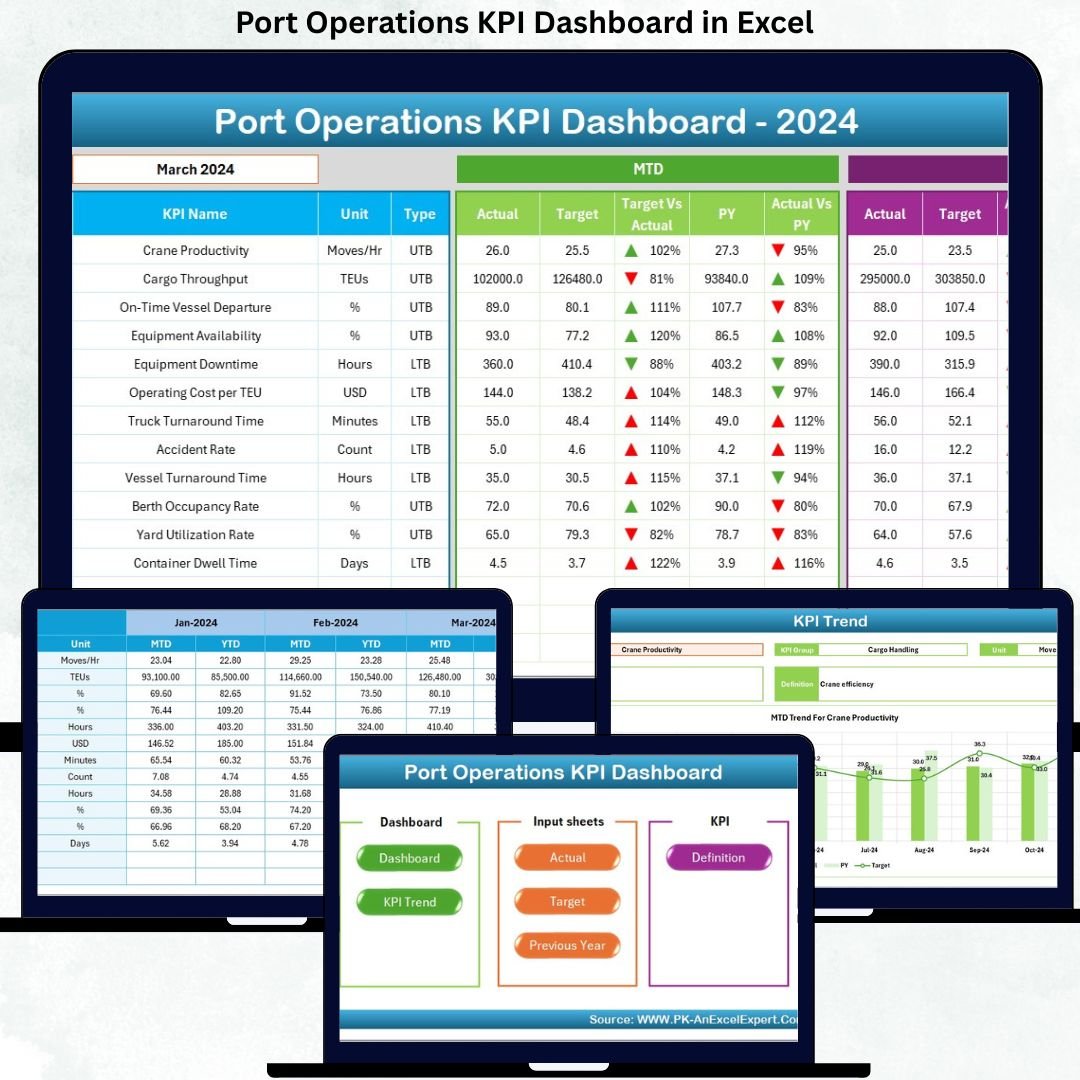
Port Operations KPI Dashboard in Excel This ready-to-use Excel dashboard transforms raw port operations data into clear KPIs, performance comparisons, and trend analysis, allowing port managers and operations teams to monitor performance with confidence. Instead of spending hours compiling reports, users gain instant visibility into MTD and YTD performance, target achievement, and historical trends—all in one structured Excel file.
Most importantly, this dashboard is built entirely in Microsoft Excel, making it cost-effective, easy to maintain, and suitable for ports of any size.
## 🚢 Key Features of Port Operations KPI Dashboard in Excel
📊 Centralized KPI Monitoring – Track all port operation KPIs in a single Excel dashboard
📅 Month Selection Control – Instantly analyze performance by selected month
🎯 MTD & YTD Performance Tracking – Monitor short-term execution and long-term trends
📈 Target vs Actual Comparison – Identify performance gaps using visual indicators
🔄 Previous Year Comparison – Evaluate growth or decline year-over-year
📉 Trend Analysis – Understand KPI behavior over time using MTD and YTD charts
📌 KPI Definition & Formula Visibility – Maintain standardization and clarity
🧭 Easy Navigation – One-click navigation across dashboard pages
💻 100% Excel-Based Solution – No Power BI or additional software required
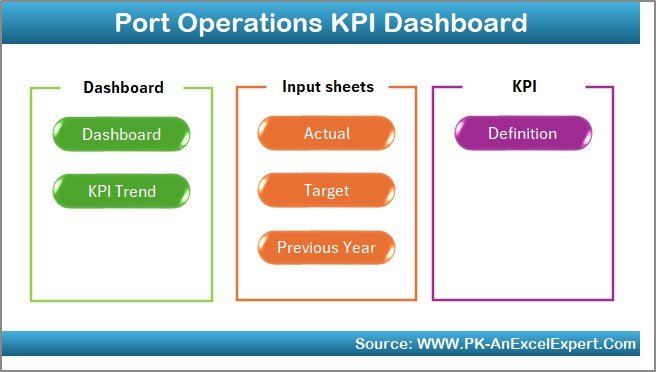
## 📂 What’s Inside the Port Operations KPI Dashboard?
You will receive a professionally designed Excel workbook with 7 structured worksheets, each serving a clear purpose.
📌 1. Home Sheet
A clean index page with 6 navigation buttons, allowing users to jump to any analysis page instantly.
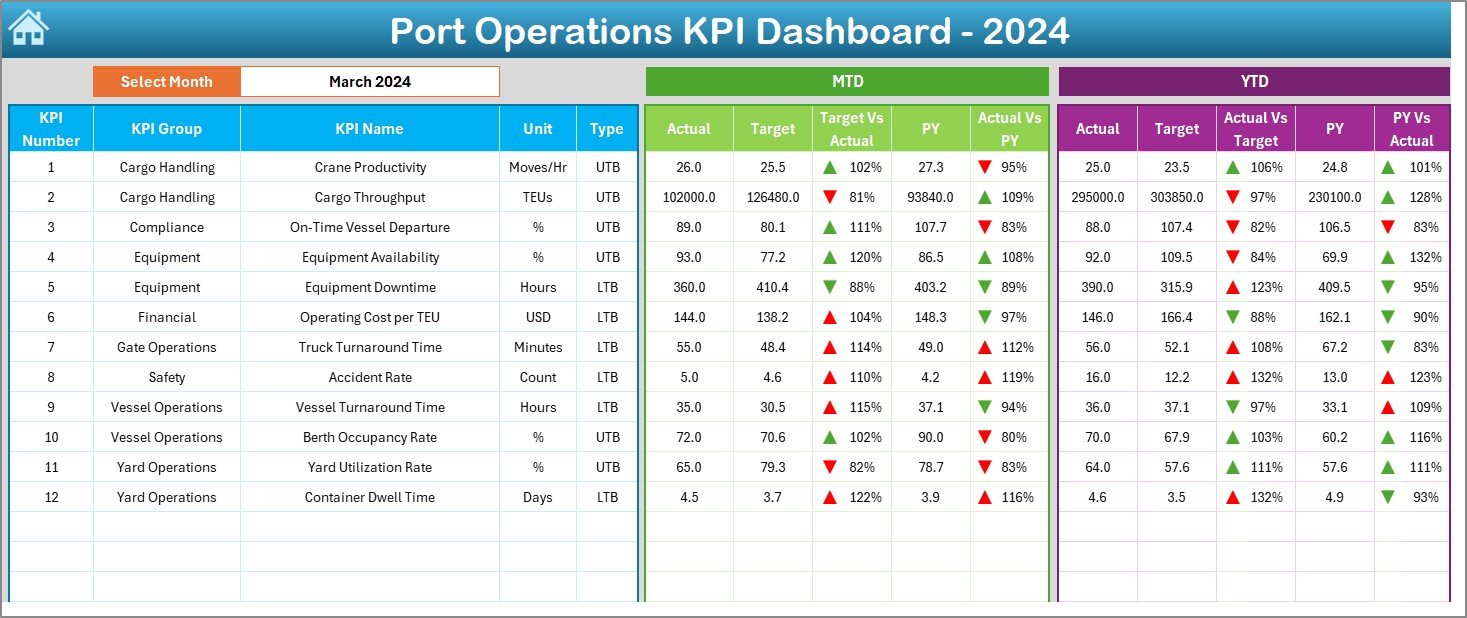
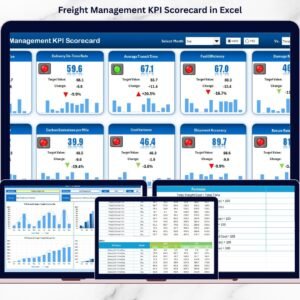
📌 2. Dashboard Sheet
The main performance overview page displaying:
-
Month selector (Cell D3)
-
MTD performance:
-
Actual, Target, Previous Year
-
Target vs Actual %
-
PY vs Actual %
-
-
YTD performance:
-
Actual, Target, Previous Year
-
Target vs Actual %
-
PY vs Actual %
-
-
Visual ▲ / ▼ arrows with conditional formatting for quick insights
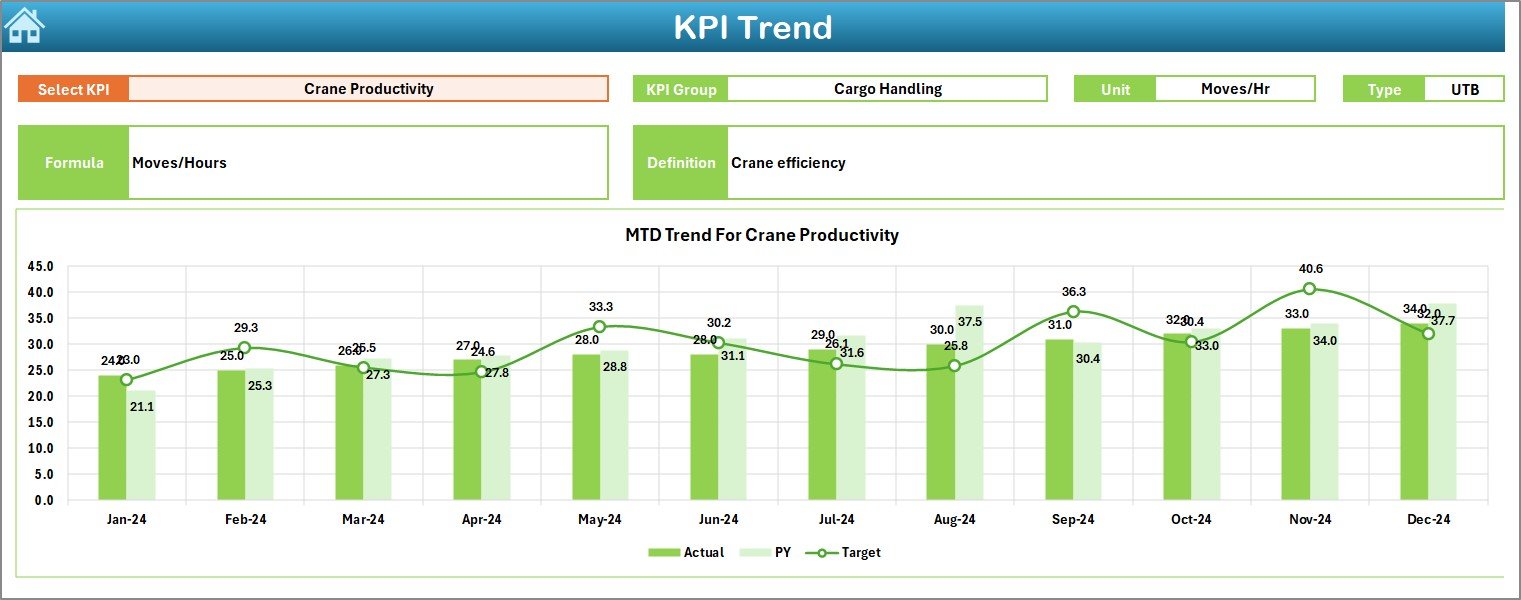
📌 3. KPI Trend Sheet
A detailed trend analysis page with:
-
KPI selection dropdown (Cell C3)
-
KPI Group, Unit, Type (LTB / UTB)
-
KPI Formula & Definition
-
MTD Trend Chart (Actual, Target, PY)
-
YTD Trend Chart (Actual, Target, PY)
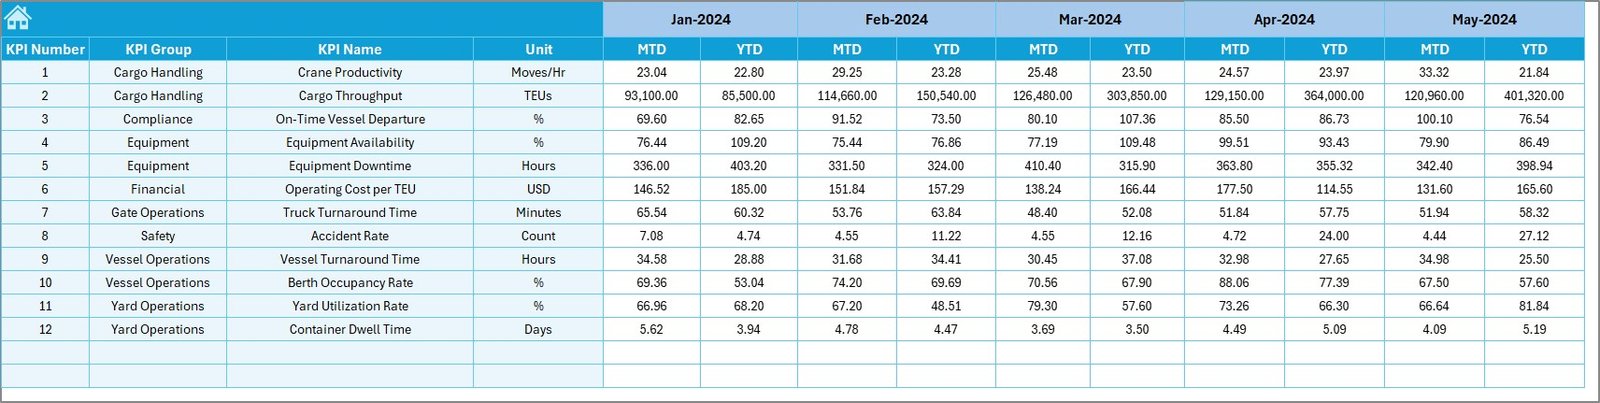
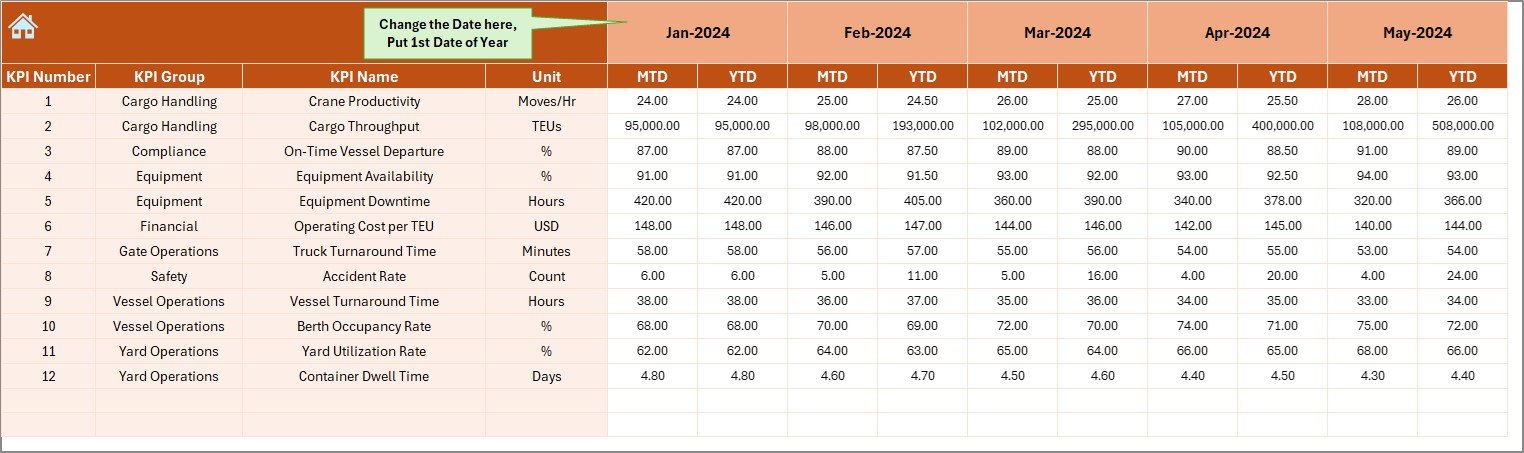
📌 4. Actual Numbers Input Sheet
Enter real operational performance values:
-
MTD Actual
-
YTD Actual
-
Reporting month selection
📌 5. Target Sheet
Define planned performance:
-
MTD Targets
-
YTD Targets
-
Month-wise target planning
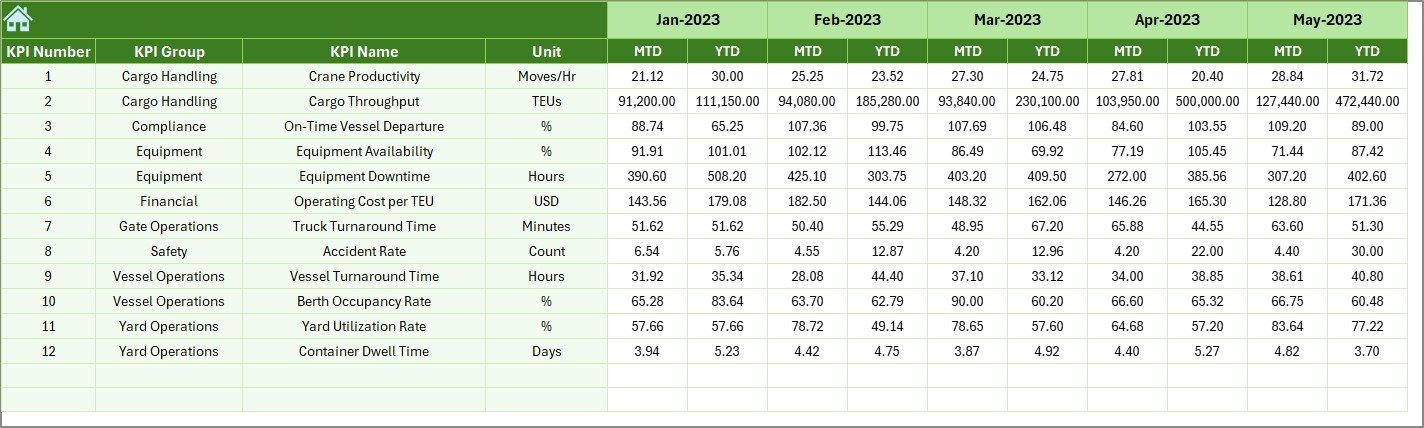
📌 6. Previous Year Number Sheet
Capture historical performance to enable:
-
Year-over-year comparison
-
Trend validation
-
Realistic target setting
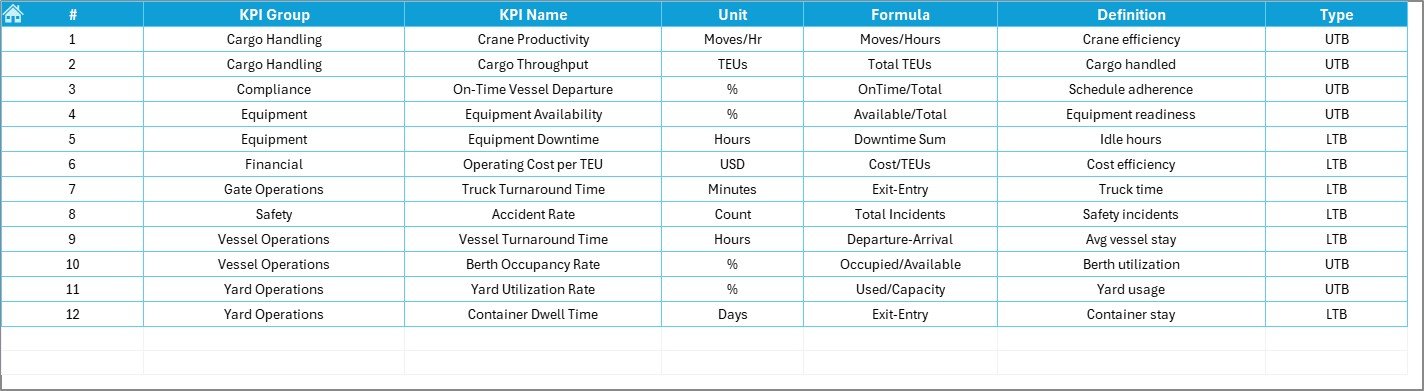
📌 7. KPI Definition Sheet
Maintain KPI governance with:
-
KPI Name
-
KPI Group
-
Unit
-
Formula
-
Definition
## 🧭 How to Use the Port Operations KPI Dashboard
1️⃣ Enter Actual values in the Actual Numbers Input sheet
2️⃣ Define Targets in the Target sheet
3️⃣ Update Previous Year data
4️⃣ Select the reporting month
5️⃣ Review MTD, YTD, and trend insights instantly
No advanced Excel skills required.
## 👥 Who Can Benefit from This Dashboard?
This dashboard is ideal for:
⚓ Port Authorities
🚢 Terminal Managers
📊 Operations & Planning Teams
📈 Strategy & Performance Analysts
🚛 Logistics & Supply Chain Teams
🏗️ Small Ports & Large Multi-Terminal Operations


Reviews
There are no reviews yet.