

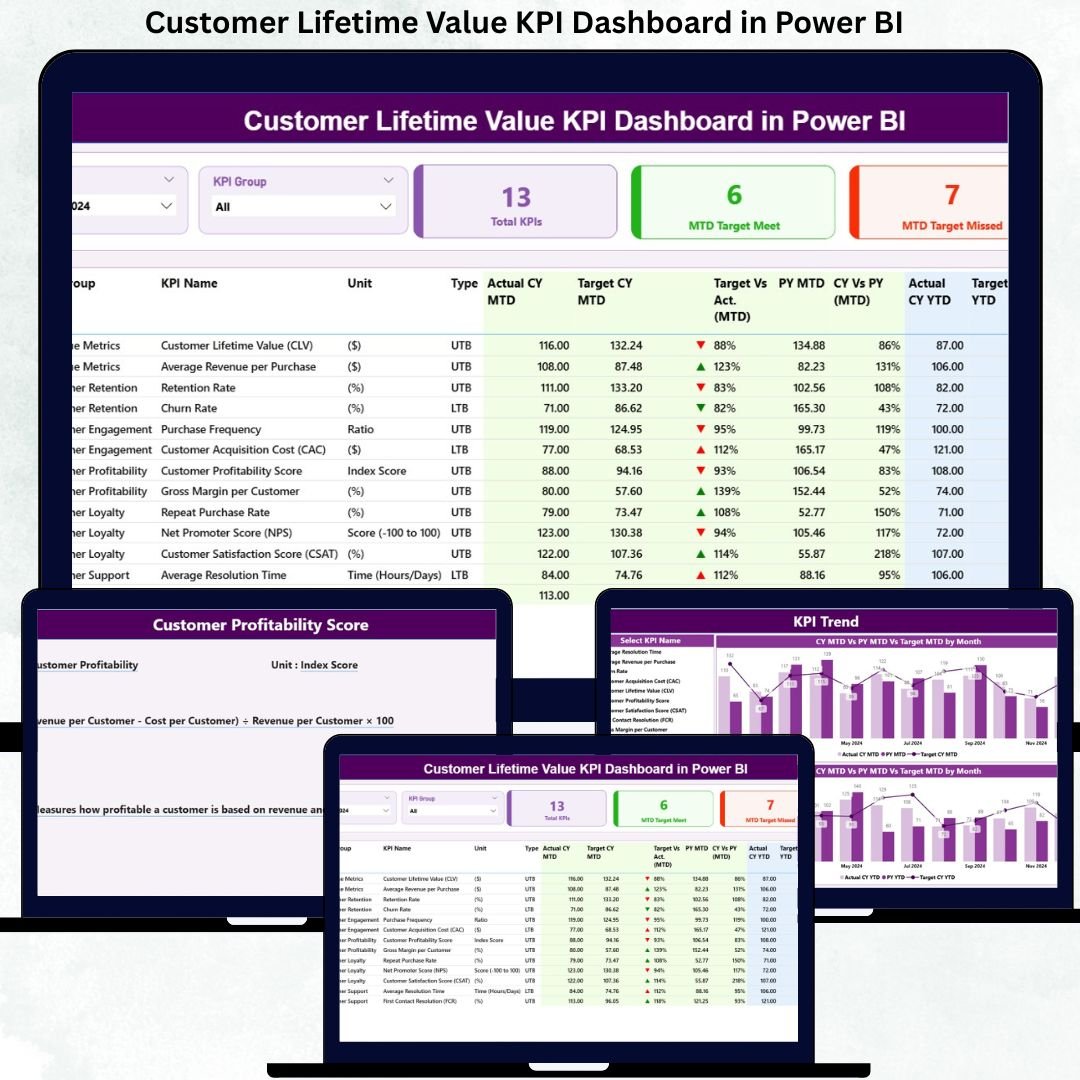


Acquiring customers is important, but retaining profitable Customer Lifetime Value KPI Dashboard in Power BI is what truly drives long-term business growth. Many organizations still focus heavily on leads and conversions, while ignoring the real metric that defines sustainable success—Customer Lifetime Value (CLV). When CLV data stays scattered across Excel files, CRM exports, and static reports, teams struggle to see the full picture.
That is exactly why the Customer Lifetime Value KPI Dashboard in Power BI becomes a game-changing solution 🚀.
This ready-to-use Power BI dashboard helps businesses track, monitor, and improve customer value performance using structured KPIs, targets, trends, and comparisons—all from one interactive dashboard. Instead of guessing which customers are profitable or which strategies work best, decision-makers gain clear, data-driven insights.
Because this dashboard uses Excel for data input and Power BI for visualization, it remains flexible, scalable, and business-friendly for organizations of any size.
⭐ Key Features of Customer Lifetime Value KPI Dashboard in Power BI
This dashboard is designed for real business use, not just reporting.
📊 Centralized KPI Monitoring – Track all CLV-related KPIs in one place
📅 MTD & YTD Performance Tracking – Analyze short-term and long-term results
🎯 Target vs Actual Comparison – Measure performance against goals
🔁 Previous Year Comparison – Identify growth or decline clearly
🚦 Performance Indicators – Green ▲ and red ▼ icons for instant clarity
📈 Interactive Trend Analysis – Visual MTD & YTD performance trends
📁 Excel-Based Data Input – Easy updates without technical skills
📦 What’s Inside the Customer Lifetime Value KPI Dashboard in Power BI
This dashboard includes three well-structured analytical pages, each designed for a specific purpose.
🏠 Summary Page – Complete CLV Performance Overview
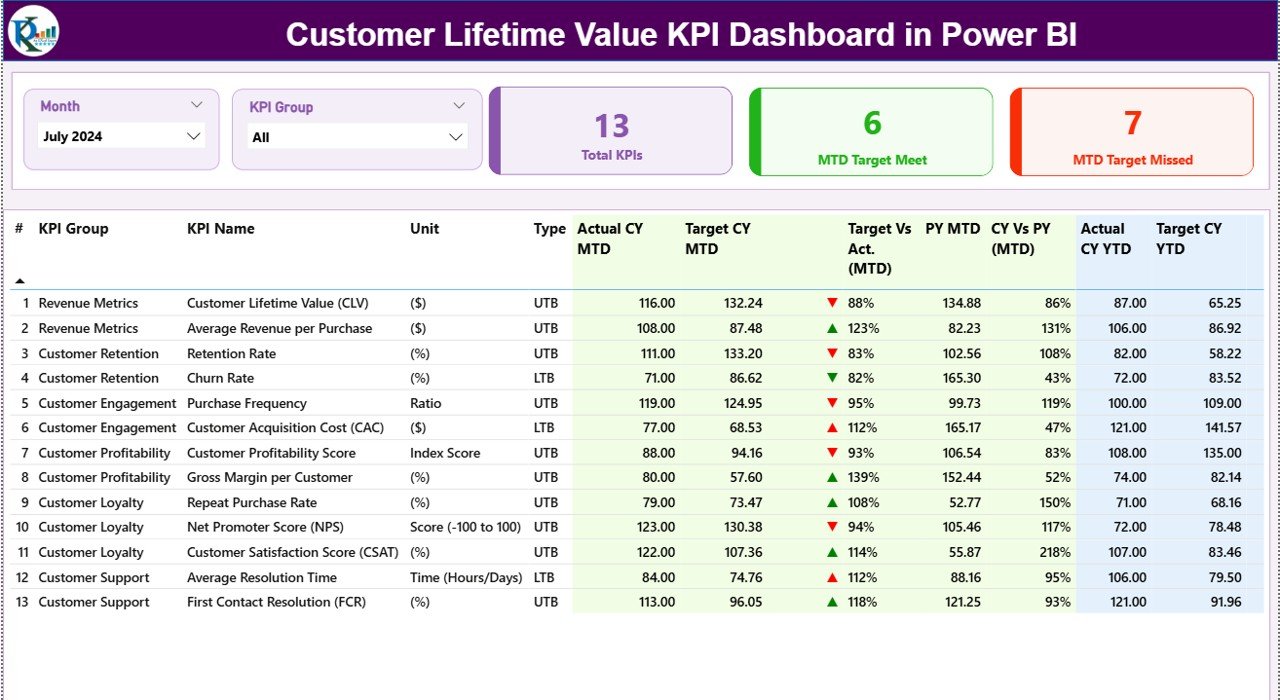
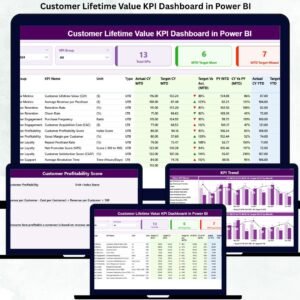
The Summary Page acts as the control panel of the dashboard.
🎛 Top Section – Slicers & KPI Cards
At the top, users can filter data using:
📅 Month Slicer
🗂 KPI Group Slicer
Additionally, three KPI cards display:
✅ Total KPIs Count
🎯 MTD Target Met Count
⚠️ MTD Target Missed Count
These cards instantly show overall performance health.
📋 Detailed KPI Performance Table
The table displays:
KPI Number, Group, Name, Unit, Type (LTB / UTB)
MTD Actual, Target, Target vs Actual %, PY Comparison
YTD Actual, Target, Target vs Actual %, PY Comparison
As a result, users can evaluate monthly execution and long-term strategy from one screen.
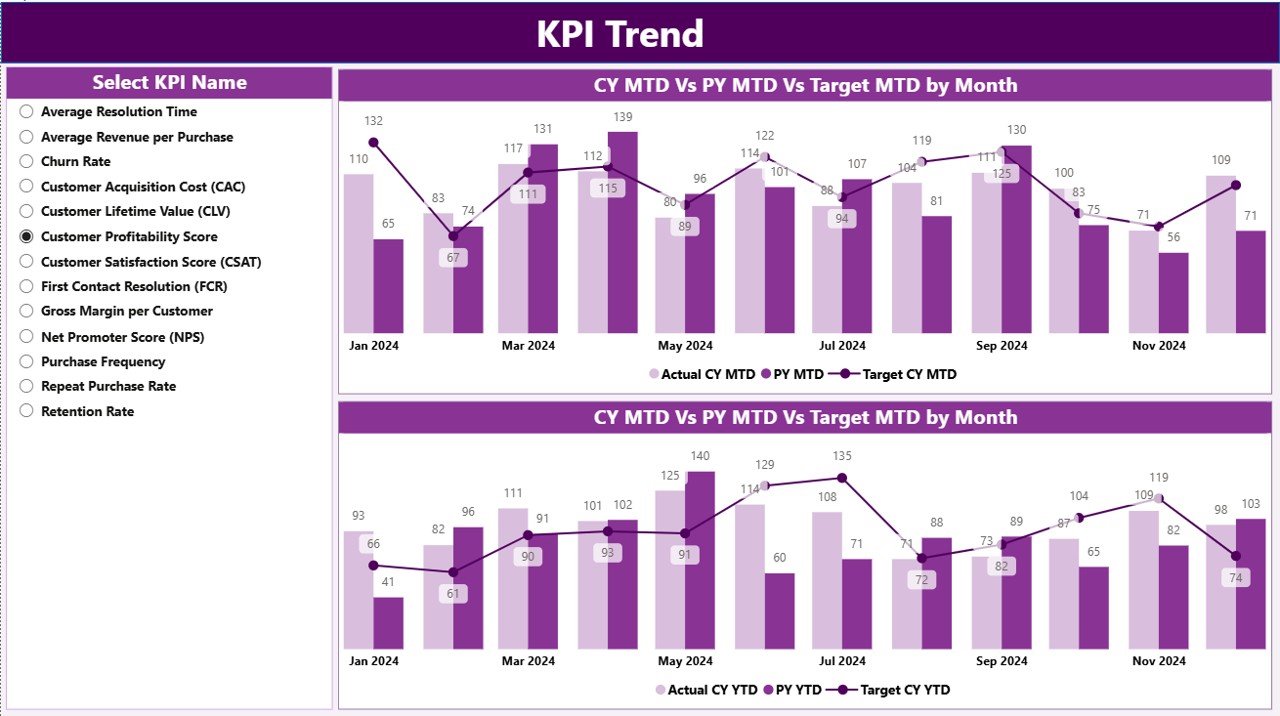
📈 KPI Trend Page – Performance Over Time
The KPI Trend Page focuses on historical and trend analysis.
🔍 What This Page Shows
📊 MTD Trend Chart – CY Actual vs PY vs Target
📊 YTD Trend Chart – CY Actual vs PY vs Target
🎛 KPI Name Slicer for focused analysis
This page helps teams:
Identify improving or declining KPIs
Validate whether initiatives are working
Forecast future customer value trends
📘 KPI Definition Page – Complete Metric Clarity
The KPI Definition Page acts as a drill-through reference.
🧠 Why This Page Matters
Explains KPI formulas
Defines business meaning
Clarifies LTB vs UTB logic
This page improves governance, transparency, and user confidence, especially for new stakeholders.
⚙️ How to Use the Customer Lifetime Value KPI Dashboard in Power BI
1️⃣ Enter actual values in Input_Actual Excel sheet
2️⃣ Enter targets in Input_Target Excel sheet
3️⃣ Maintain logic in KPI Definition sheet
4️⃣ Refresh Power BI report
5️⃣ Use slicers, icons, and trends to analyze performance
No advanced Power BI skills required.
👥 Who Can Benefit from This Dashboard
Sales Teams
Marketing Teams
Finance Teams
Customer Experience (CX) Teams
Business Analysts
Senior Leadership
Any team focused on customer profitability and retention benefits instantly.
### Click here to read the Detailed blog post
📺 Visit our YouTube channel to learn step-by-step video tutorials
👉 https://youtube.com/@PKAnExcelExpert
Watch the step-by-step video tutorial:
Compatibility and Requirements
- Works in Power BI Desktop, which is free to download. Microsoft explains how to get it in Get Power BI Desktop.
- You enter actual values, targets and KPI definitions in Excel sheets, then refresh the Power BI report.
Frequently Asked Questions
Which pages are included?
Three pages: Summary, KPI Trend and KPI Definition.
Where do I enter my data?
Enter actual values in the Input_Actual Excel sheet and targets in the Input_Target Excel sheet. Keep the KPI formulas and definitions in the KPI Definition sheet, then refresh the Power BI report.
Can I compare results with last year?
Yes. The Summary page shows MTD and YTD actuals, targets, Target vs Actual % and a previous year comparison for each KPI. Green and red icons show whether a KPI met its target.
How do I see the trend for one KPI?
Open the KPI Trend page and choose the KPI in the KPI Name slicer. The MTD and YTD charts show current year actual, previous year and target.
Is there an Excel or Google Sheets version?
Yes. See the Customer Lifetime Value KPI Dashboard in Excel and the Customer Lifetime Value KPI Dashboard in Google Sheets.
Related Customer KPI Templates
- Customer Lifetime Value KPI Dashboard in Excel: the same CLV KPIs in Excel
- Customer Lifetime Value KPI Dashboard in Google Sheets: the Google Sheets edition
- Customer Engagement KPI Dashboard in Power BI: engagement KPIs in Power BI
- Customer Service KPI Dashboard in Power BI: service KPIs in Power BI
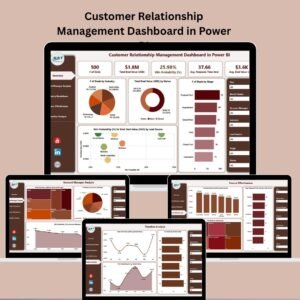
- Customer Relationship Management Dashboard in Power BI: a CRM view in Power BI
Browse all Power BI KPI dashboards.




























Reviews
There are no reviews yet.