

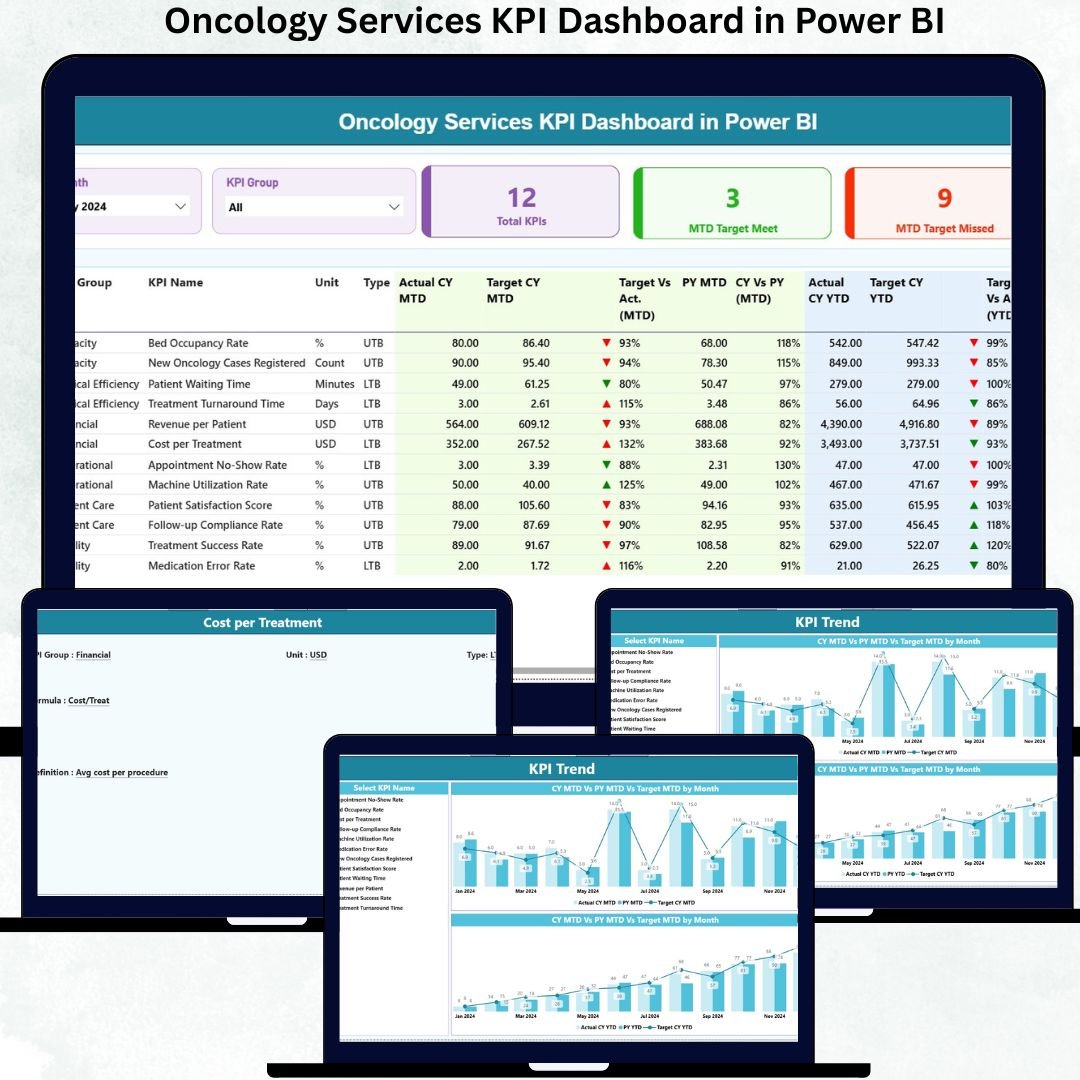

Oncology services demand precision, speed, and continuous performance visibility. Every KPI directly impacts patient outcomes, treatment quality, resource utilization, and operational efficiency. Yet, many oncology departments still struggle with scattered Excel files, delayed reports, and inconsistent KPIs—making timely decisions difficult.
The Oncology Services KPI Dashboard in Power BI solves this challenge by converting complex oncology performance data into clear, interactive, and decision-ready insights. Oncology Services KPI Dashboard in Power BI This ready-to-use dashboard enables hospital leaders, oncology heads, and performance teams to track targets, actuals, gaps, and trends through one unified Power BI interface. With Excel as the data source and Power BI for analytics, the dashboard combines simplicity with enterprise-level intelligence.
This dashboard helps oncology teams move from manual reporting to data-driven, proactive healthcare management.
🚀 Key Features of the Oncology Services KPI Dashboard in Power BI
🎯 Centralized Oncology KPI Monitoring – Track all oncology KPIs in one dashboard
📊 MTD & YTD Performance Tracking – Monitor short-term and cumulative outcomes
✅ Target Met vs Missed Indicators – Instantly identify gaps using visual arrows
📈 Actual vs Target vs Previous Year Comparison – Measure improvement accurately
🎛️ Interactive Month & KPI Group Slicers – Focus analysis instantly
📉 Trend Analysis (MTD & YTD) – Understand performance patterns over time
🔍 Drill-Through KPI Definitions – Maintain transparency and clarity
⚡ Excel + Power BI Model – Easy data entry with powerful analytics
📦 What’s Inside the Oncology Services KPI Dashboard
This Power BI dashboard consists of three professionally designed analytical pages, each serving a critical decision-making purpose:
🟢 Summary Page
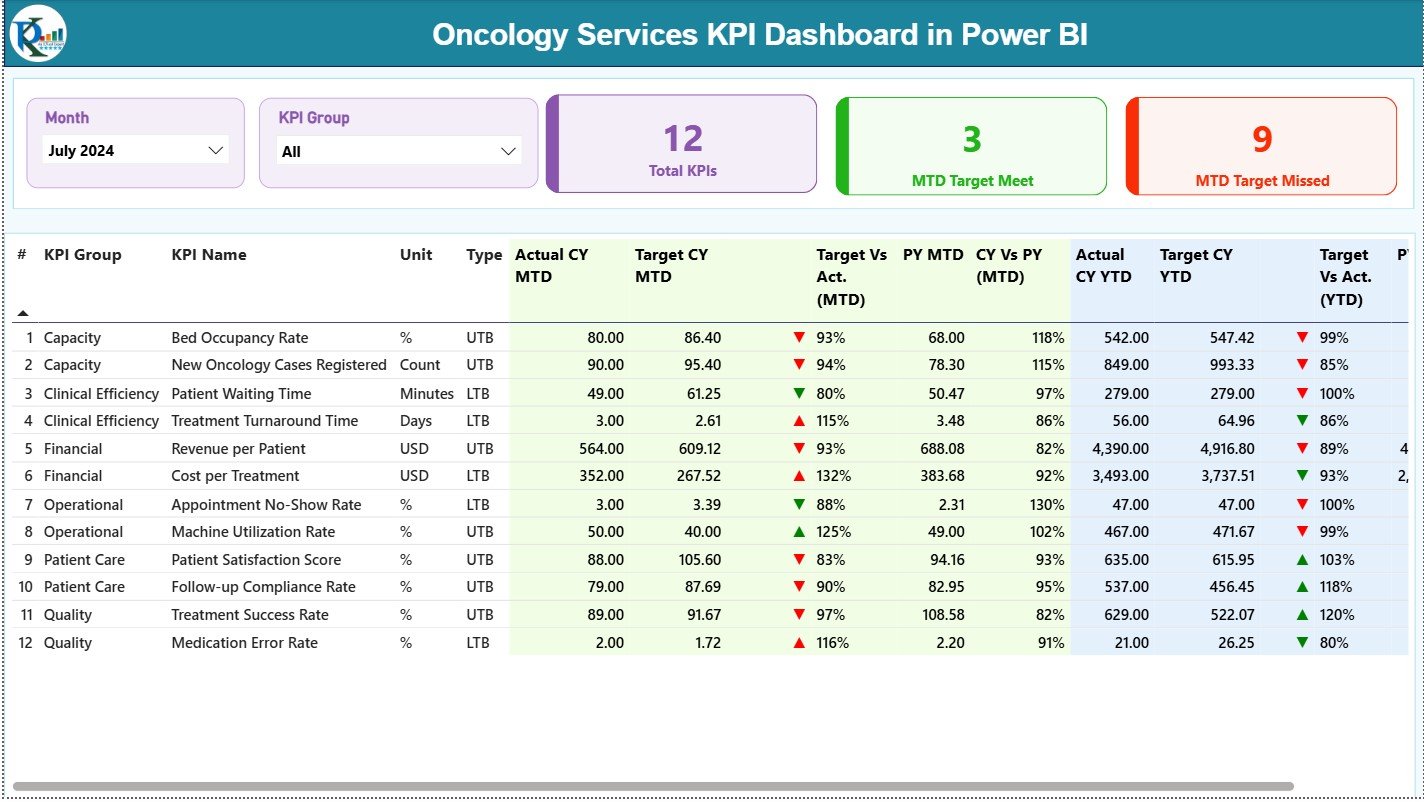
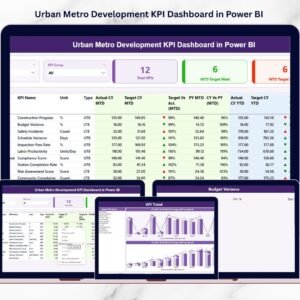
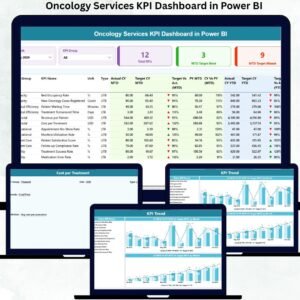
The main control panel for oncology performance. Displays KPI cards for Total KPIs, MTD Target Met, and MTD Target Missed. A detailed KPI table shows MTD and YTD actuals, targets, previous-year values, ratios, and visual icons—allowing leaders to assess performance instantly.
📉 KPI Trend Page
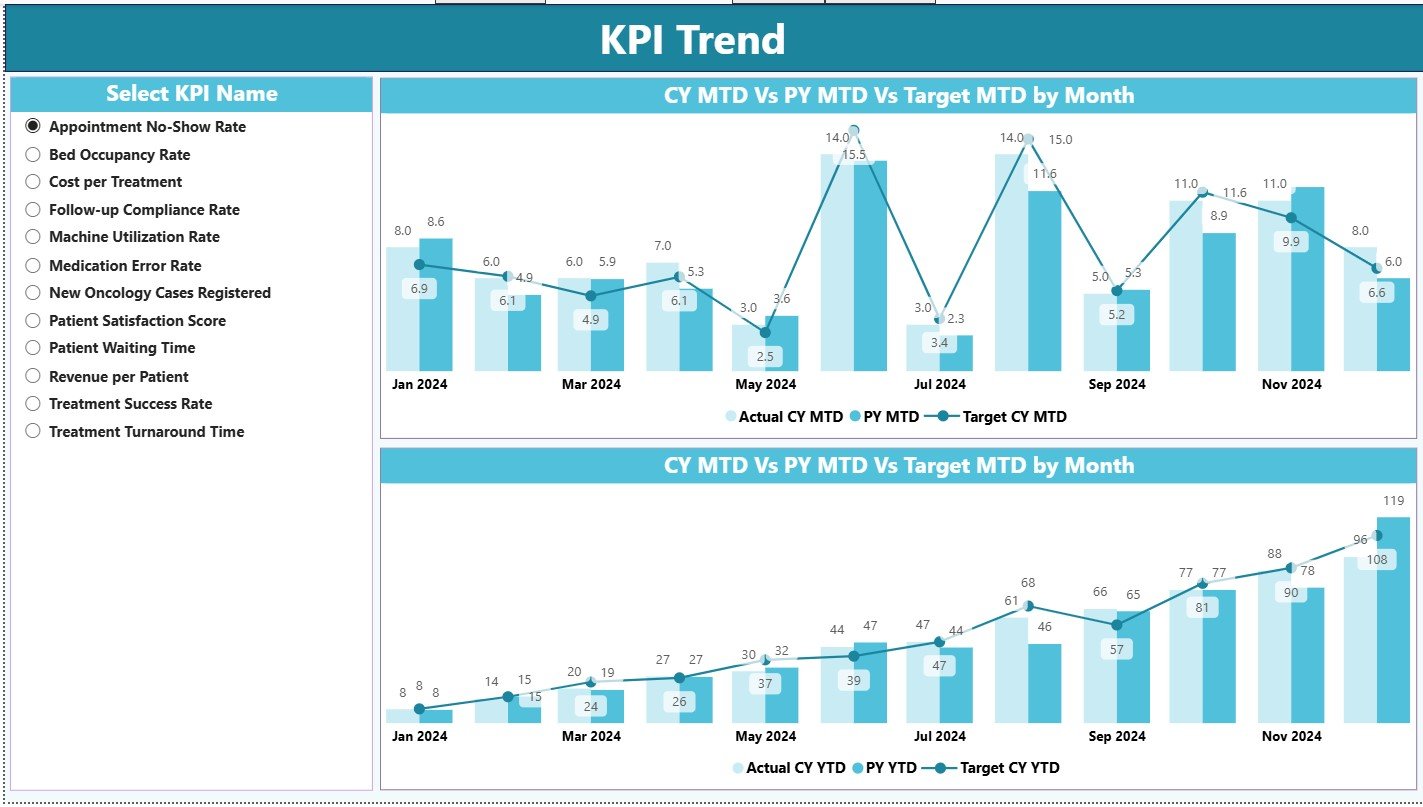
Designed for time-based analysis. Users select a KPI and instantly view MTD and YTD trend combo charts comparing Current Year, Previous Year, and Targets. This page highlights trends, consistency, and improvement opportunities.
📘 KPI Definition Page
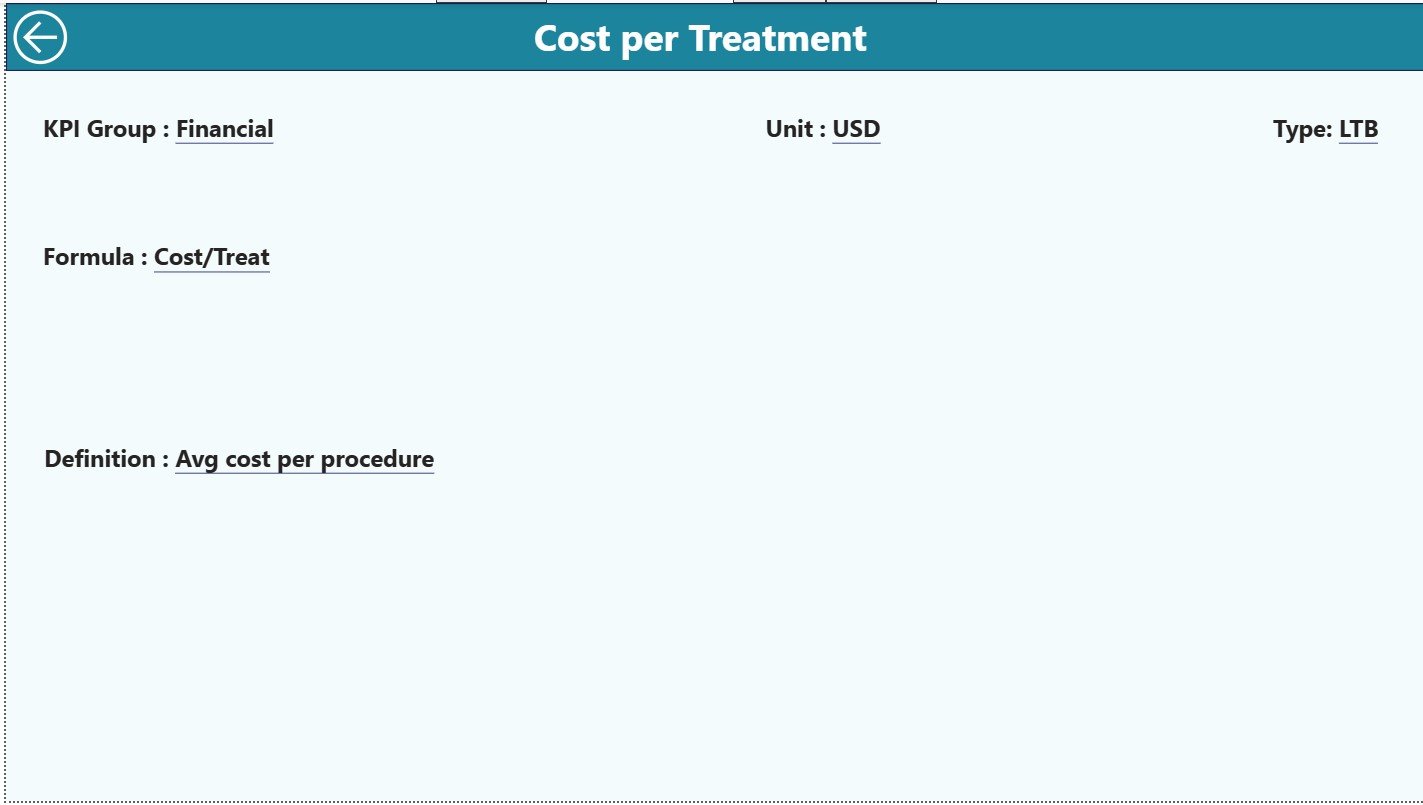
A drill-through reference page that explains KPI Formula, Definition, Unit, and Logic. It ensures consistent understanding across clinical, quality, and management teams, with a built-in back button for smooth navigation.
🔗 Excel Backend Structure
The dashboard is powered by three structured Excel sheets:
Input_Actual – Actual MTD & YTD oncology values
Input_Target – Planned MTD & YTD targets
KPI Definition – KPI number, group, unit, formula, definition, and type (LTB/UTB)
🛠️ How to Use the Oncology Services KPI Dashboard
✅ Step 1: Enter actual KPIs in the Input Actual Excel sheet
✅ Step 2: Update targets in the Input Target sheet
✅ Step 3: Maintain KPI logic in the KPI Definition sheet
✅ Step 4: Refresh the Power BI dashboard
✅ Step 5: Analyze KPIs, trends, and target status
No advanced Power BI skills are required. The dashboard is plug-and-play, intuitive, and healthcare-friendly.
👥 Who Can Benefit from This Oncology Dashboard?
🏥 Oncology Department Heads
👩⚕️ Hospital Administrators
📊 Clinical Operations Teams
✅ Quality & Performance Monitoring Teams
📈 Healthcare Analysts
👔 Senior Leadership
Any healthcare organization focused on performance excellence and patient-centric outcomes will benefit immediately.
🔗 Click here to read the Detailed blog post
🎥 Visit our YouTube channel to learn step-by-step video tutorials
Watch the step-by-step video tutorial:
Compatibility and Requirements
- Works in Power BI Desktop, which is free to download. Microsoft explains how to get it in Get Power BI Desktop.
- Your data is entered in three Excel sheets: Input_Actual, Input_Target and KPI Definition.
Frequently Asked Questions
How many pages does the dashboard have?
Three pages: Summary, KPI Trend and KPI Definition.
Where do I enter my data?
Enter actual MTD and YTD values in the Input_Actual sheet and targets in the Input_Target sheet. KPI numbers, groups, units, formulas and definitions go in the KPI Definition sheet. Then refresh the dashboard.
Can I see which KPIs met their targets?
Yes. The Summary page shows cards for Total KPIs, MTD Target Met and MTD Target Missed. The KPI table uses visual icons to mark each KPI against its target.
Does it compare against the previous year?
Yes. The Summary table shows MTD and YTD actuals, targets and previous-year values. The KPI Trend page charts Current Year, Previous Year and Target for the KPI you select.
Is there an Excel version?
Yes. See the Oncology Services KPI Dashboard in Excel. A related dashboard is also available as the Oncology Services Dashboard in Power BI.
Related Healthcare Dashboards
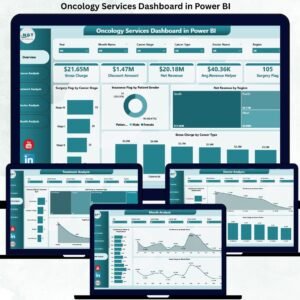
- Oncology Services Dashboard in Power BI: another oncology dashboard in Power BI
- Oncology Services KPI Dashboard in Excel: the same topic in Excel
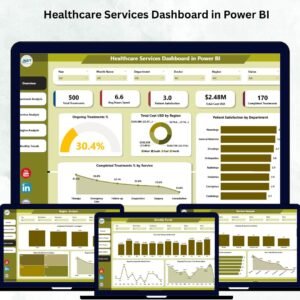
- Healthcare Services Dashboard in Power BI: a wider healthcare view
- Healthcare Services KPI Dashboard in Excel: healthcare KPIs in Excel
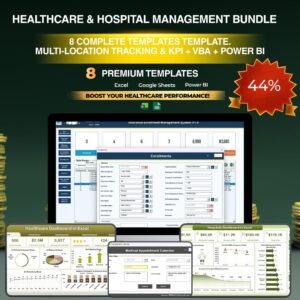
- Healthcare & Hospital Management Bundle: 8 healthcare templates in one download
Browse all Power BI KPI dashboards.

























Reviews
There are no reviews yet.