Investor service operations demand accuracy, transparency, and real-time visibility. Organizations that manage investors—such as asset management firms, financial institutions, advisory companies, and investment platforms—must continuously monitor transactions, portfolios, service levels, and investor satisfaction. However, when this information stays scattered across multiple Excel files and manual reports, teams lose clarity and valuable time. That is exactly why an Investor Services Dashboard in Excel becomes a powerful and practical solution.
The Investor Services Dashboard in Excel is a ready-to-use, interactive dashboard that brings all investor-related KPIs into one centralized Excel file. Instead of chasing different reports, you can instantly analyze transaction amounts, portfolio values, SLA performance, service quality, and satisfaction scores using clean visuals and automated KPIs. As a result, decision-makers gain immediate insights and respond faster to investor needs.
Built entirely in Excel, this dashboard is cost-effective, flexible, and easy to use. You do not need BI tools, coding skills, or complex systems. Even non-technical users can confidently explore performance trends and improve investor experience through data-driven decisions.
✨ Key Features of the Investor Services Dashboard in Excel
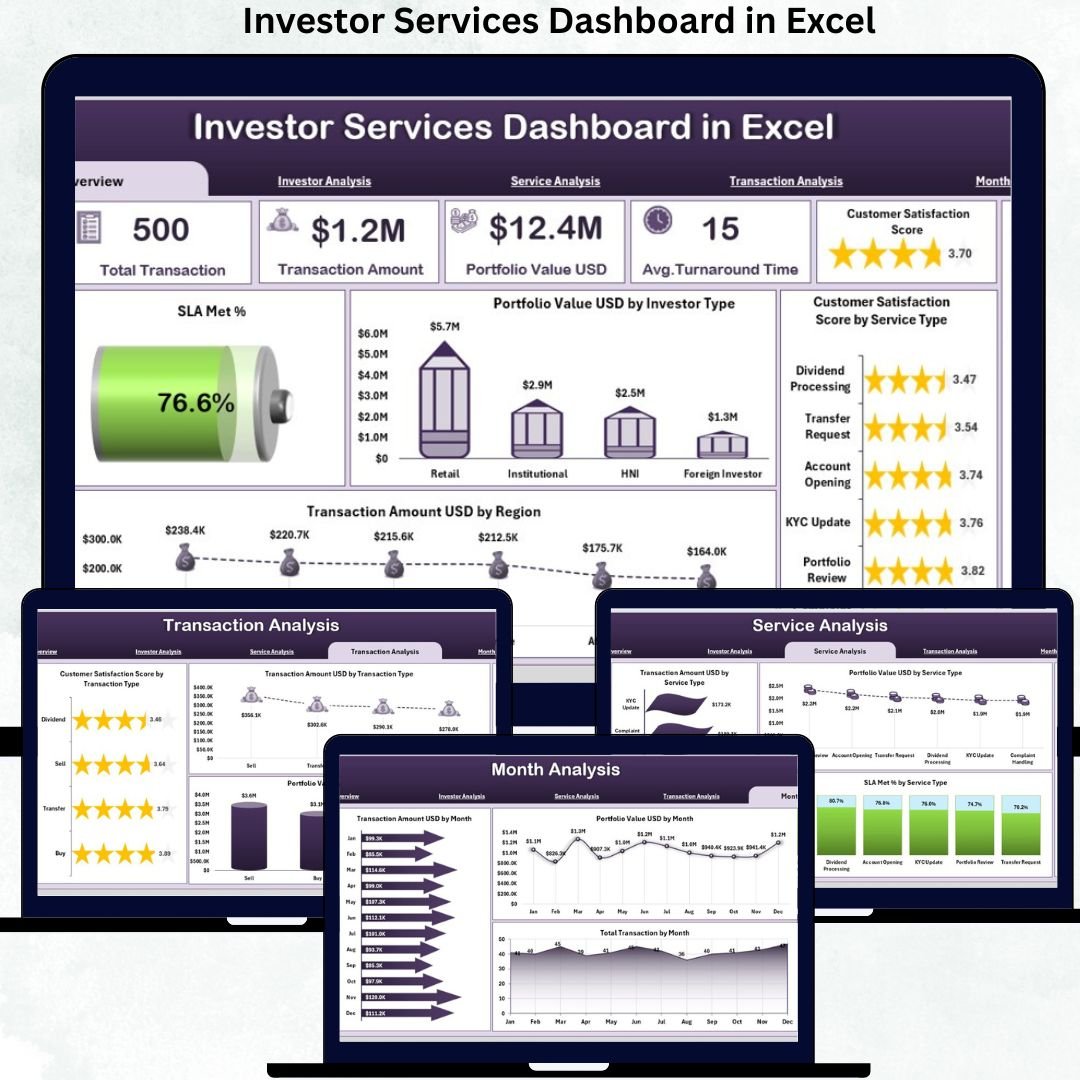
The dashboard includes five analytical pages, a left-side page navigator, right-side slicers, KPI cards, and automated charts.
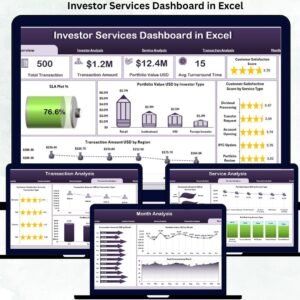
⭐ Overview Page – Investor Services Snapshot
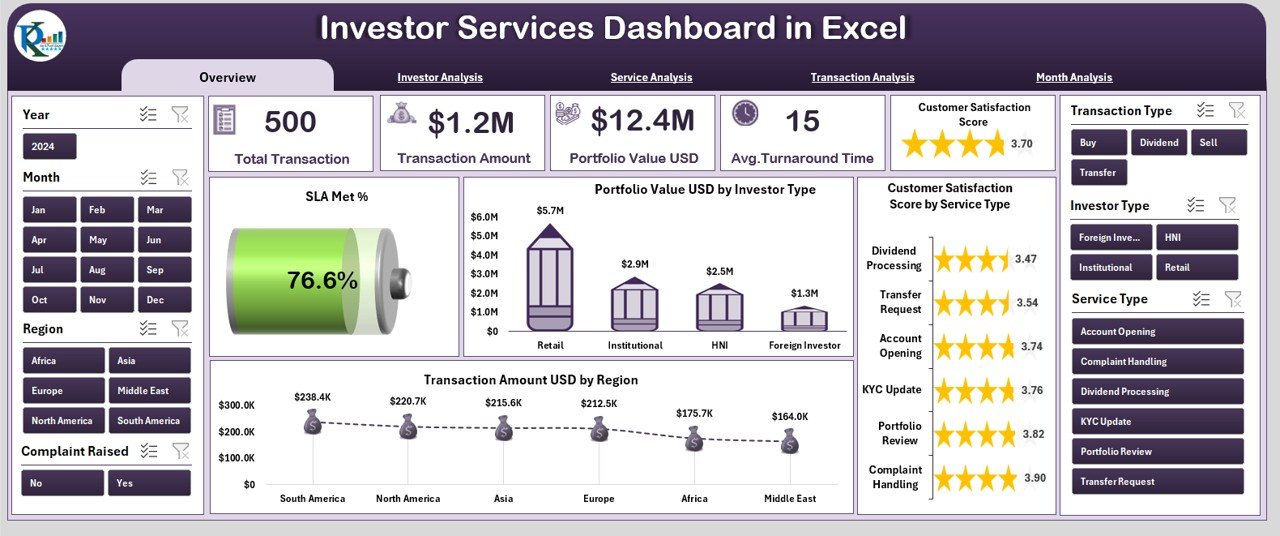
✔ Right-side slicers for instant filtering
✔ Five KPI cards showing overall investor service health
✔ Four high-level charts, including:
-
SLA Met %
-
Portfolio Value (USD) by Investee Type
-
Customer Satisfaction Score by Service Type
-
Transaction Amount (USD) by Region
This page gives leadership an immediate understanding of performance, risk, and service quality.
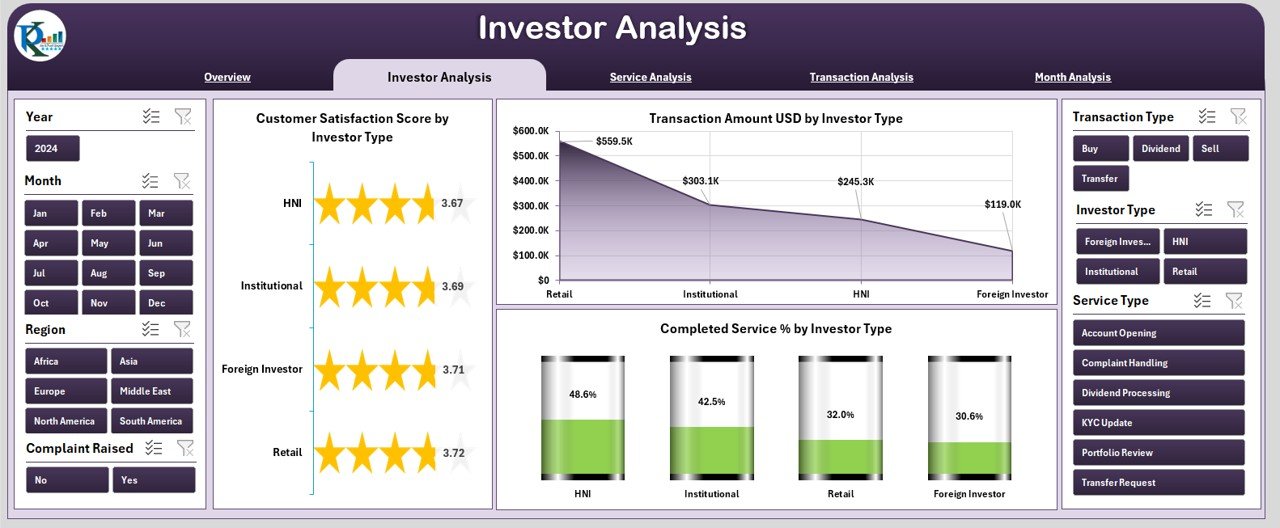
⭐ Investor Analysis Page – Investor-Type Performance
✔ Satisfaction Score by Investor Type
✔ Transaction Amount (USD) by Investor Type
✔ Completed Service % by Investor Type
This analysis helps teams identify high-value investor segments and optimize service delivery.
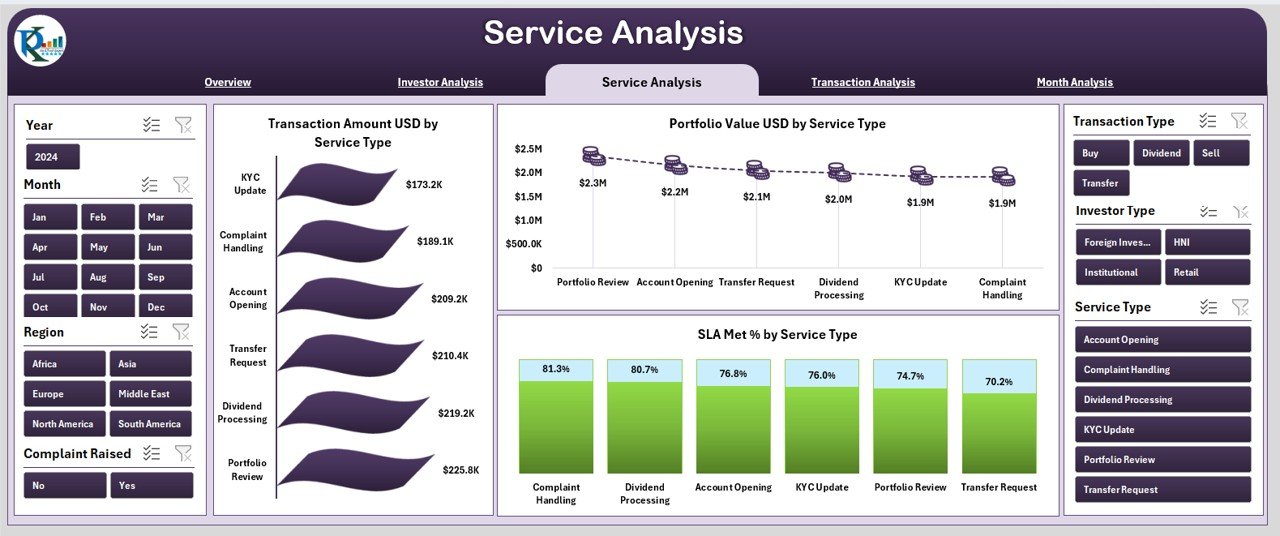
⭐ Service Analysis Page – Service Efficiency Insights
✔ Transaction Amount (USD) by Service Type
✔ Portfolio Value (USD) by Service Type
✔ SLA Met % by Service Type
This page highlights which services drive value and which require improvement.
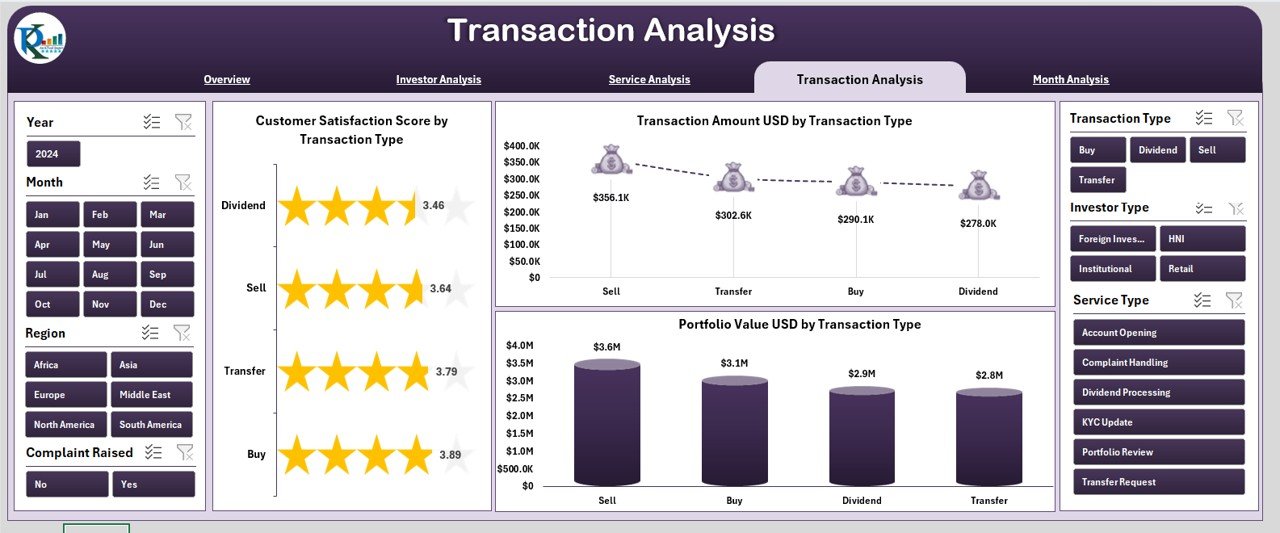
⭐ Transaction Analysis Page – Transaction-Level Intelligence
✔ Transaction Amount (USD) by Transaction Type
✔ Portfolio Value (USD) by Transaction Type
✔ Customer Satisfaction Score by Transaction Type
Teams can use this page to strengthen processes for high-impact transaction categories.
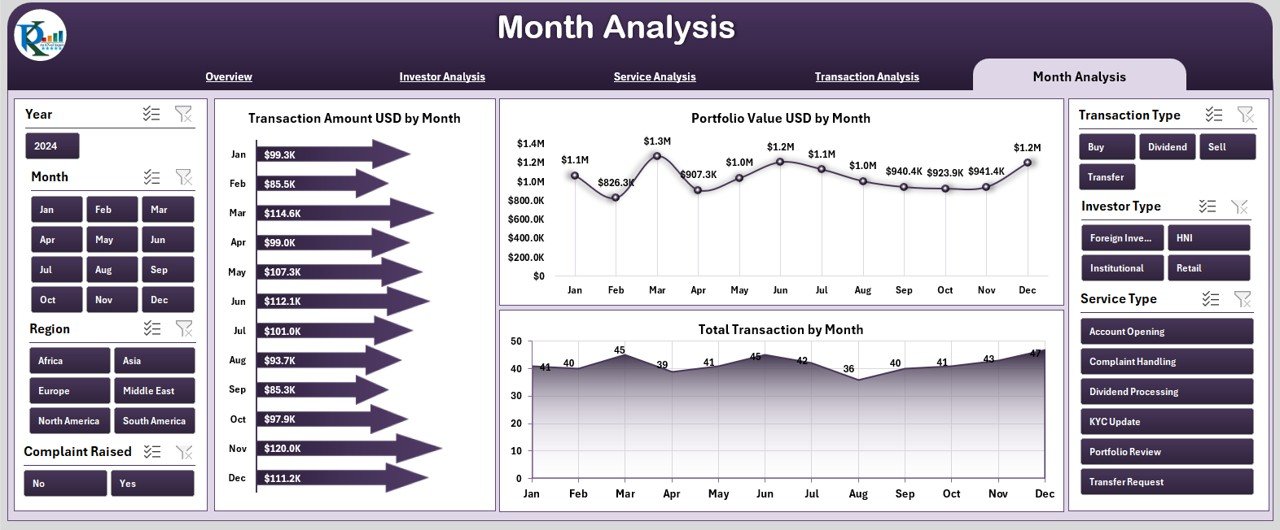
⭐ Month Analysis Page – Trend Monitoring Over Time
✔ Transaction Amount (USD) by Month
✔ Portfolio Value (USD) by Month
✔ Total Transactions by Month
Monthly trends help organizations forecast demand and plan resources more accurately.
📦 What’s Inside the Investor Services Dashboard in Excel
When you download this product, you receive:
✨ A ready-to-use Excel dashboard file
✨ Five interactive analysis pages
✨ Left-side page navigator for smooth navigation
✨ Right-side slicers for detailed filtering
✨ KPI cards for instant insights
✨ Automated charts connected to data
✨ A structured Data Sheet for updates
✨ A Support Sheet for dropdowns and automation
Every visual updates automatically as soon as you change the data.
🛠️ How to Use the Investor Services Dashboard in Excel
1️⃣ Enter investor data in the Data Sheet
2️⃣ Navigate across dashboard pages using the page navigator
3️⃣ Apply slicers for region, investor type, or service type
4️⃣ Review KPI cards for quick performance insights
5️⃣ Analyze satisfaction, transactions, and portfolios
6️⃣ Identify performance gaps and improvement opportunities
7️⃣ Share insights with leadership confidently
No advanced Excel skills are required—basic knowledge is enough.
👥 Who Can Benefit from This Investor Services Dashboard in Excel
This dashboard is ideal for:
✔ Investor Relations Teams
✔ Portfolio & Fund Managers
✔ Financial Analysts
✔ Service Operations Managers
✔ Wealth Management Firms
✔ Financial Institutions & Advisory Firms
✔ Executive Leadership Teams
Any organization managing investors will benefit from this dashboard.
### 📘 Click here to read the Detailed blog post
🎥 Visit our YouTube channel to learn step-by-step video tutorials
👉 Youtube.com/@PKAnExcelExpert


Reviews
There are no reviews yet.