Poultry farming today runs on margins, speed, and precision. Farmers, integrators, and agribusiness owners must track feed expenses, medicine costs, bird performance, mortality reasons, profit margins, and regional trends—often on a daily basis. When this information is spread across registers, Excel files, and manual reports, it becomes difficult to see what is really happening on the farm. This is exactly why a Poultry Farming Dashboard in Power BI becomes an essential management tool.
The Poultry Farming Dashboard in Power BI is a ready-to-use analytics solution that converts raw poultry farm data into interactive visuals, smart KPIs, and actionable insights. Built using Power BI and supported by structured data, this dashboard allows users to understand performance instantly without complex calculations or technical effort. With dynamic slicers, real-time filtering, and visually clear charts, poultry managers can identify profit drivers, control costs, and respond faster to operational challenges.
Instead of relying on guesswork, this dashboard enables data-driven decision-making across farm types, bird categories, feed strategies, and time periods. Whether you manage a single farm or oversee operations across multiple regions, this dashboard helps you operate with clarity, confidence, and control.
✨ Key Features of the Poultry Farming Dashboard in Power BI
This professionally designed dashboard includes five structured analysis pages, each answering a critical poultry-business question.
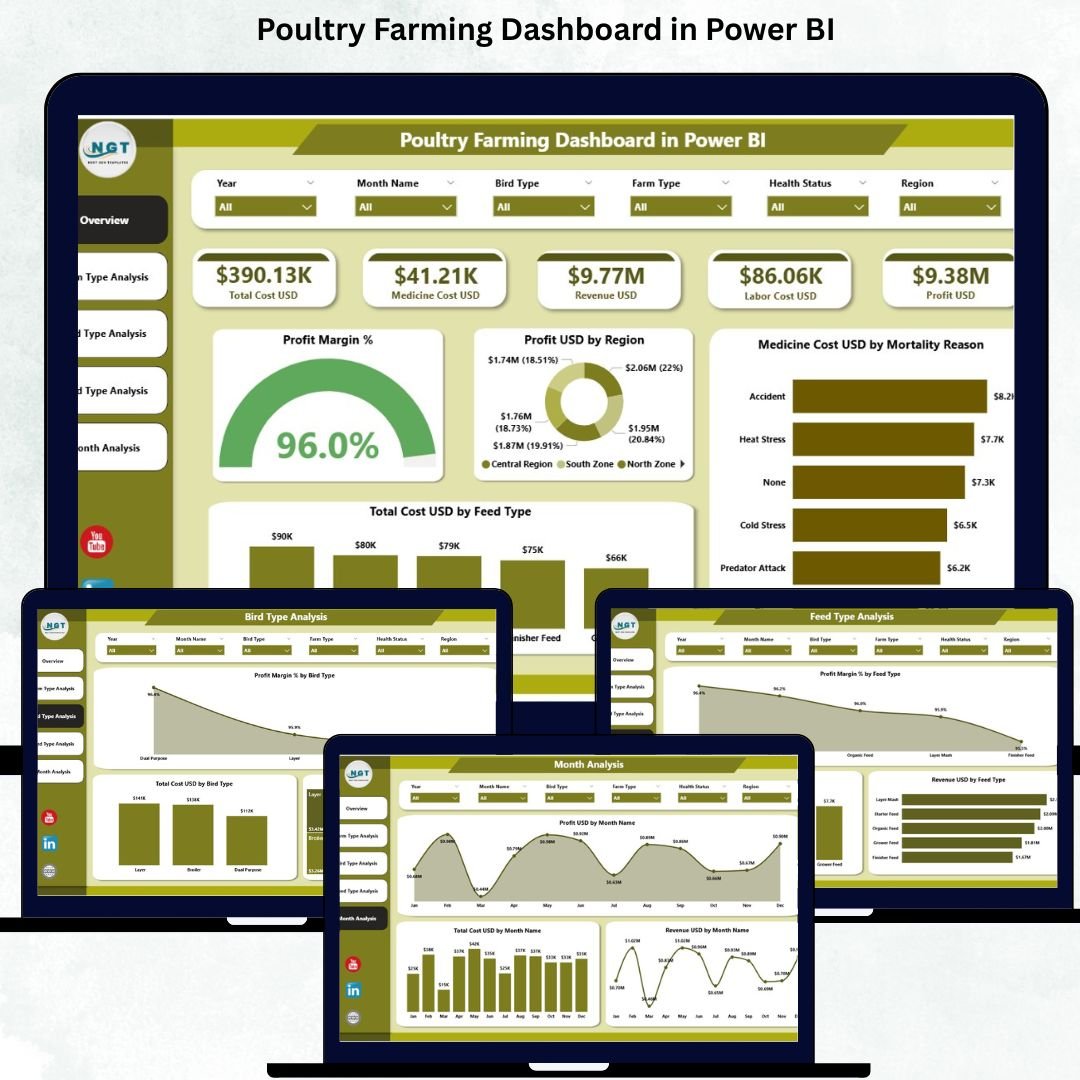
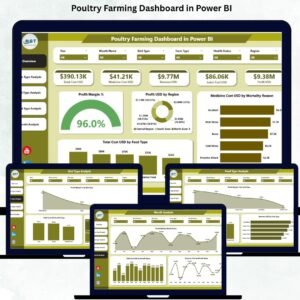
⭐ Overview Page – Complete Poultry Performance Snapshot
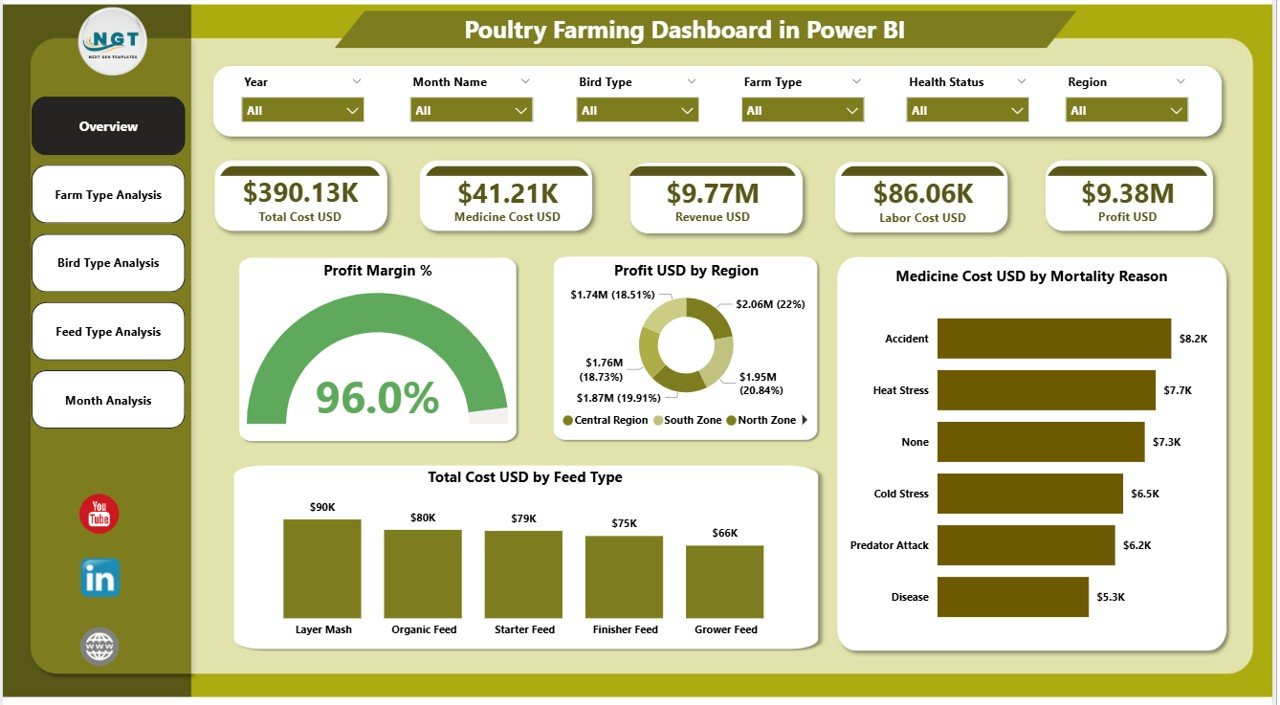
✔ Interactive slicers for Region, Farm Type, Bird Type, Feed Type, and Month
✔ Four KPI cards displaying:
-
Profit Margin %
-
Total Profit USD
-
Total Cost USD
-
Total Revenue USD
✔ Four essential charts:
-
Profit USD by Region
-
Profit Margin % overview
-
Medicine Cost USD by Mortality Reason
-
Total Cost USD by Feed Type
This page gives instant visibility into profitability, cost drivers, and regional performance.
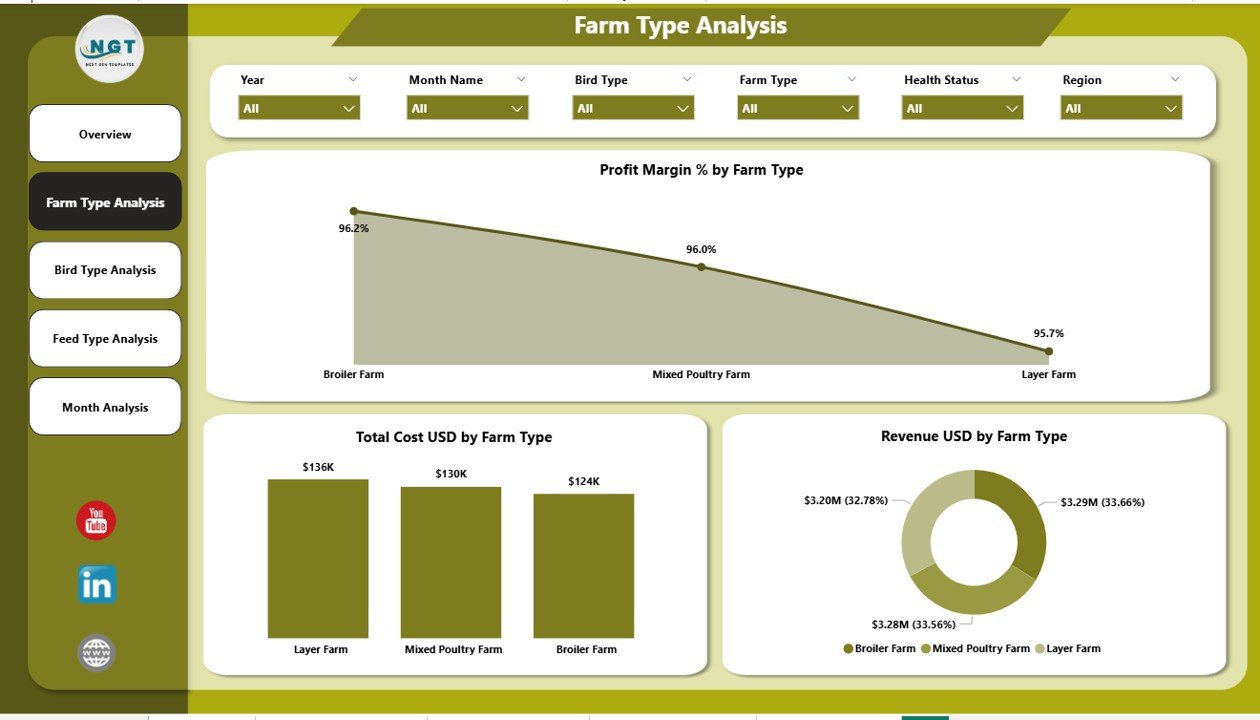
⭐ Farm Type Analysis Page – Compare Different Poultry Models
✔ Profit Margin % by Farm Type
✔ Total Cost USD by Farm Type
✔ Revenue USD by Farm Type
This page helps identify which farm types generate better margins and which require optimization.
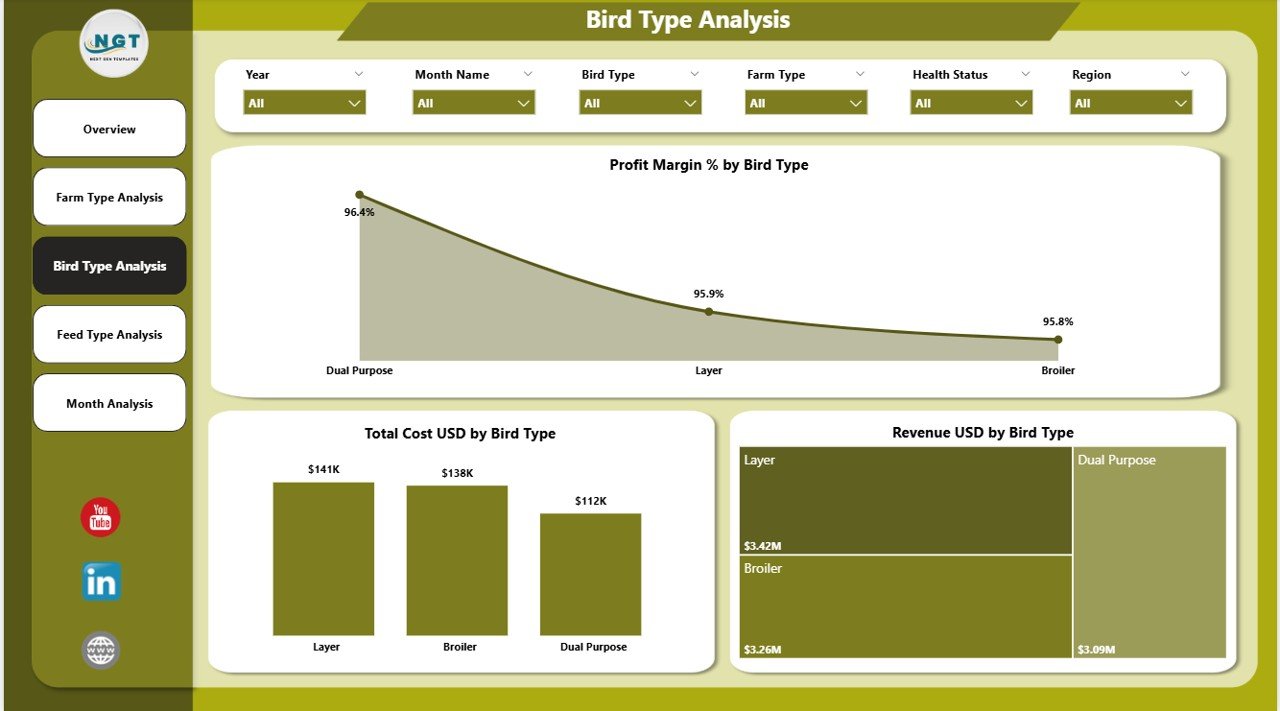
⭐ Bird Type Analysis Page – Understand Bird-Level Performance
✔ Profit Margin % by Bird Type
✔ Total Cost USD by Bird Type
✔ Revenue USD by Bird Type
With this analysis, managers quickly see which bird types drive profitability and which increase costs.
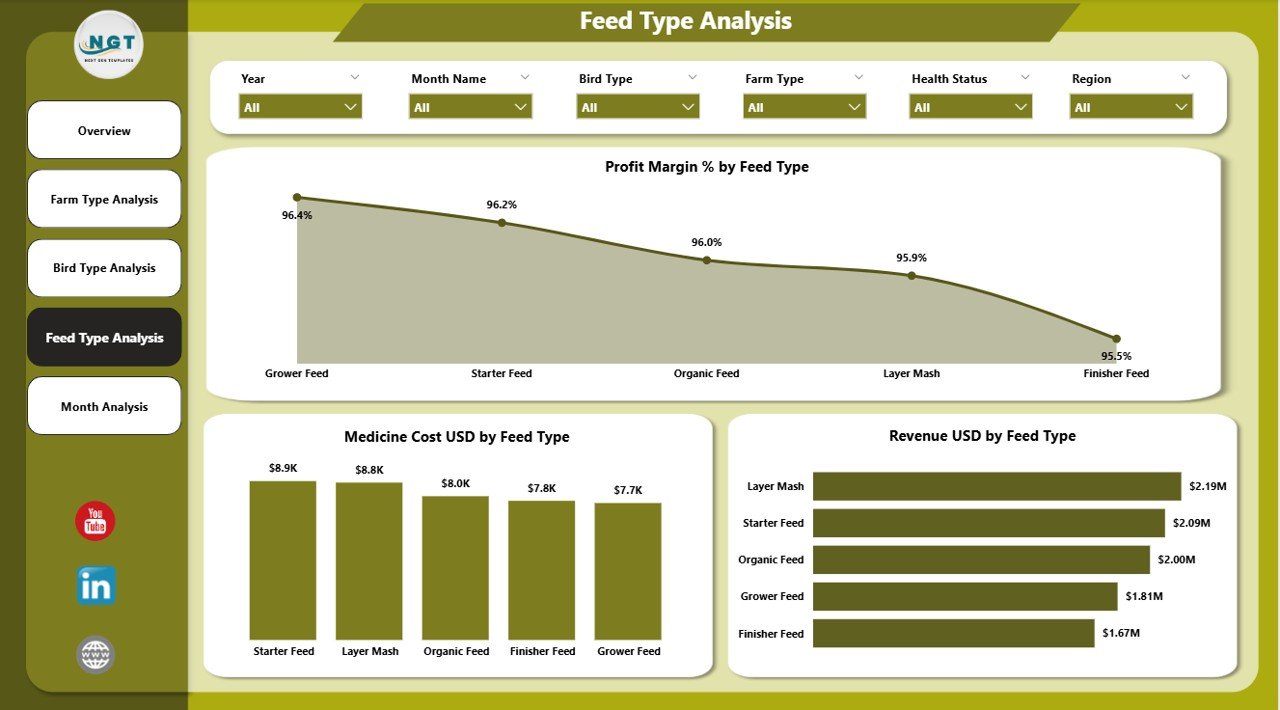
⭐ Feed Type Analysis Page – Control Your Biggest Cost Driver
✔ Profit Margin % by Feed Type
✔ Medicine Cost USD by Feed Type
✔ Revenue USD by Feed Type
Since feed contributes a major portion of poultry costs, this page supports better feed-strategy decisions.
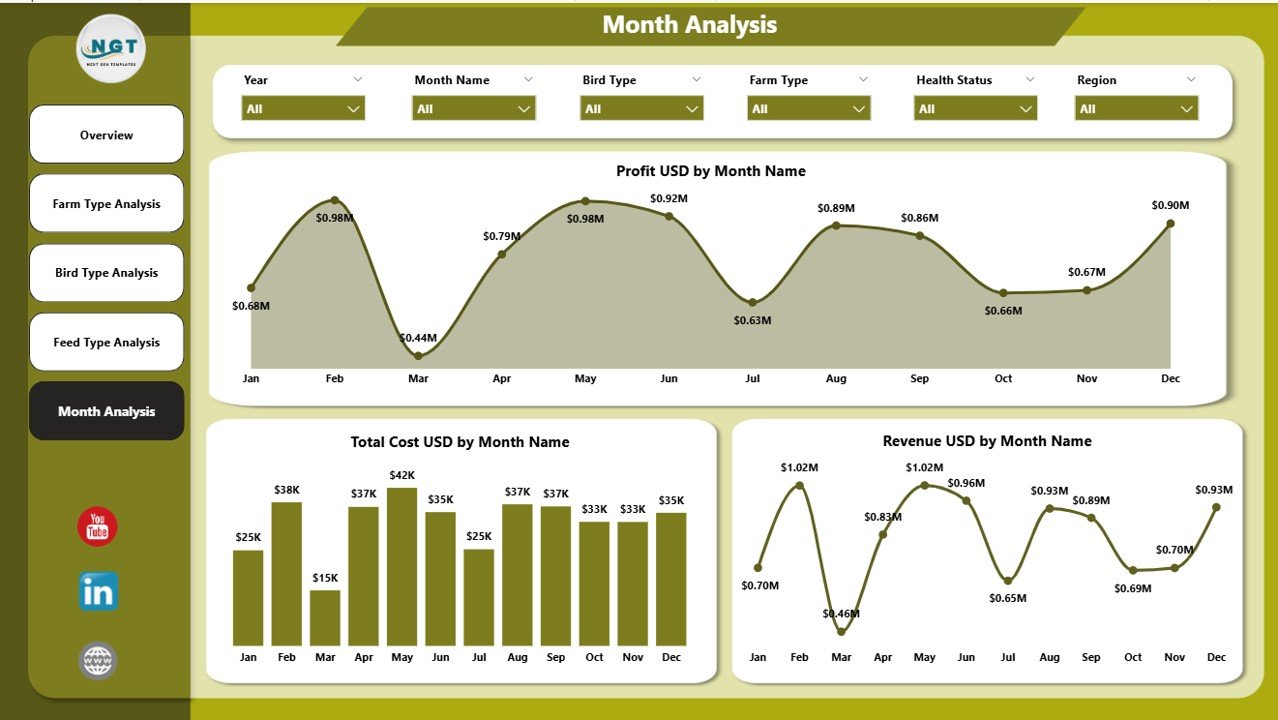
⭐ Monthly Trends Page – Track Performance Over Time
✔ Profit USD by Month
✔ Total Cost USD by Month
✔ Revenue USD by Month
This page reveals seasonality, cost fluctuations, and revenue patterns, supporting accurate forecasting and planning.
📦 What’s Inside the Poultry Farming Dashboard in Power BI
When you download this product, you receive:
✨ A professionally designed Power BI dashboard (.pbix)
✨ Five interactive analytics pages
✨ KPI cards and dynamic charts
✨ Slicers for deep-level filtering
✨ Clear visuals for profitability, cost, and performance tracking
✨ Scalable design suitable for small and large farms
Everything is designed to simplify poultry farm analytics and improve decision quality.
🛠️ How to Use the Poultry Farming Dashboard in Power BI
1️⃣ Prepare your poultry data (costs, revenue, bird type, feed type, regions, months)
2️⃣ Load or refresh the data in Power BI
3️⃣ Open the dashboard pages
4️⃣ Use slicers to filter by region, farm type, bird type, feed type, or time
5️⃣ Review KPIs and charts
6️⃣ Identify high-cost areas and profit opportunities
7️⃣ Take corrective actions based on insights
You do not need advanced Power BI skills—basic refresh and navigation are enough.
👥 Who Can Benefit from This Poultry Farming Dashboard in Power BI
This dashboard is ideal for:
✔ Poultry farmers and farm owners
✔ Poultry integrators
✔ Agribusiness companies
✔ Farm managers and supervisors
✔ Financial and planning teams
✔ Consultants and advisors
✔ Regional and multi-farm operators
Anyone managing poultry operations will find immediate value.
### 📘 Click here to read the Detailed blog post
🎥 Visit our YouTube channel to learn step-by-step video tutorials
👉 Youtube.com/@PKAnExcelExpert


Reviews
There are no reviews yet.