
Exit interviews offer extremely valuable insights into why employees leave, what challenges they face, and how organizations can improve employee retention. But managing exit data manually often leads to incomplete records, slow analysis, and missed opportunities for improving workplace culture. The Exit Interview KPI Dashboard in Google Sheets solves this problem by transforming exit feedback into clear, visual, and actionable metrics.
This ready-to-use dashboard helps HR teams understand exit reasons, analyze turnover trends, compare performance with targets, and identify leadership or culture issues that impact retention. With automated charts, MTD/YTD KPIs, trend analysis, and customizable definitions, the dashboard gives companies a complete 360° view of turnover patterns—empowering HR leaders to make smarter, faster decisions that protect talent and reduce turnover costs.
✨ Key Features of the Exit Interview KPI Dashboard in Google Sheets
📊 1. Complete Exit KPI Monitoring
Track all essential exit-related KPIs including exit trends, turnover factors, manager-related exits, satisfaction scores, engagement levels, tenure groups, job level exits, and more. All KPIs automatically update based on the selected month.
📈 2. Target vs Actual & PY Benchmarking
The dashboard compares:
-
MTD Actual vs Target
-
MTD Actual vs Previous Year
-
YTD Actual vs Target
-
YTD Actual vs Previous Year
Green arrows highlight improved performance, while red arrows indicate decline—making decision-making faster and clearer.
📉 3. Dynamic Trend Charts
View month-by-month movement of any KPI. This allows HR teams to identify patterns such as rising turnover, manager hotspots, tenure-based issues, or culture-related concerns.
📦 What’s Inside the Exit Interview KPI Dashboard in Google Sheets
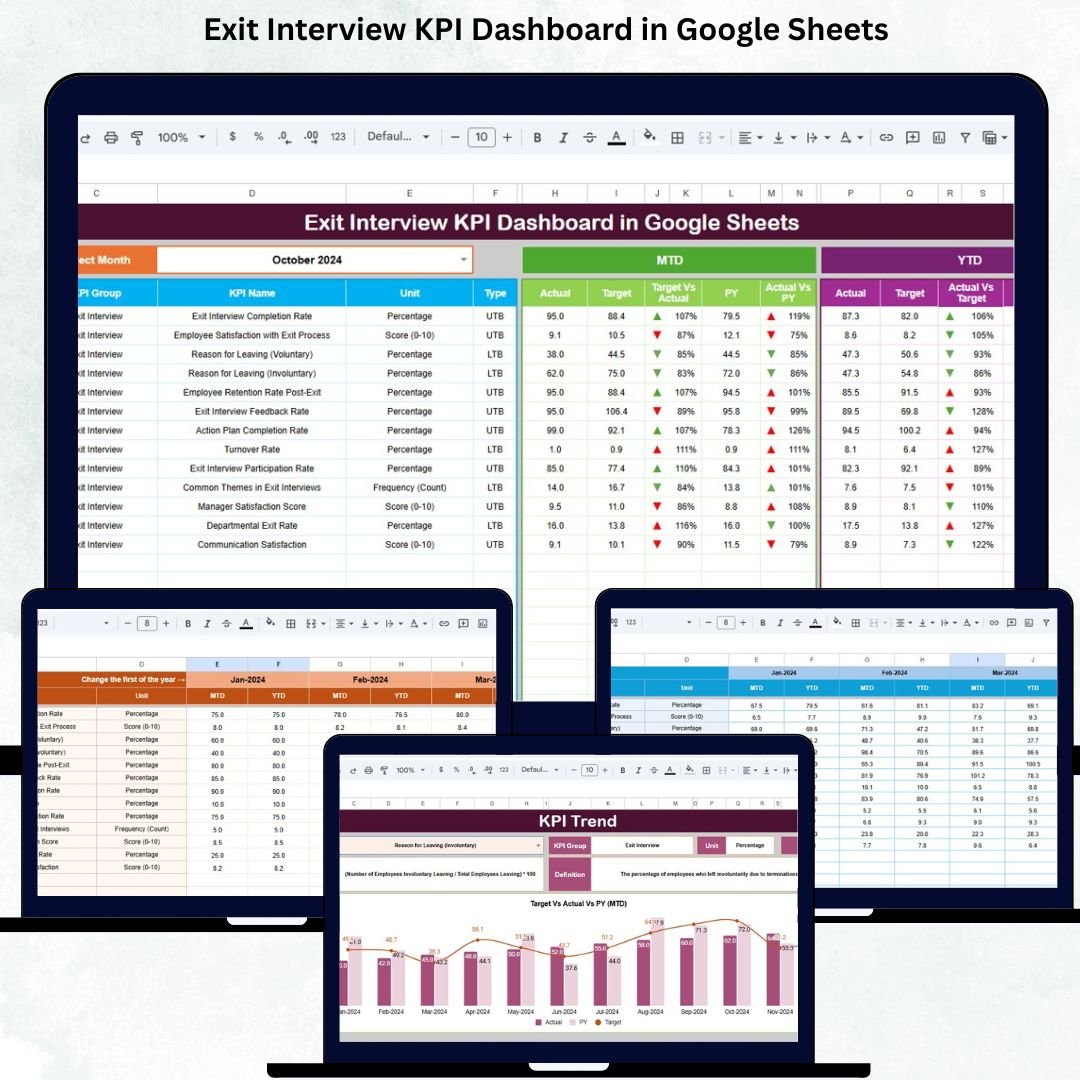
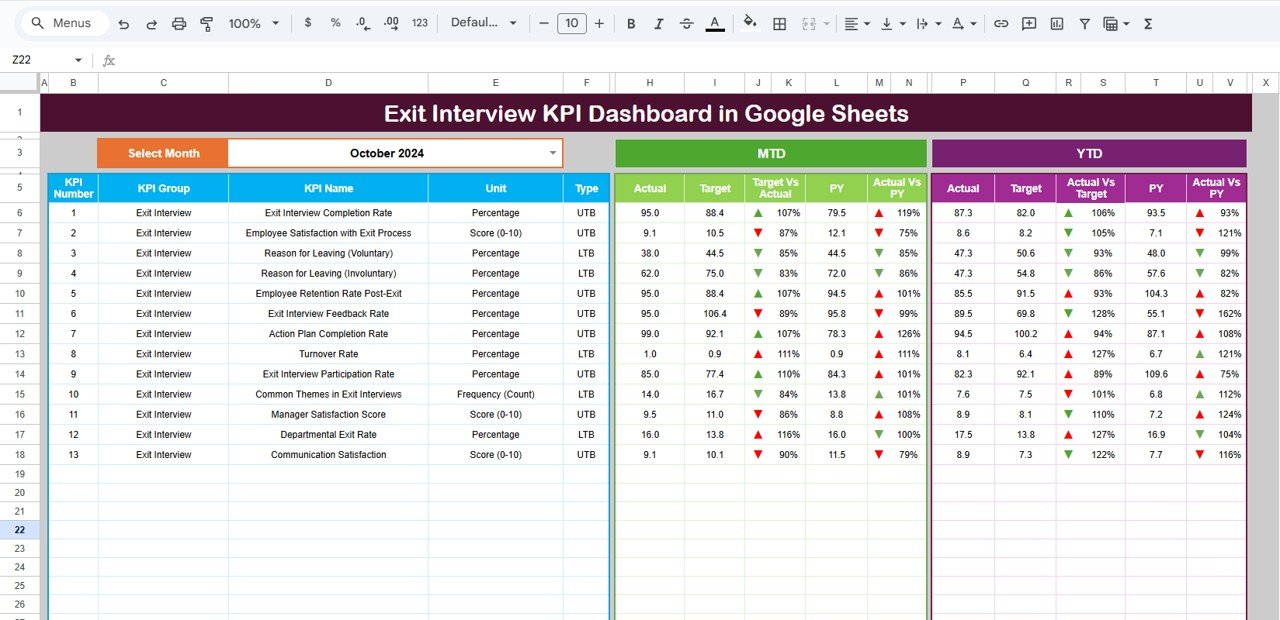
📍 1. Dashboard Sheet – Main Analytics Panel
This is the central hub of the product. By simply selecting the month in D3, all KPIs and visuals refresh automatically.
The Dashboard displays:
-
MTD: Actual, Target, PY
-
YTD: Actual, Target, PY
-
Visual arrows for quick comparison
-
Workforce exit insights summarized into simple visuals
This provides HR teams with a snapshot of current turnover performance.
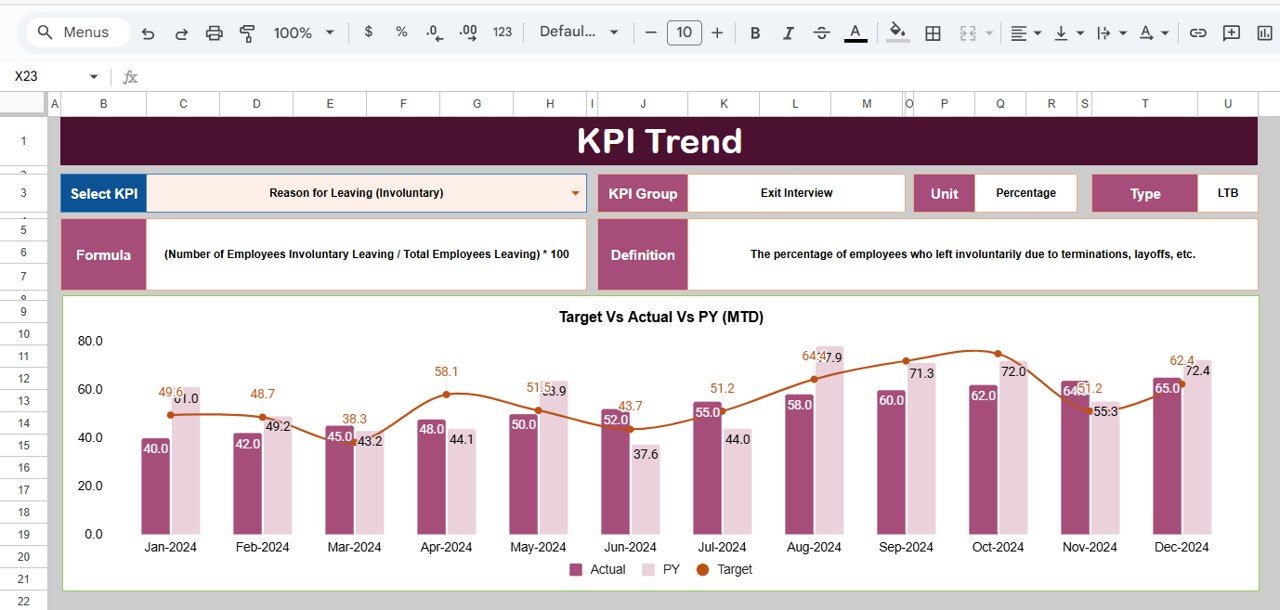
📈 2. KPI Trend Sheet – Deep Trend Analysis
Choose any KPI from the dropdown in C3 and instantly see:
-
KPI Group
-
Unit
-
Performance Type (UTB/LTB)
-
Formula
-
KPI Definition
-
Month-wise trend chart
This sheet is perfect for analyzing long-term patterns and identifying problem areas before they grow.
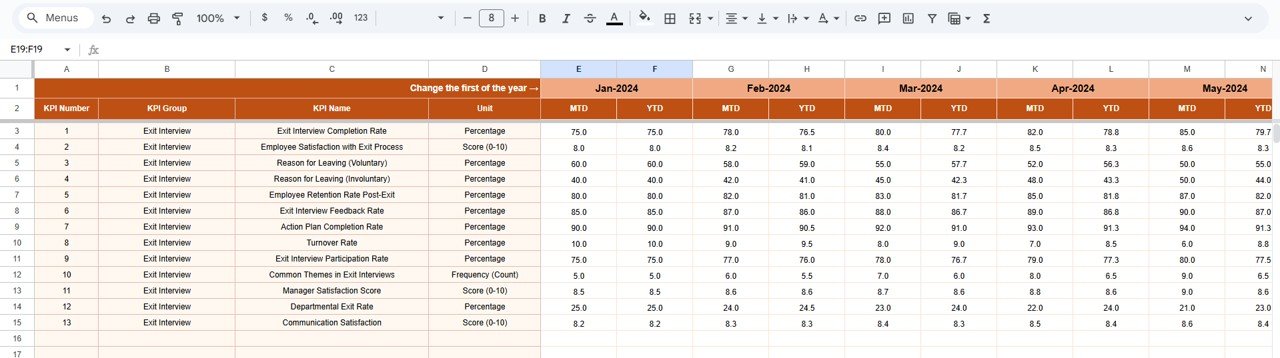
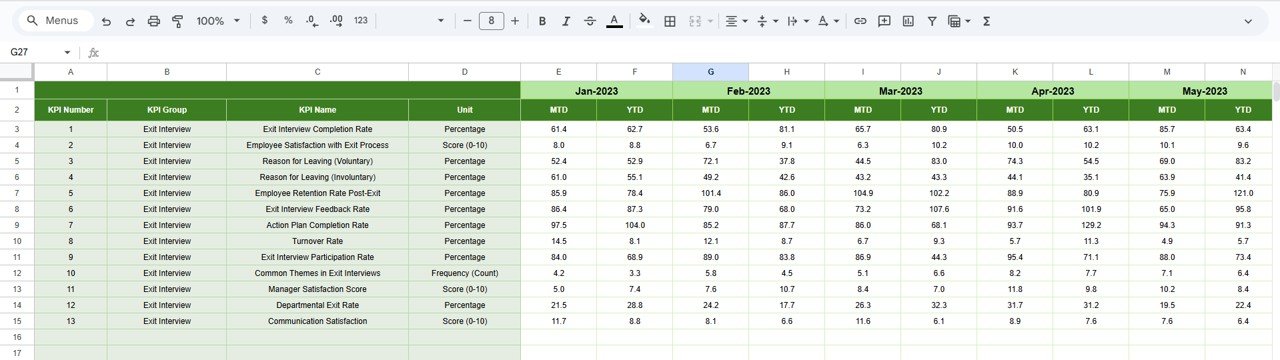
📋 3. Actual Number Sheet – Update Real Exit Data
Enter MTD and YTD exit data here. Change the reporting month in E1 to switch the dashboard view instantly.
🎯 4. Target Sheet – Set Company Turnover Goals
Organizations can manually set monthly and yearly targets for each KPI. This helps track progress against goals and improve HR planning.
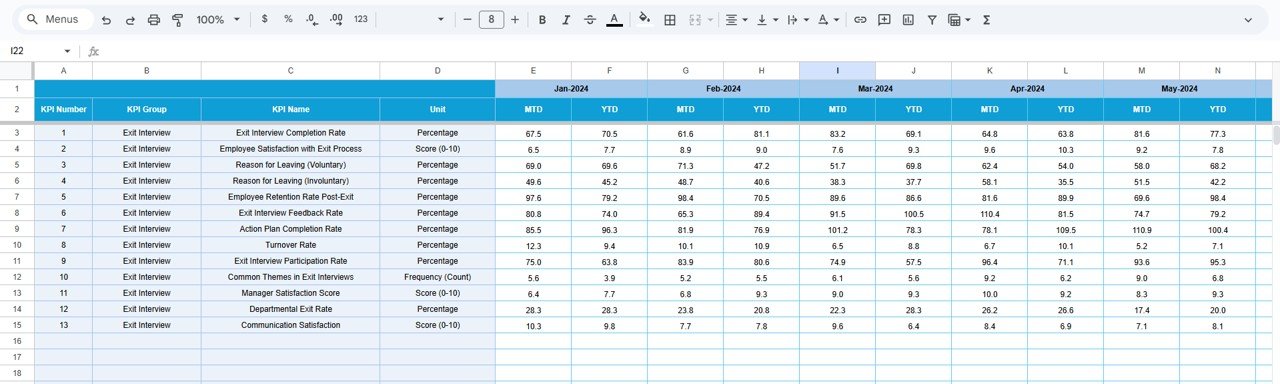
📅 5. Previous Year Sheet – Historical Benchmarking
Add previous year’s exit data to compare turnover performance year-over-year. This provides deeper understanding of long-term improvement or decline.
📚 6. KPI Definition Sheet – Full Reference Library
Includes:
-
KPI Name
-
Group
-
Unit
-
Formula
-
Definition
-
Performance Type
This ensures reporting accuracy and helps new HR team members understand KPIs immediately.
🎯 Who Can Benefit from the Exit Interview KPI Dashboard in Google Sheets
👩💼 HR Leaders & Talent Managers
Get insights into turnover drivers, manager-related issues, and engagement decline.
👥 Department Managers
Identify trends and take action to reduce exits within their teams.
📈 Senior Leadership
Use the dashboard to plan strategic retention initiatives.
🌍 Multi-Location Companies
Compare exit trends across offices and departments.
🏢 Organizations of All Sizes
Ideal for startups, SMEs, and large enterprises.
Click here to read the Detailed blog post
Watch the step-by-step video Demo:


Reviews
There are no reviews yet.