
Managing a business budget can quickly become overwhelming—especially when expenses rise, departments expand, and decisions need to be taken fast. Without a structured system, teams struggle to compare actual spending with planned numbers, monitor variances, and predict future financial needs. That’s exactly why the Budget Forecasting Dashboard in Excel is the perfect ready-to-use solution. This powerful template gives managers, finance teams, and business owners a complete overview of expenses, forecasts, and financial performance—all in one clean, automated dashboard.
This Excel-based tool transforms raw data into crystal-clear insights with the help of dynamic charts, automated formulas, and interactive slicers. Whether you want to check department-wise spending, analyze categories, or track monthly financial trends, this dashboard gives you complete visibility and total control.
✨ Key Features of the Budget Forecasting Dashboard in Excel
The Budget Forecasting Dashboard is designed to make financial analysis simple, visual, and actionable. Here’s what makes it powerful:
📊 Pre-Built Overview Sheet
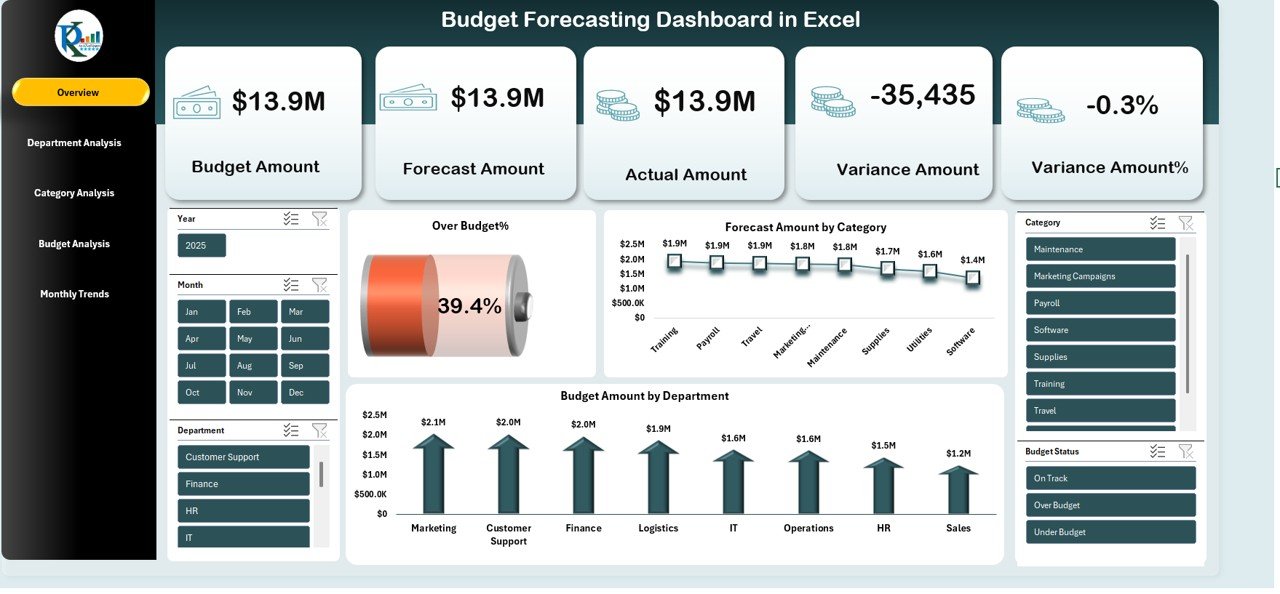
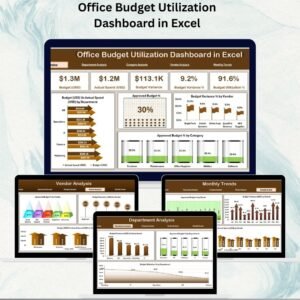
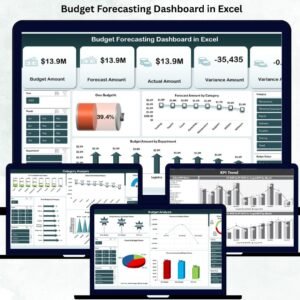
Get a snapshot of your budget performance with key metrics like Total Cost, Budget Amount, Forecast Amount, Actual Amount, Variance %, and Over Budget %.
🏢 Department-Wise Analysis
Understand how each department spends money and identify which areas are performing well—or crossing limits.
📂 Category-Based Insights
Track budgets for categories like travel, payroll, marketing, utilities, equipment, and more.
📅 Monthly Trends View
Analyze spending patterns month-by-month with over-budget %, under-budget %, and forecast charts.
🔍 Interactive Slicers
Filter data by Month, Category, Department, and Budget Status for deeper analysis.
⚡ Automatic Data Updates
Modify data once, and all visuals refresh instantly using Excel formulas such as SUMIFS, IF, AVERAGE, Forecast functions, and variance calculations.
🎨 Clean, Modern, and Easy to Use Layout
A professional design that gives your team a smooth financial analysis experience.
📦 What’s Inside the Budget Forecasting Dashboard
This digital product includes multiple well-structured sheets, each built to give a different layer of financial clarity.
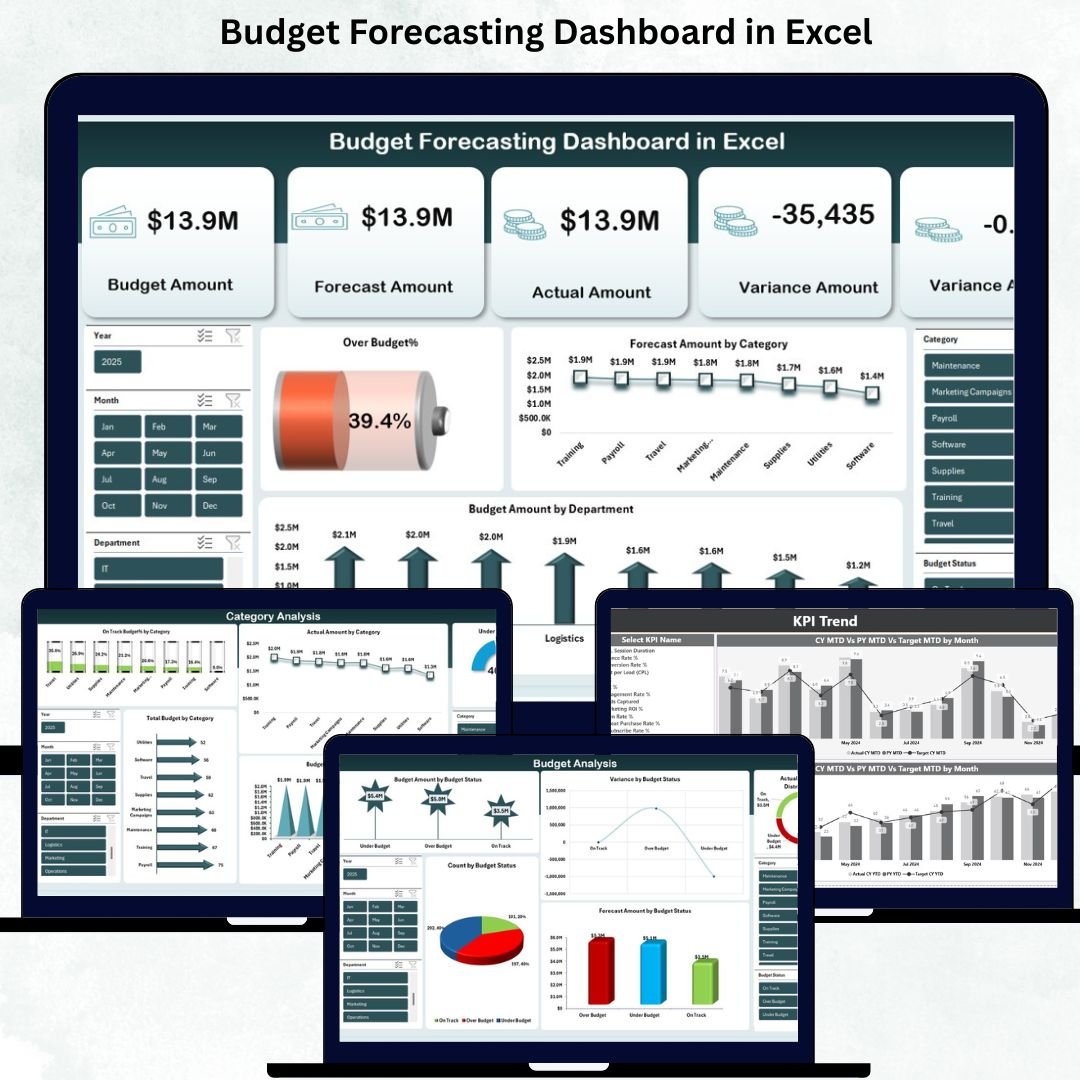
1️⃣ Overview Sheet
Your main control center showing KPIs, financial cards, and key charts:
-
Forecast Amount by Category
-
Budget Amount by Department
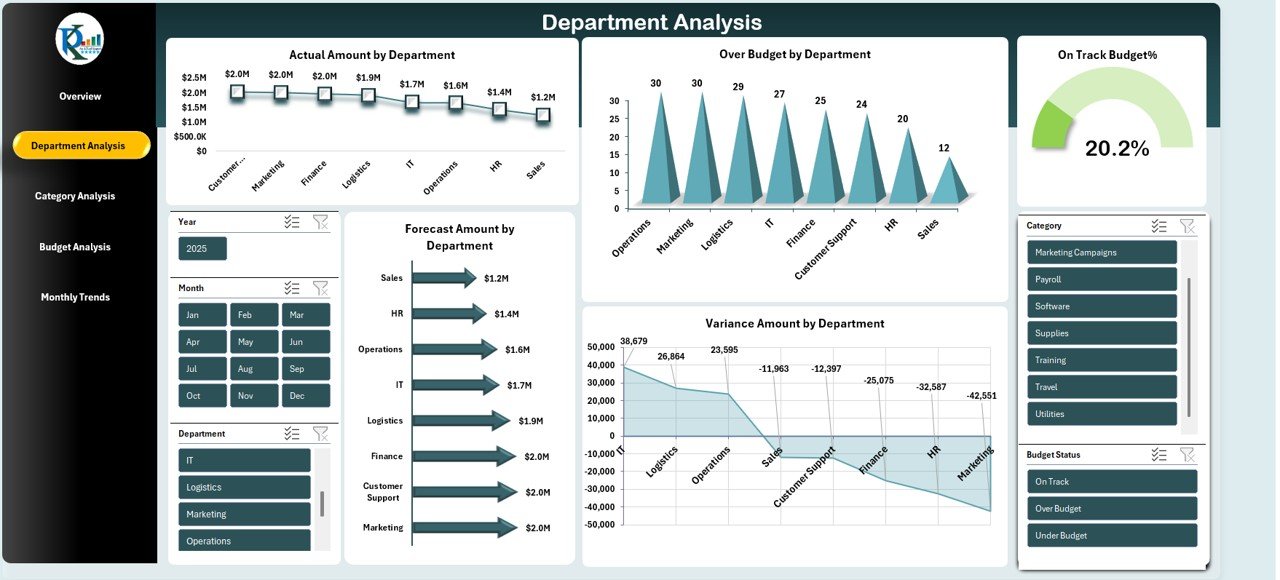
2️⃣ Department Analysis Sheet
Evaluate department-level performance with visuals like:
-
Actual Amount by Department
-
Forecast Amount by Department
-
Over Budget Departments
-
Variance Amount by Department
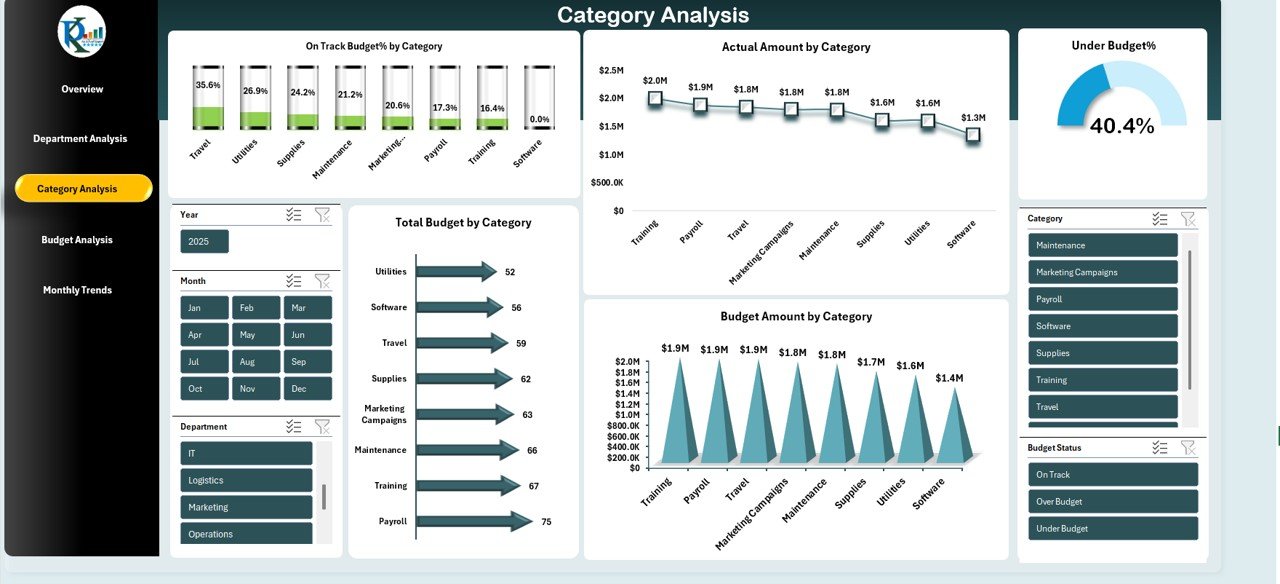
3️⃣ Category Analysis Sheet
Perfect for understanding spending across categories:
-
On Track Budget %
-
Total Budget by Category
-
Actual vs. Budget Comparison
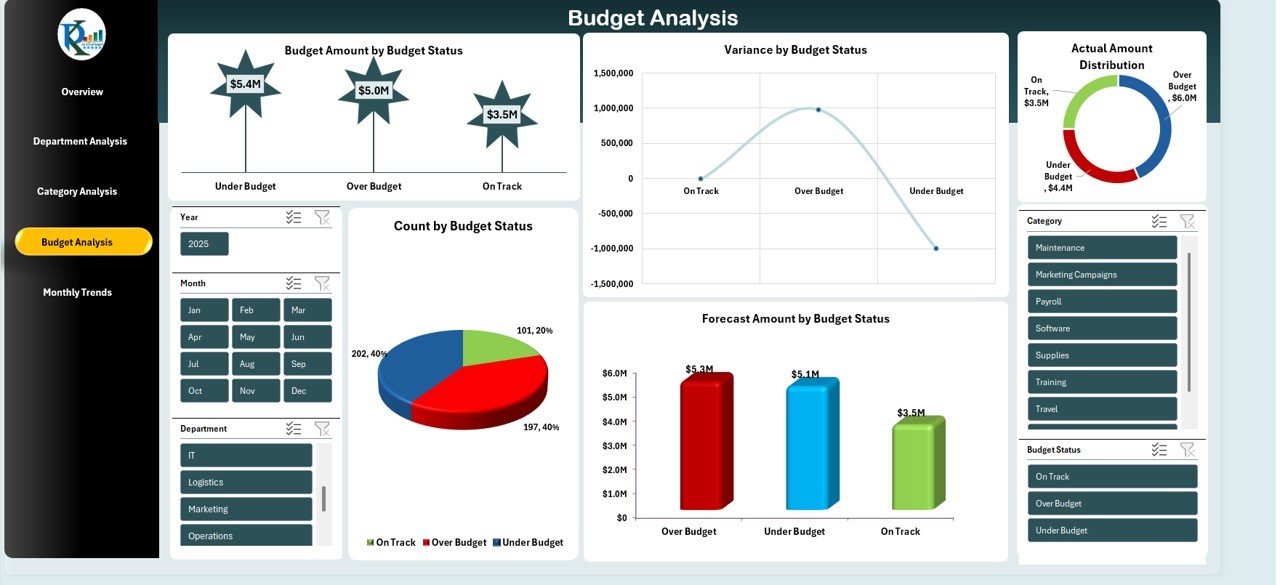
4️⃣ Budget Status Analysis Sheet
Review items based on statuses such as On Track, Under Budget, Over Budget, and Pending.
5️⃣ Monthly Trends Sheet
Stay ahead with monthly KPIs including:
-
Over Budget %
-
Forecast Amount
-
Under Budget %
-
Actual Amount
-
On Track Percentage
Each sheet is interconnected with formulas, making the dashboard flow seamlessly from one view to another.
🧭 How to Use the Budget Forecasting Dashboard
Using this dashboard is extremely simple—even for beginners.
Step 1: Enter Your Budget
Fill the Budget Amount column for each department and category.
Step 2: Update Actual Spending
Record real expenses regularly.
Step 3: Add Forecast Amounts
Predict upcoming spending based on business needs.
Step 4: Review KPIs & Charts
Study trends, variances, and performance indicators.
Step 5: Take Financial Action
Identify over-budget areas and optimize future planning.
The entire system runs without macros or coding—Excel does the work for you.
🎯 Who Can Benefit from This Budget Forecasting Dashboard?
This dashboard is ideal for:
✔ Finance Teams
Track and compare financial performance with ease.
✔ Business Owners & CEOs
Monitor overall budget health and predict future financial movements.
✔ Project Managers
Analyze project expenses, identify overspending, and plan efficiently.
✔ HR, Operations, Marketing & Admin Teams
Evaluate department-level spending and improve budget planning.
✔ Accountants & Analysts
Get structured, clean financial insights for reporting and presentations.
Whether you manage a small business or a large enterprise, this dashboard becomes your daily financial control system.
### Click here to read the Detailed blog post
Watch the step-by-step video tutorial:


Reviews
There are no reviews yet.