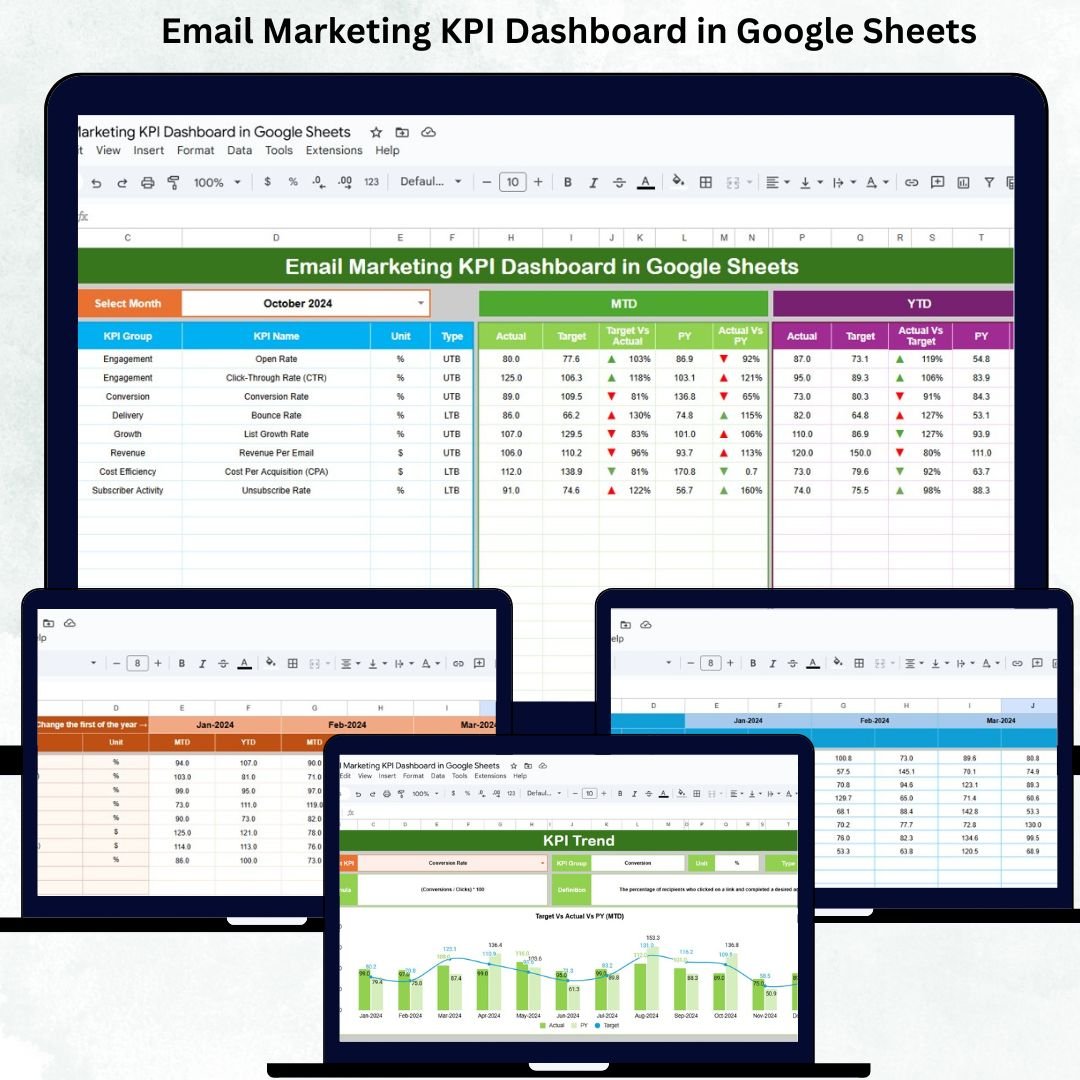
In today’s competitive marketing landscape, email campaigns are a vital channel for engagement, conversions, and revenue. However, without a clear view of campaign performance, it’s easy to overspend, underperform, or miss key opportunities. The Email Marketing KPI Dashboard in Google Sheets is a ready-to-use, automated template that enables marketers to track, analyze, and optimize email campaigns with ease.Email Marketing KPI Dashboard in Google Sheets
This dashboard provides insights at both MTD (Month-to-Date) and YTD (Year-to-Date) levels. It compares actual performance against targets and previous year data while providing conditional formatting to instantly visualize trends. By centralizing all email marketing metrics in one sheet, your team can make faster, data-driven decisions and maximize ROI.Email Marketing KPI Dashboard in Google Sheets
✨ Key Features of the Email Marketing KPI Dashboard in Google Sheets
This dashboard contains six fully automated worksheets, each serving a specific purpose:Email Marketing KPI Dashboard in Google Sheets
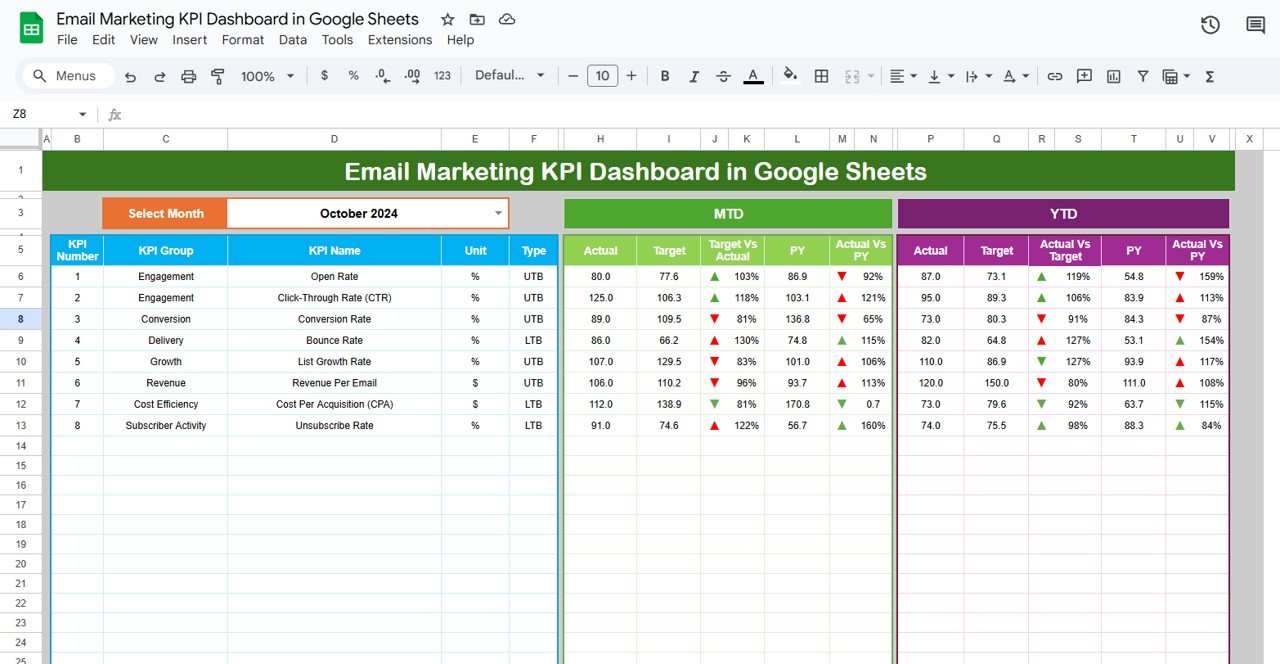
🔹 Dashboard Sheet – Main Performance View
-
Month Selector (D3) allows you to view data for any period.
-
Displays MTD and YTD actuals, targets, and previous year data.
-
Conditional formatting arrows highlight performance improvement or decline.
-
Enables quick comparisons: Target vs Actual and PY vs Actual.
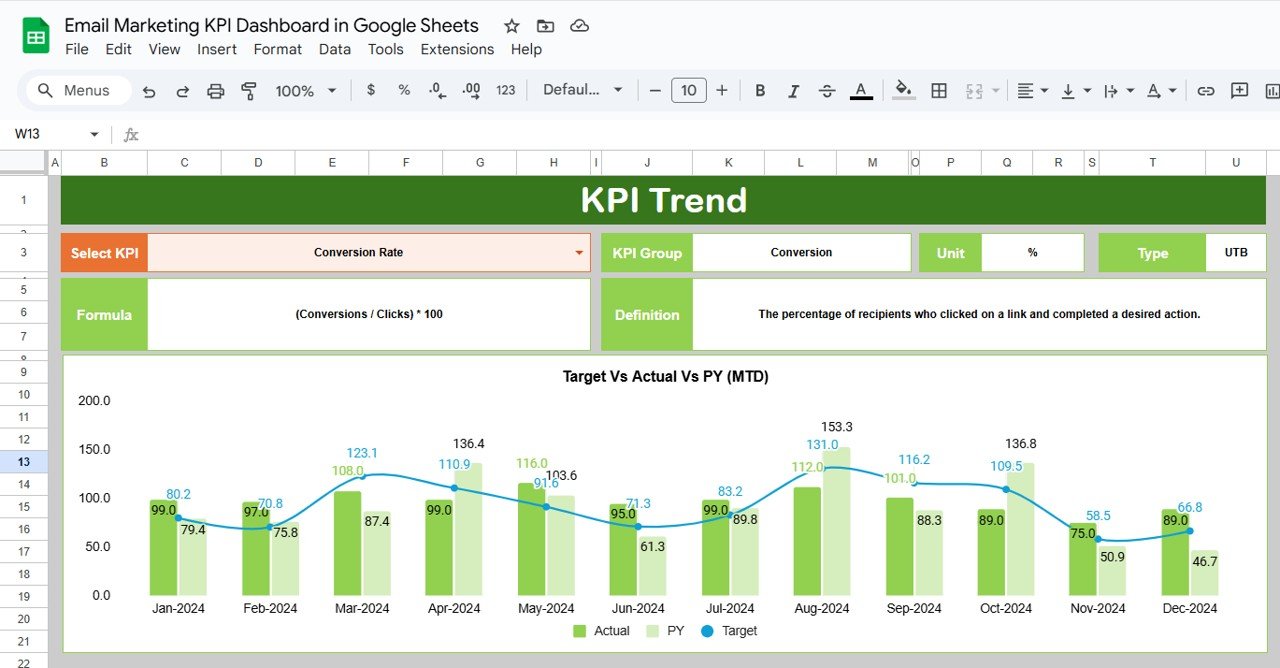
🔹 KPI Trend Sheet – Track Metrics Over Time
-
Select any KPI using C3 dropdown.
-
Shows KPI Group, Unit, Type (Lower-the-better / Upper-the-better), Formula, and Definition.
-
Visual trend charts display performance patterns for each KPI over time.
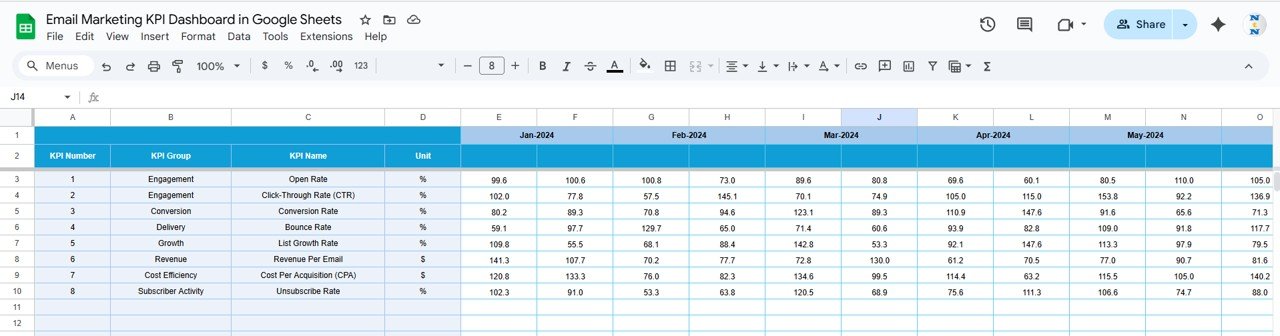
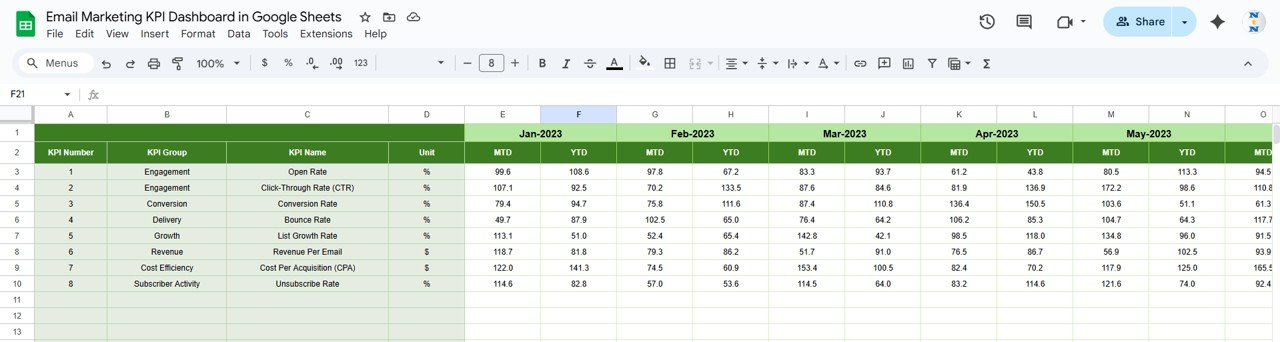
🔹 Actual Numbers Sheet – Capture Real Performance
-
Input monthly MTD and YTD values for each KPI.
-
Selecting the month in E1 updates the dashboard automatically.
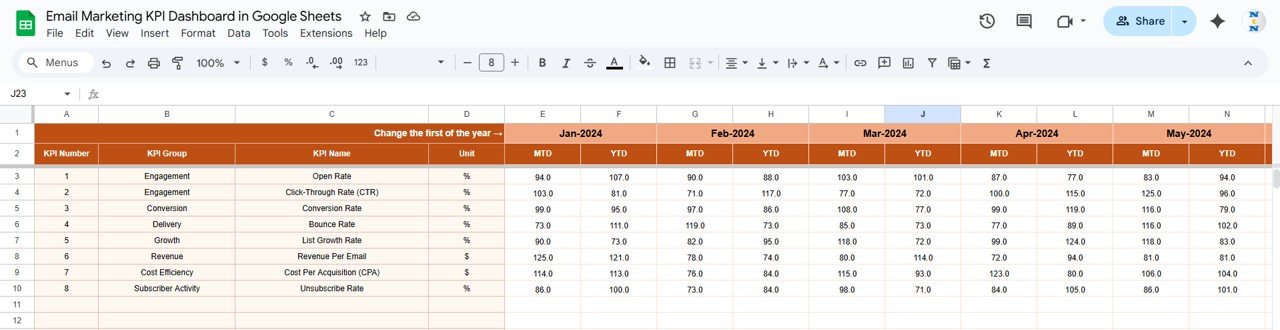
🔹 Target Sheet – Set Goals for Your Campaigns
-
Input monthly and yearly targets (MTD & YTD).
-
Enables automatic comparison with actual results to assess performance gaps.
🔹 Previous Year Numbers Sheet – Year-Over-Year Insights
-
Enter previous year data to analyze YoY growth and trends.
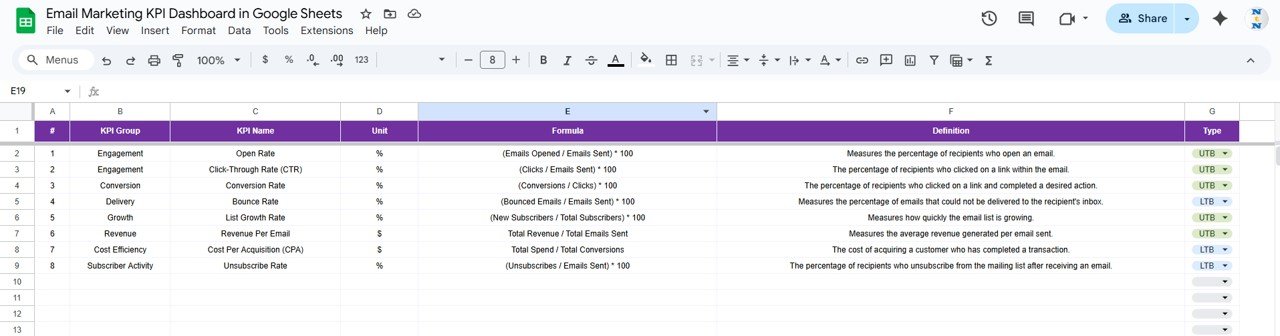
🔹 KPI Definition Sheet – Master Metrics Repository
-
Maintain KPI metadata including Name, Group, Unit, Formula, and Definition.
-
Ensures clarity, consistency, and easy onboarding for new team members.
📊 Advantages of Using This Dashboard
-
Centralized Metrics – Track all important email KPIs in one place.
-
Real-Time Analysis – Select any month to instantly update visuals.
-
Data-Driven Decisions – Compare MTD, YTD, and PY performance against targets.
-
Conditional Formatting – Quickly identify areas of improvement or success.
-
KPI Trend Monitoring – Understand trends and optimize campaigns over time.
-
Lower/Upper Better Insights – Know which metrics to maximize or minimize.
-
Flexible & Collaborative – Cloud-based Google Sheets allows team access anytime, anywhere.
🔍 Opportunities Created by This Dashboard
-
Automate Data Import – Connect email platforms via API for real-time updates.
-
Add Predictive KPIs – Forecast opens, clicks, and conversions for the upcoming period.
-
Segment Analysis – Track KPIs by audience segment, location, or behavior.
-
Integrate Revenue Impact – Link email performance to sales and ROI metrics.
-
Visual Enhancements – Add dynamic charts, sparklines, or conditional color scales.
🛠️ Best Practices for Email Marketing KPI Tracking
-
Update KPIs regularly to ensure accurate reporting.
-
Clearly define KPI formulas in the KPI Definition sheet.
-
Monitor both MTD and YTD to track short- and long-term trends.
-
Focus on metrics marked Upper/Lower Better to identify improvement areas.
-
Share the dashboard across Marketing, Sales, and Analytics teams.
-
Use conditional formatting to highlight underperformance or overperformance.
-
Audit your data periodically to maintain accuracy and reliability.
👥 Who Can Benefit from This Dashboard
-
Marketing Managers: Track campaign efficiency and optimize email performance.
-
Email Marketers: Visualize open rates, clicks, conversions, and revenue per email.
-
Analytics Teams: Measure ROI, segment performance, and identify trends.
-
Finance Teams: Monitor ad spend, budget allocation, and marketing ROI.
-
Digital Agencies: Deliver client-ready reports with clear insights.
Click here to read the Detailed blog post
Watch the step-by-step video Demo:
Visit our YouTube channel to learn step-by-step video tutorials
Visit our YouTube channel to learn step-by-step video tutorials


Reviews
There are no reviews yet.