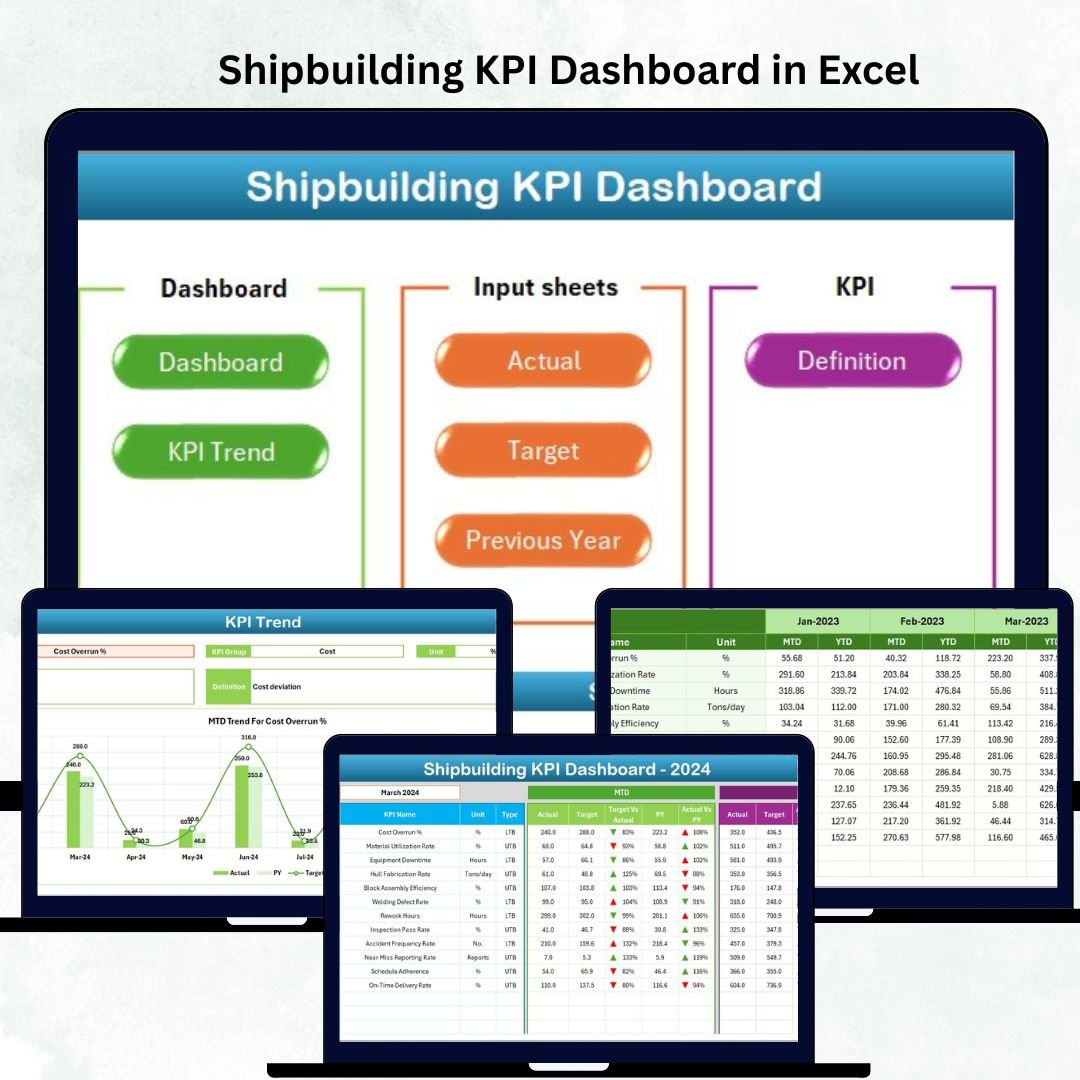
The shipbuilding industry handles some of the world’s most complex engineering tasks—from massive hull construction to precision assembly, steel fabrication, material handling, safety management, and multi-stage production workflows. With rising pressure on delivery timelines, cost control, safety standards, and productivity, shipyards need a powerful and organized way to track key performance indicators across the entire project lifecycle.
The Shipbuilding KPI Dashboard in Excel solves this challenge perfectly. It brings all critical metrics into a single, visual, and easy-to-understand Excel interface. With MTD (Month-to-Date), YTD (Year-to-Date), Target, and Previous Year comparisons, this dashboard helps teams monitor their performance, identify risks early, and make faster data-driven decisions without relying on expensive tools.
Whether you’re managing naval projects, merchant vessels, offshore structures, or marine repairs, this ready-to-use Excel dashboard gives managers, engineers, planners, and safety teams everything they need to evaluate shipyard performance with absolute clarity.
✨ Key Features of the Shipbuilding KPI Dashboard in Excel
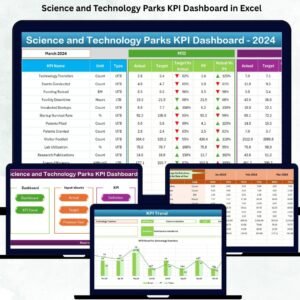
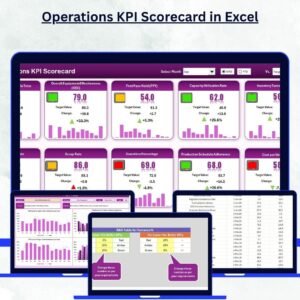
📊 Dashboard Sheet – The Central Control Panel
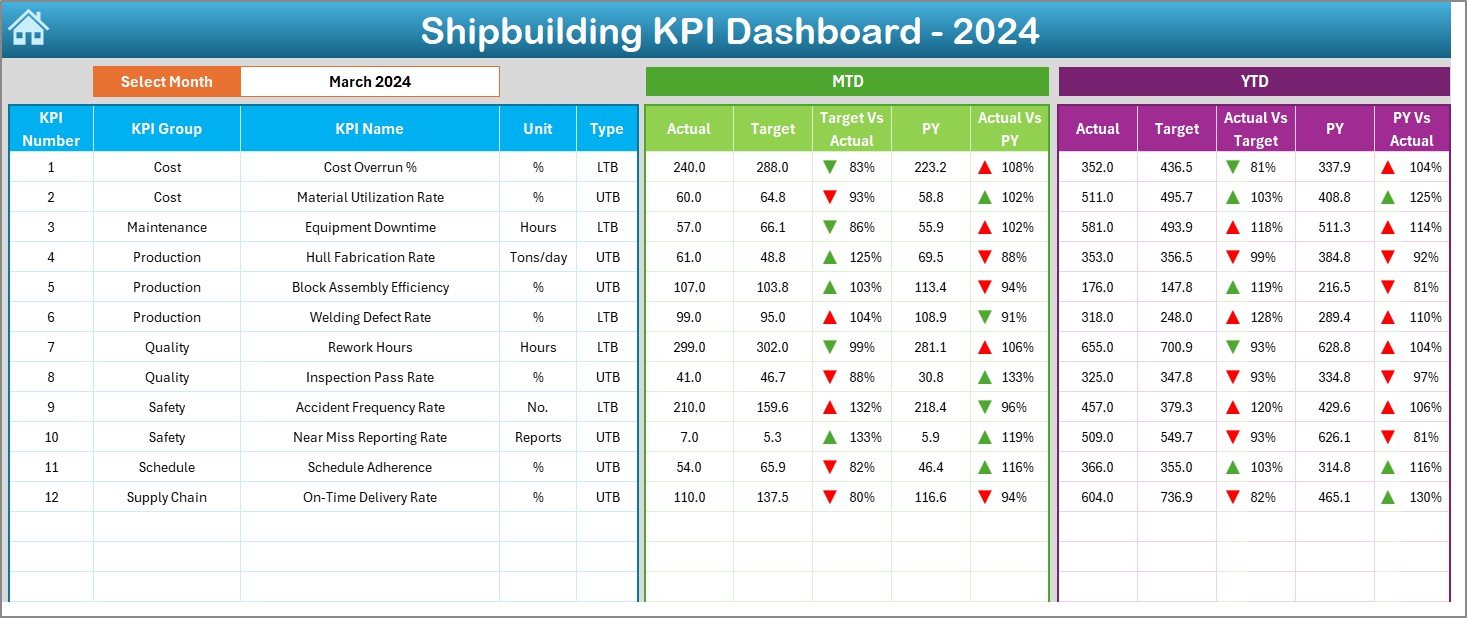
The Dashboard Sheet is the heart of the entire file. It shows all KPI performance updates in a clean and visual structure.
Key elements include:
-
🔽 Month Selector (Cell D3) – Choose any reporting month and the full dashboard updates instantly.
-
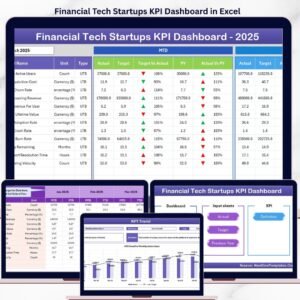
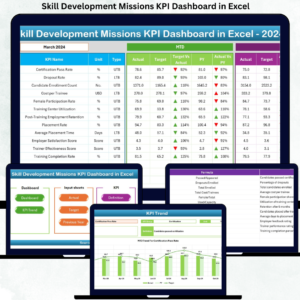
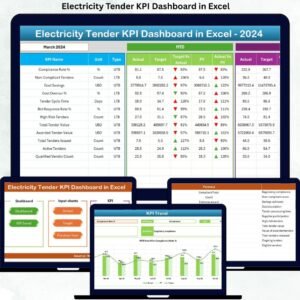
📈 MTD Performance Metrics – Actual MTD, Target MTD, Previous Year MTD, Target vs Actual %, and PY vs Actual %.
-
📉 YTD Performance Metrics – Actual YTD, Target YTD, Previous Year YTD, Target vs Actual %, and PY vs Actual %.
-
🚦 Visual Indicators –
-
Green ▲ arrows: Strong performance
-
Red ▼ arrows: Negative performance
-
This sheet allows teams to evaluate production status, delays, resource performance, and quality indicators in seconds.
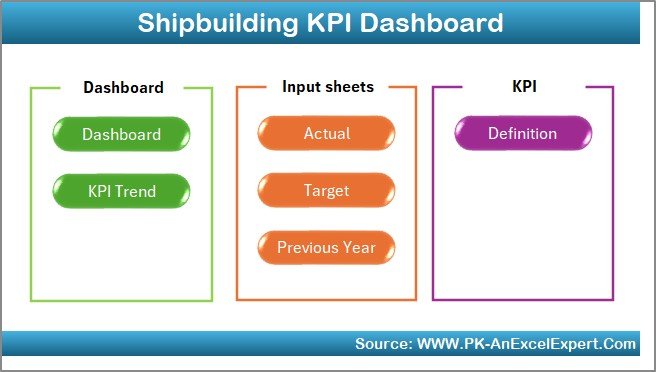
📘 What’s Inside the Shipbuilding KPI Dashboard in Excel
1️⃣ Home Sheet – Fast Navigation
A simple index containing six navigation buttons that allow instant movement across sheets. Ideal for busy shipyard environments.
2️⃣ Dashboard Sheet – Complete KPI Monitoring
This visual dashboard summarizes shipbuilding performance for quick reviews and management presentations.
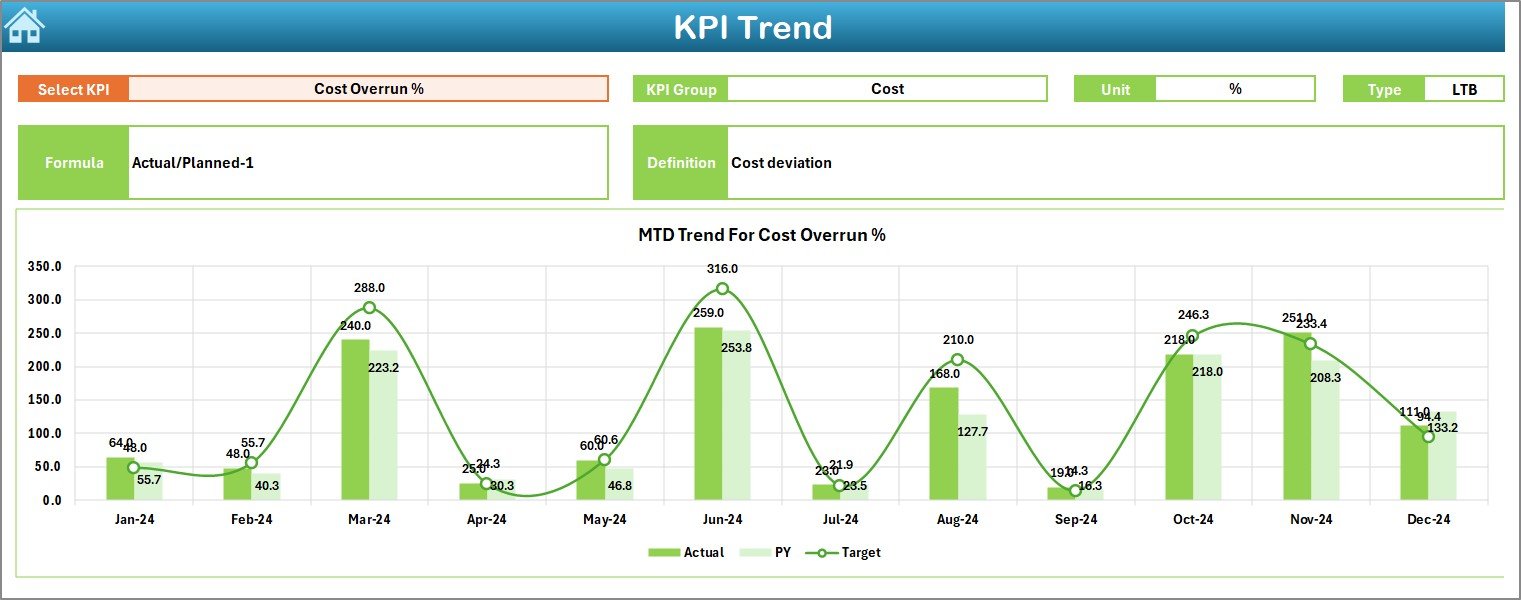
3️⃣ KPI Trend Sheet – Track Long-Term Progress
Shipbuilding projects often run for months or years. The Trend Sheet helps analyze:
-
MTD Actual vs Target vs Previous Year
-
YTD Actual vs Target vs Previous Year
Includes:
-
KPI selector in Cell C3
-
KPI metadata (Group, Unit, Type, Formula, Definition)
-
Two dynamic trend charts
Perfect for identifying recurring delays, improvement patterns, and productivity changes.
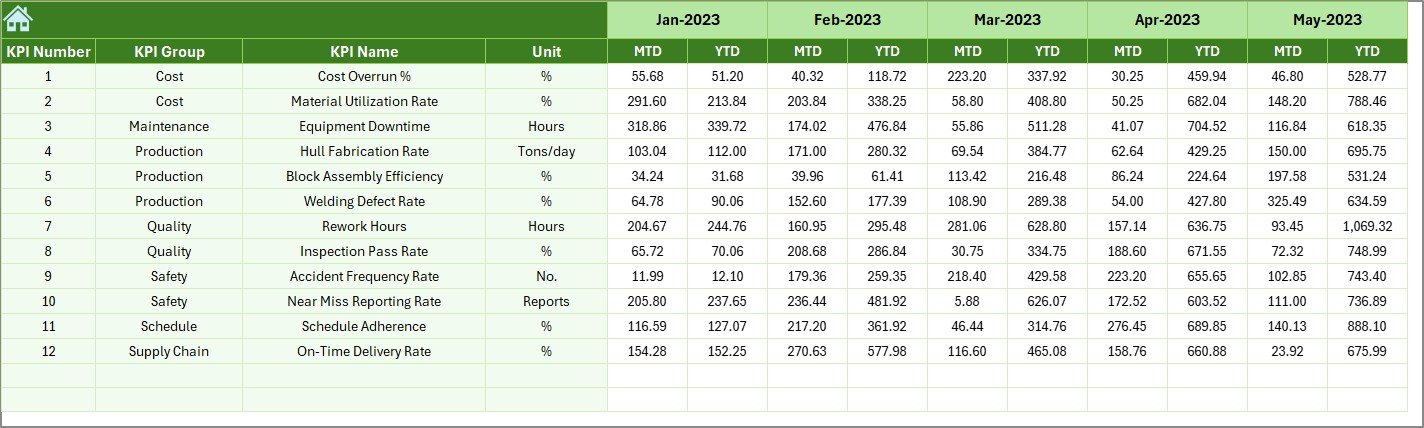
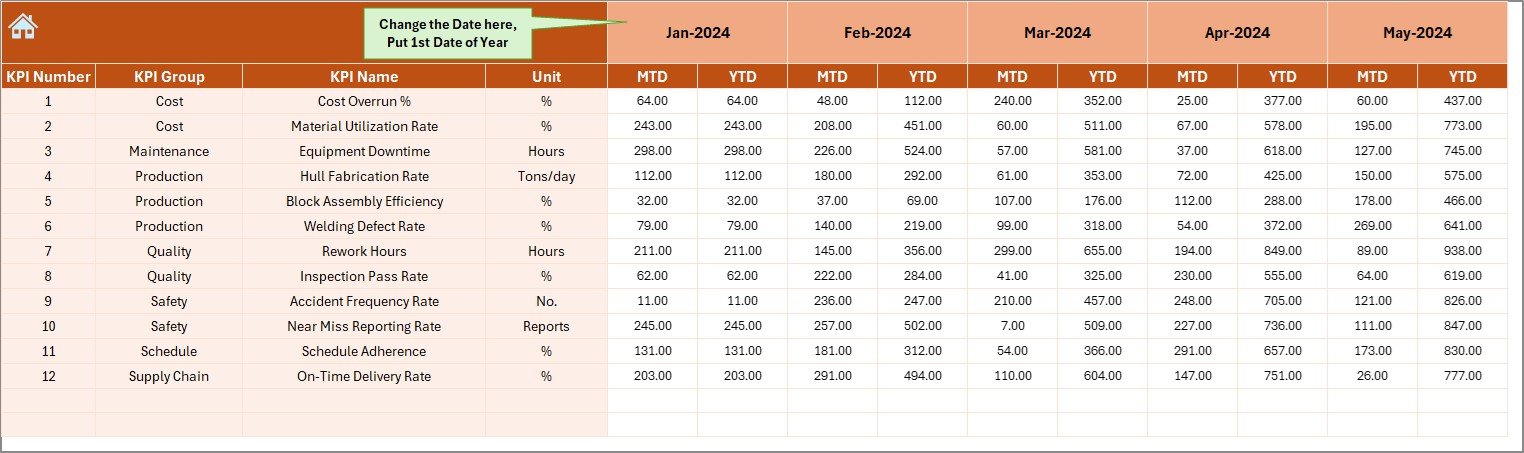
4️⃣ Actual Numbers Sheet – Enter Current Performance Data
-
Input MTD and YTD values monthly
-
Select reporting month in Cell E1
-
Dashboard auto-updates after data entry
This sheet is the engine that drives the entire reporting system.
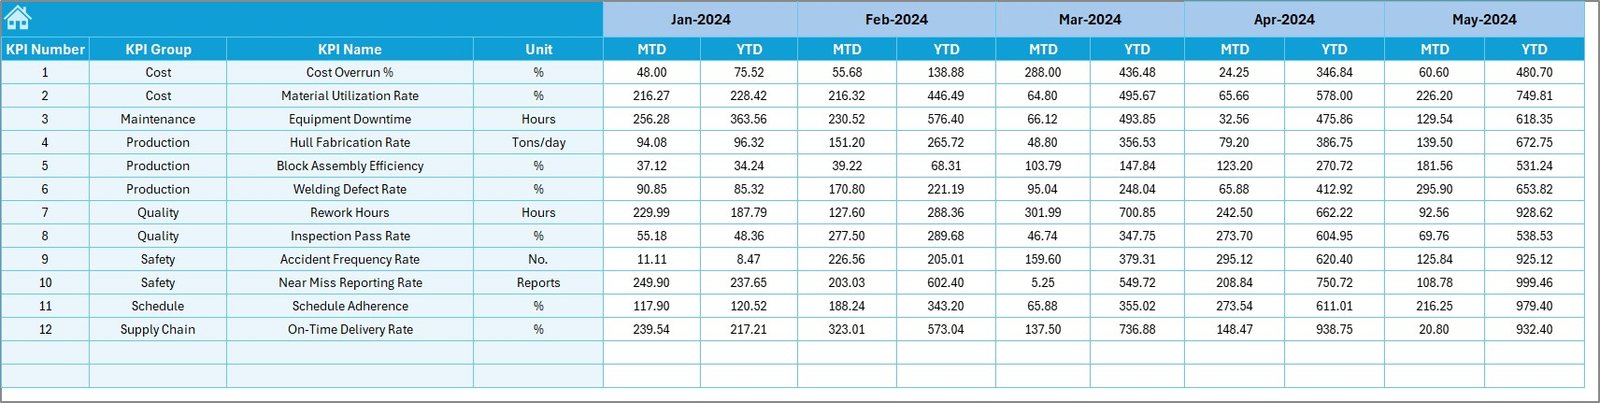
5️⃣ Target Sheet – Set Monthly & Yearly Targets
Record the expected MTD/YTD targets for each KPI.
This allows accurate comparison between planned vs actual performance.
6️⃣ Previous Year Numbers Sheet – Historical Benchmarking
Enter previous year MTD/YTD values to compare:
-
📌 CY vs PY (MTD)
-
📌 CY vs PY (YTD)
A must-have for long-term improvement tracking.
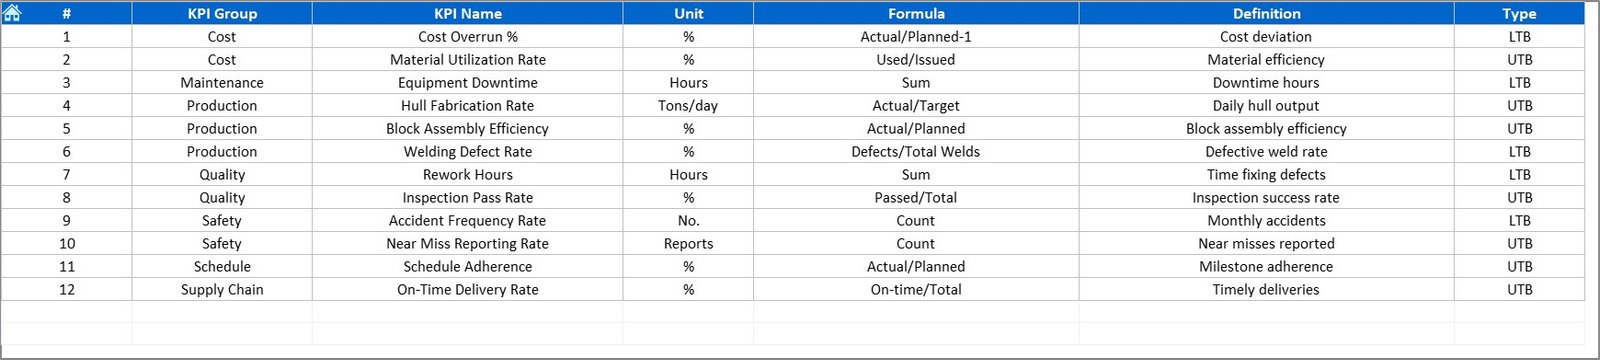
7️⃣ KPI Definition Sheet – Standardized KPI Glossary
Enter details for every KPI:
-
KPI Name
-
KPI Group
-
Unit
-
Formula
-
KPI Definition
This ensures complete clarity across engineering, planning, safety, and production teams.
🛠 How to Use the Shipbuilding KPI Dashboard in Excel
Step 1: Enter Actual Data
Fill the MTD/YTD numbers in the Actual Numbers Sheet.
Step 2: Update Targets
Record monthly and annual target values.
Step 3: Add Previous Year Data
Enter historical MTD/YTD values for comparison.
Step 4: Click “Refresh All”
Update all pivot tables and visuals instantly.
Step 5: Analyze Dashboard & Trends
Use the Dashboard and Trend Sheet to make data-driven operational decisions.
Step 6: Update KPI Definitions
Add or modify KPIs as shipyard processes evolve.
🎯 Who Can Benefit from This Shipbuilding KPI Dashboard
⚙️ Shipyard Operations Managers
Monitor production timelines, cost variance, and performance deviations.
🏗️ Engineering & Planning Teams
Analyze delays, material usage, labor productivity, and workflow bottlenecks.
🧑🏭 Production Supervisors
Track daily, weekly, and monthly work performance.
🦺 Safety Managers
Evaluate incidents, compliance metrics, and safety improvement trends.
📊 Quality Control Teams
Measure defect rates, inspection frequencies, rework hours, and QA performance.
🚢 Government & Naval Project Teams
Track large-scale shipbuilding performance with high accuracy.


Reviews
There are no reviews yet.