In the modern engineering environment, managing multiple projects, teams, and budgets efficiently is essential for organizational success. The Engineering Dashboard in Power BI is a ready-to-use business intelligence solution designed to transform your raw engineering data into clear, interactive visual insights. 📊
Built using Microsoft Power BI, this dynamic dashboard helps engineering managers, project leads, and executives monitor performance, detect bottlenecks, and take data-driven decisions — all in real time.
With five analytical pages covering departments, projects, categories, and monthly performance, this dashboard provides a 360° view of engineering operations, helping you streamline processes and enhance productivity.
🌟 Key Features of the Engineering Dashboard in Power BI
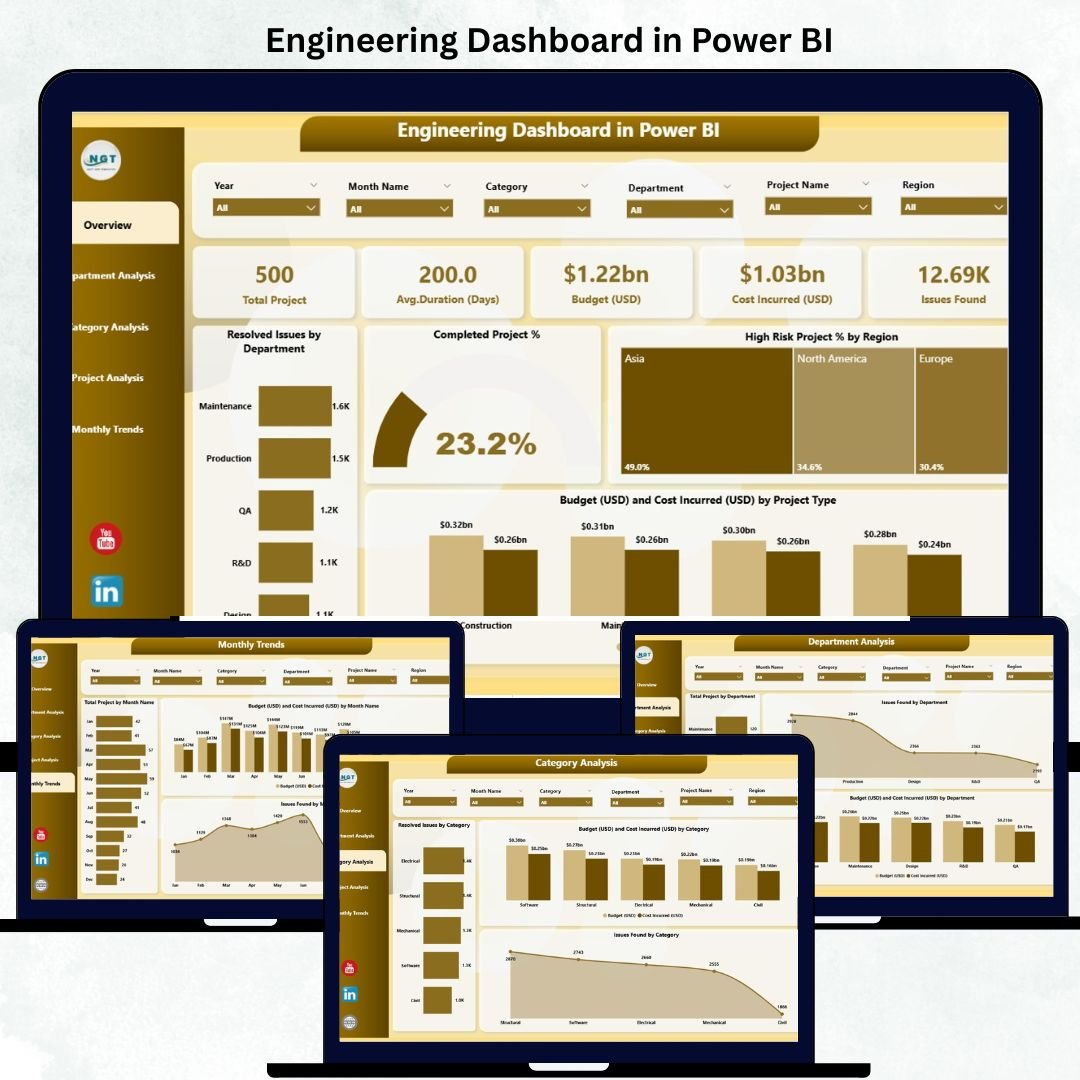
🏠 1️⃣ Overview Page – Centralized Performance Snapshot
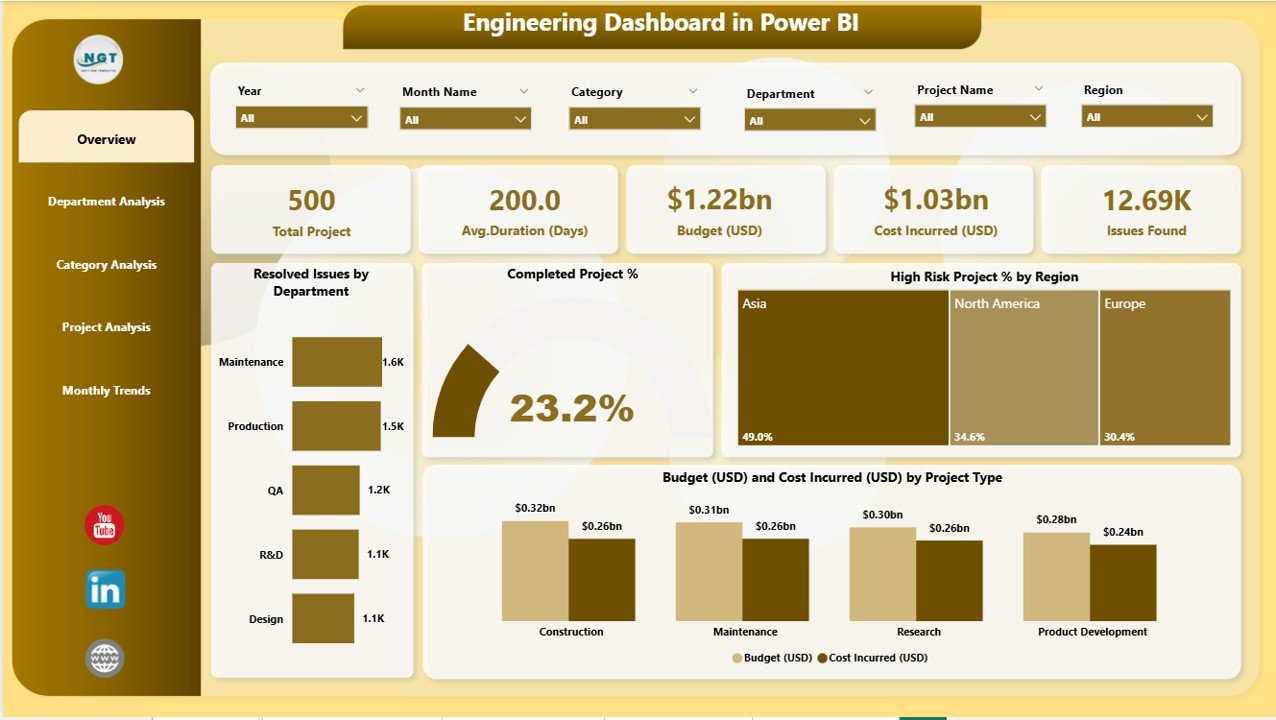
The Overview Page acts as the main control hub for high-level performance tracking.
Visuals include:
-
🔹 Resolved Issues by Department – Identify departments with efficient issue handling.
-
🔹 Completed Project % – Monitor project delivery success rate.
-
🔹 High-Risk Project % by Region – Track risk concentration across regions.
-
🔹 Budget vs Cost Incurred (USD) by Project Type – Compare financial targets vs actuals.
💡 Purpose: Enables leadership to view organization-wide progress at a glance, supported by filters for Month, Department, and Region.
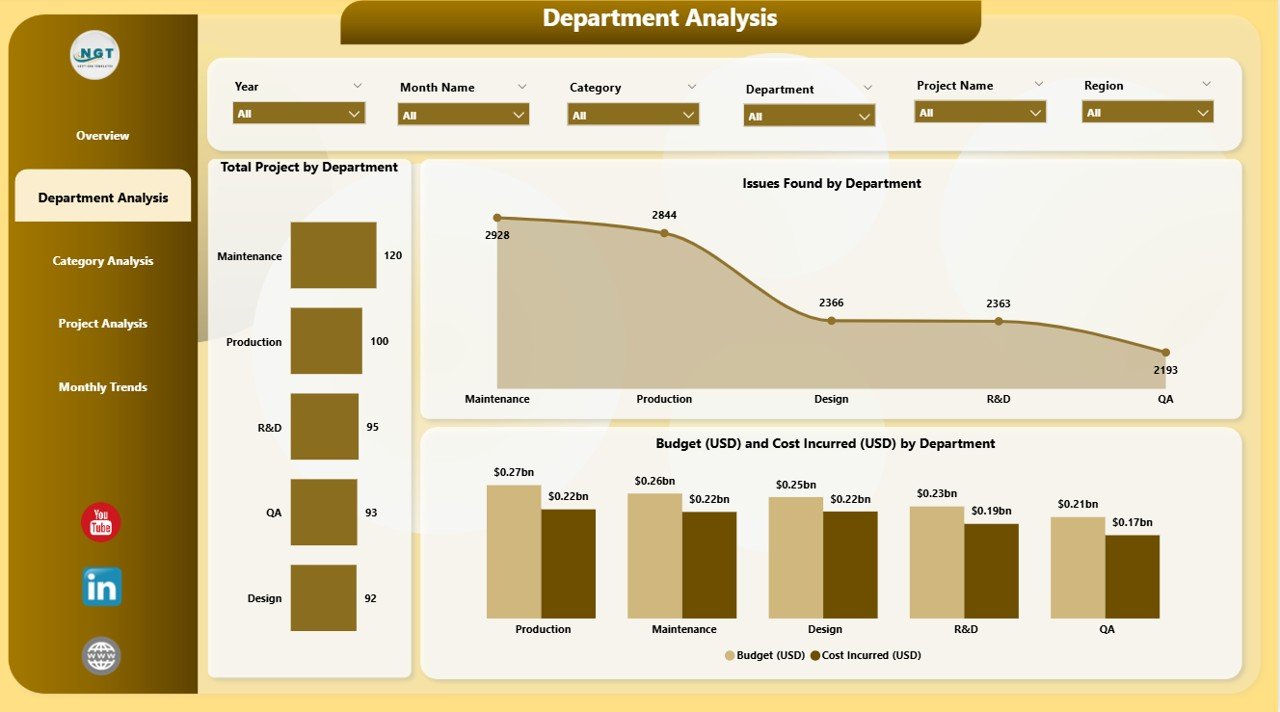
🏢 2️⃣ Department Analysis Page – Focused Departmental Insights
Understand departmental workloads, cost utilization, and performance.
Charts featured:
-
📊 Total Projects by Department
-
🧮 Issues Found by Department
-
💰 Budget (USD) vs Cost Incurred (USD) by Department
🎯 Outcome: Optimize resource allocation and enhance departmental efficiency.
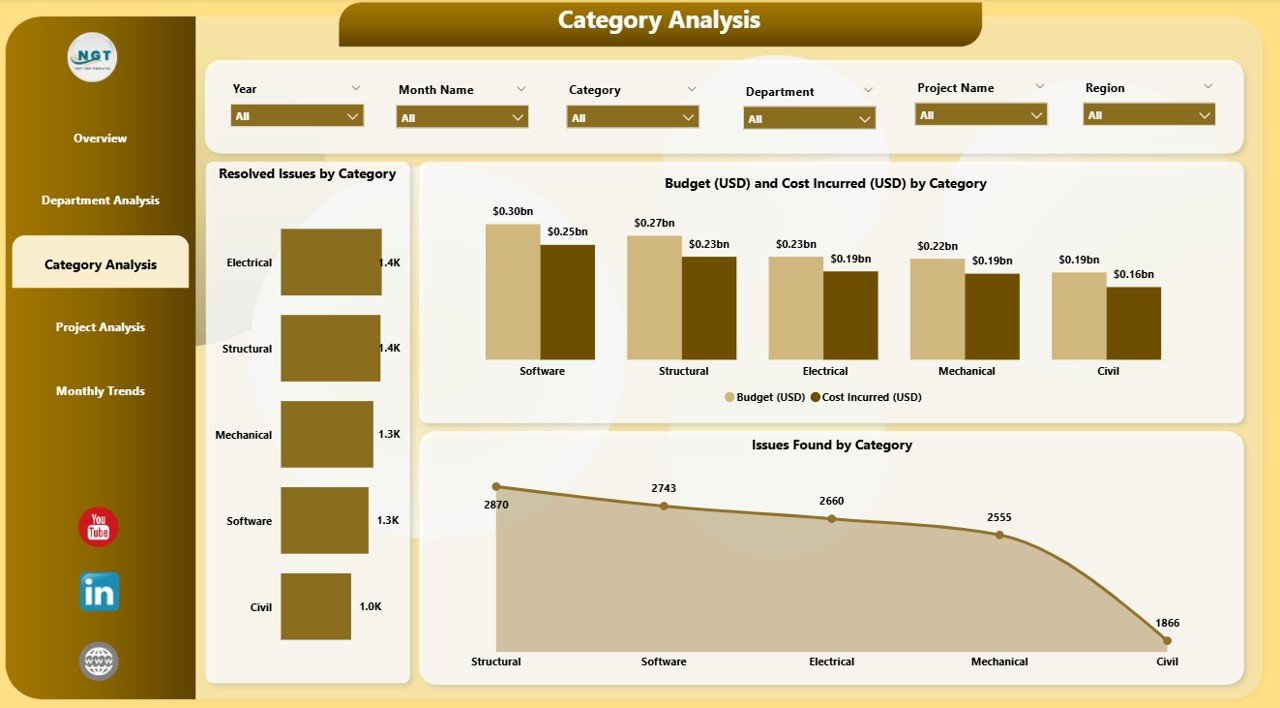
🧩 3️⃣ Category Analysis Page – Process & Issue Breakdown
Analyze performance based on project or issue categories.
Visuals include:
-
🔧 Resolved Issues by Category
-
💵 Budget vs Cost Incurred by Category
-
⚙️ Issues Found by Category
📈 Purpose: Helps quality engineers and operations teams identify process bottlenecks and improvement areas.
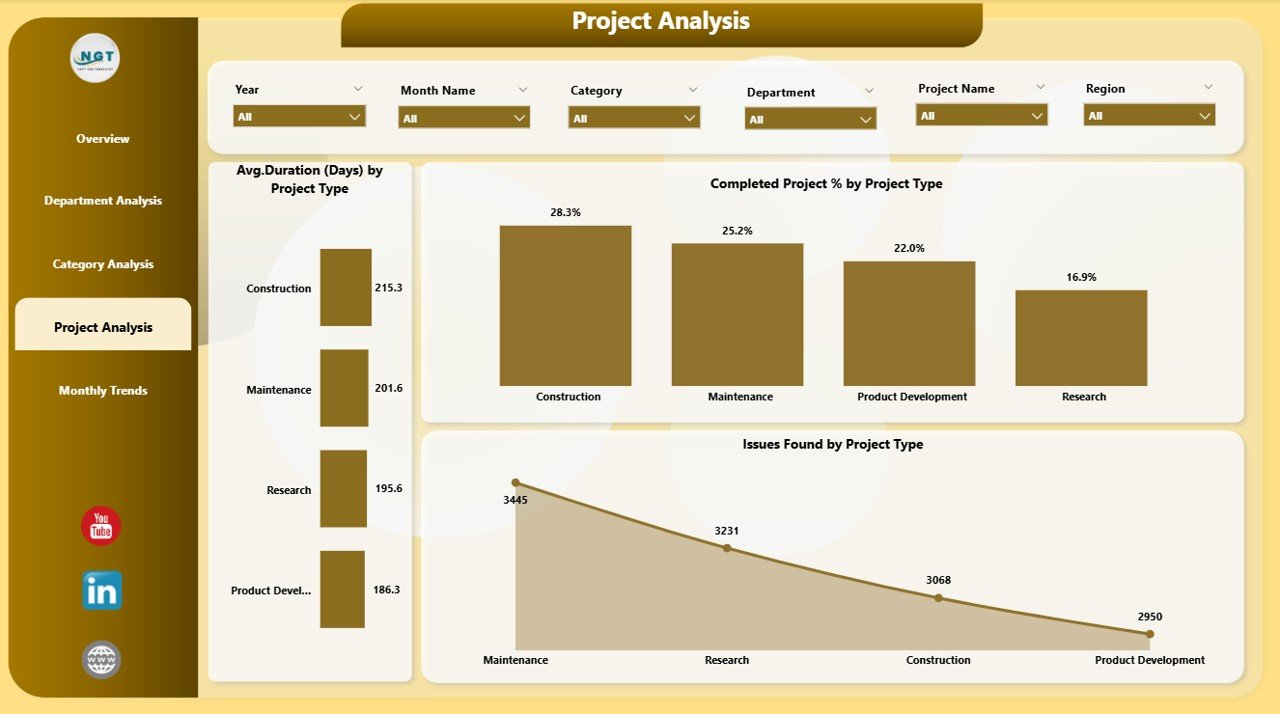
📁 4️⃣ Project Analysis Page – Comparative Project Performance
Track key performance indicators across project types.
Key visuals:
-
🕒 Average Duration (Days) by Project Type
-
✅ Completed Project % by Project Type
-
🧾 Issues Found by Project Type
📊 Benefit: Compare performance across projects to ensure timely delivery and cost control.
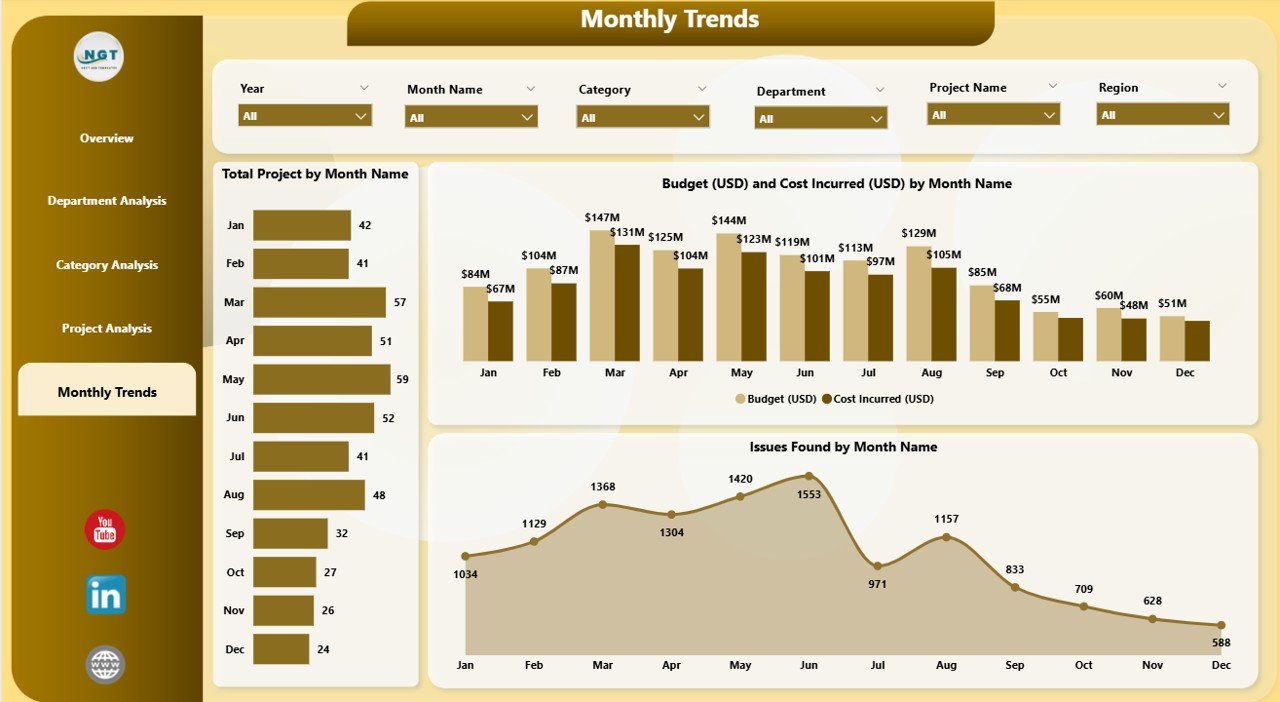
📅 5️⃣ Monthly Trends Page – Monitor Progress Over Time
Gain month-over-month visibility on engineering operations.
Charts displayed:
-
📆 Total Projects by Month
-
💰 Budget vs Cost Incurred by Month
-
⚠️ Issues Found by Month
💡 Purpose: Identify seasonal trends, workload fluctuations, and forecast future performance.
💼 Advantages of the Engineering Dashboard in Power BI
✅ Real-Time Visibility: Always access the most current data with automated updates.
✅ Centralized Tracking: Consolidates performance metrics across departments and projects.
✅ Financial Accuracy: Compare budget vs cost to prevent overruns.
✅ Enhanced Decision-Making: Drill through data for root-cause analysis.
✅ Better Resource Utilization: Allocate manpower and materials effectively.
✅ Reduced Risks: Identify high-risk projects early for corrective action.
✅ Increased Accountability: Promotes transparency and performance ownership.
⚙️ How Power BI Enhances Engineering Analytics
Microsoft Power BI delivers unmatched analytical flexibility for engineering organizations:
-
🔗 Seamless Integration: Connects with Excel, SQL, and cloud databases easily.
-
🎨 Custom Visuals: Create KPIs, bar charts, and trend lines tailored to your data.
-
🤖 AI-Driven Insights: Detect anomalies and forecast outcomes automatically.
-
🧭 User-Friendly Navigation: Interactive slicers and filters for effortless exploration.
-
📈 Scalable: Suitable for small engineering firms and global enterprises alike.
🧠 Best Practices for Using the Dashboard
1️⃣ Define clear KPIs like Completion %, Issue Rate, and Budget Utilization.
2️⃣ Keep your data accurate and updated regularly.
3️⃣ Use consistent formats for currency and dates.
4️⃣ Simplify visuals—each chart should deliver one clear message.
5️⃣ Highlight key metrics using conditional colors or arrows.
6️⃣ Schedule automatic data refresh in Power BI Service.
7️⃣ Collect user feedback for continuous improvement.
🏗️ Applications Across Industries
This Power BI dashboard can be used across multiple engineering sectors:
🏭 Manufacturing: Track production efficiency, maintenance costs, and quality control.
🏗️ Construction: Monitor project timelines, budget usage, and risk management.
🚗 Automotive: Measure defect rates, supplier timelines, and R&D progress.
⚡ Energy & Utilities: Analyze operations, workforce distribution, and financial health.
💻 IT & Software Engineering: Track sprint performance, issue resolution rates, and release metrics.
🧩 How to Use the Engineering Dashboard
1️⃣ Open in Power BI Desktop or Service.
2️⃣ Connect Data Sources (Excel, SQL, etc.) to populate visuals automatically.
3️⃣ Apply Slicers to explore specific time periods or project types.
4️⃣ Navigate Pages via the left-side menu for targeted analysis.
5️⃣ Export Reports as PDFs or snapshots for meetings.
🧱 Customization Options
-
Add or remove KPIs like Resource Utilization % or Quality Defect Rate.
-
Change visuals or color schemes to match your company branding.
-
Adjust currency from USD to local values.
-
Insert company logo and contact details.
🏁 Conclusion
The Engineering Dashboard in Power BI is more than just a data visualization tool — it’s a complete analytics ecosystem for engineering organizations.
With five comprehensive pages and fully interactive visuals, it transforms complex data into strategic insights that drive operational excellence, cost control, and continuous improvement.
From department-level performance to project-level trends, this dashboard ensures every decision is backed by data — empowering your team to engineer success, efficiently and intelligently.
### Click here to read the Detailed blog post
Visit our YouTube channel for step-by-step tutorials


Reviews
There are no reviews yet.