In today’s competitive telecom landscape, retaining existing customers is more profitable than acquiring new ones. The Telecom Customer Retention KPI Dashboard in Power BI is your all-in-one analytics solution to track, visualize, and improve customer loyalty. Designed for telecom professionals, this ready-to-use dashboard transforms raw data into actionable insights, enabling faster decisions and long-term growth.
Built on Power BI with a connected Excel backend, this dashboard helps you monitor key metrics like Churn Rate, Net Promoter Score (NPS), ARPU, and Renewal Rate with just a few clicks. Whether you’re a customer success manager, data analyst, or telecom executive, this tool provides a complete view of your customer health and retention strategy.Telecom Customer Retention KPI Dashboard in Power BI
💡 Key Features of Telecom Customer Retention KPI Dashboard
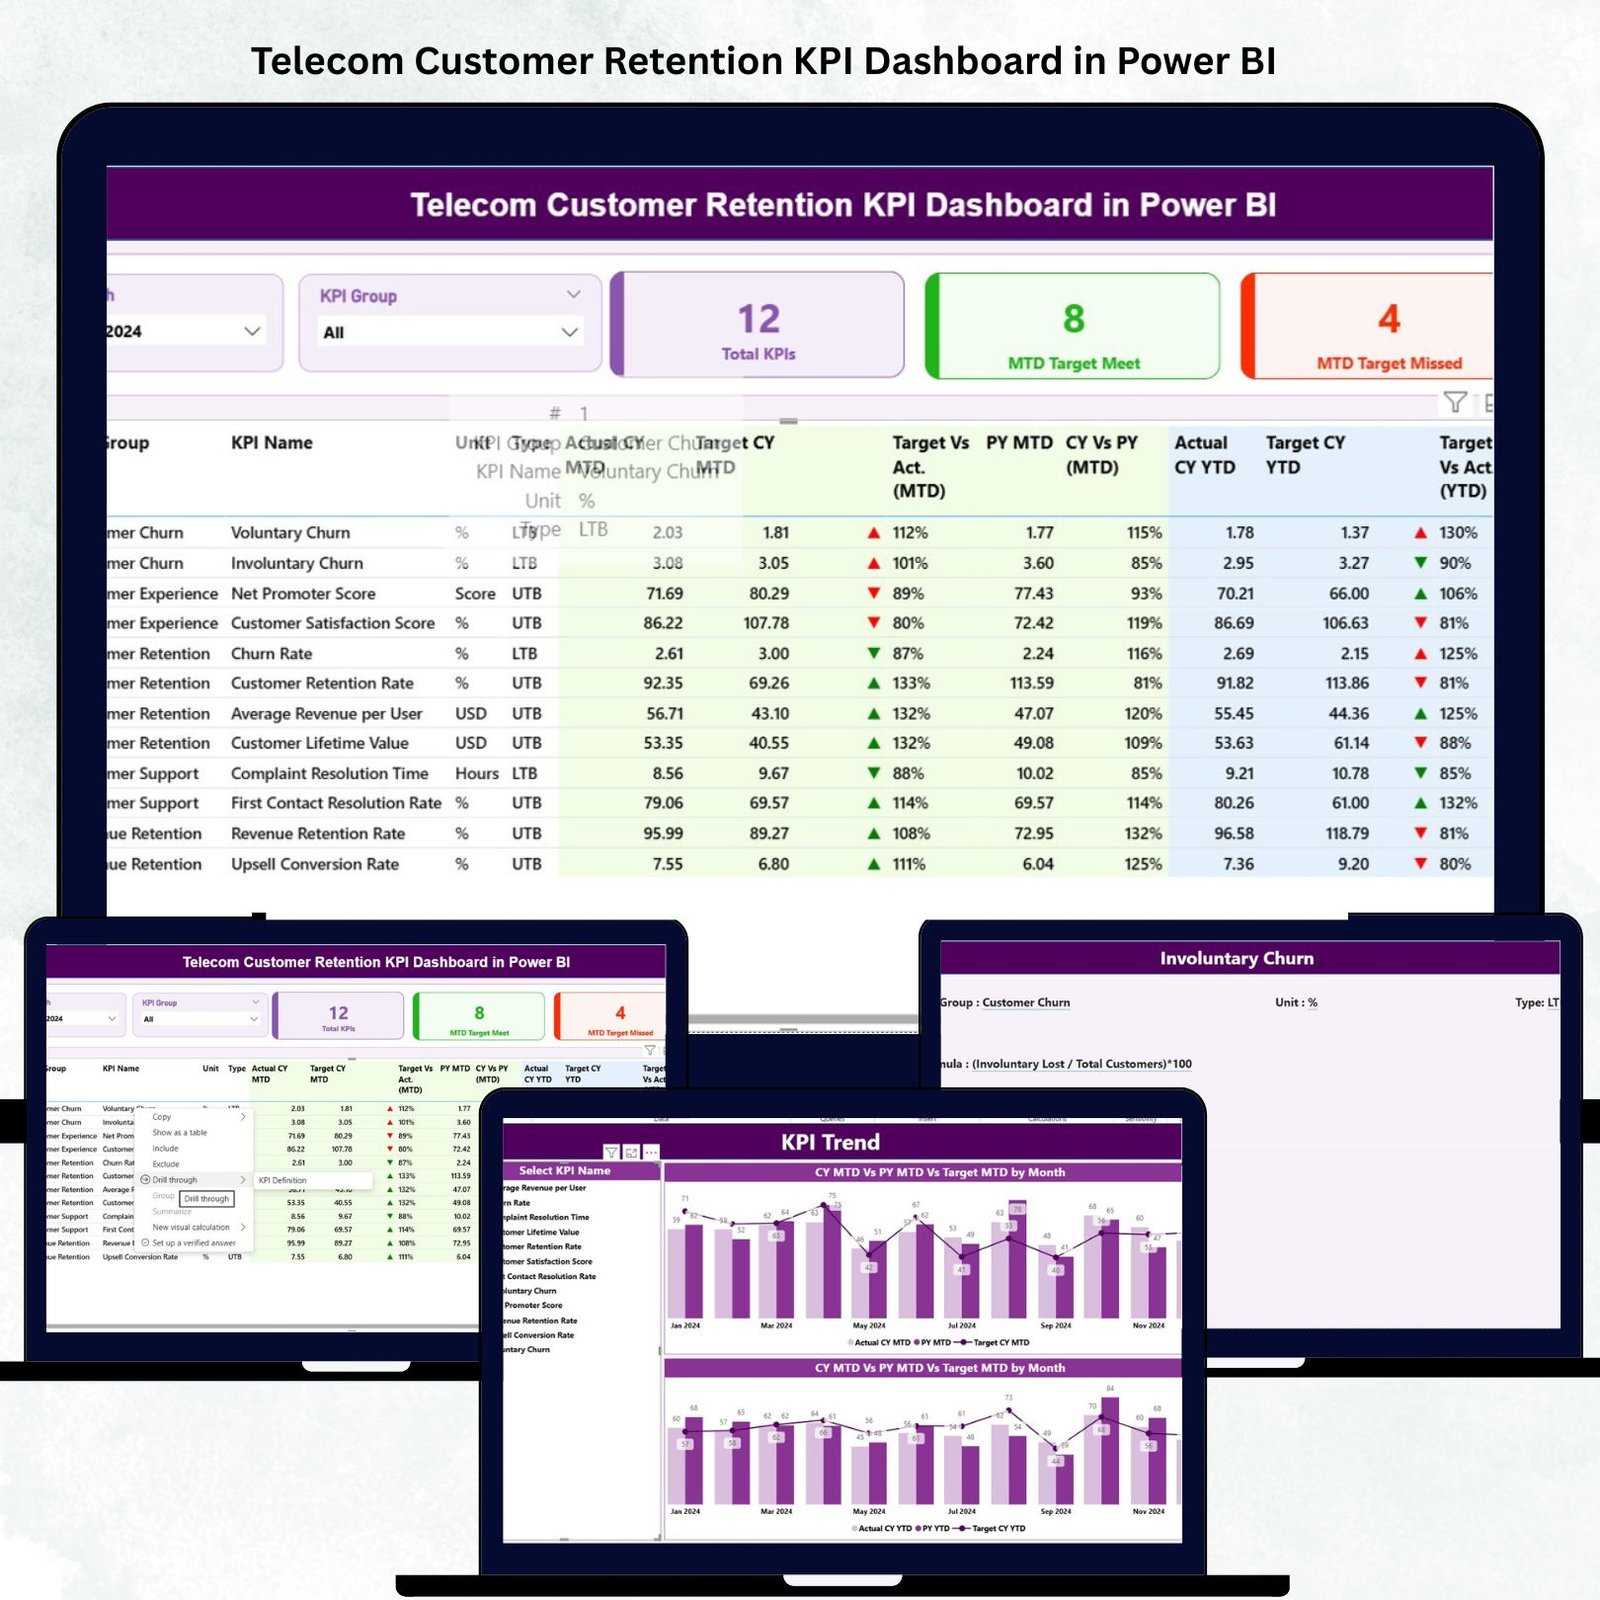
✨ Dynamic Slicers & Filters – Easily filter data by Month and KPI Group to focus on specific performance segments.
📊 Interactive KPI Cards – Instantly view Total KPIs, MTD Target Met, and MTD Target Missed, making performance tracking effortless.
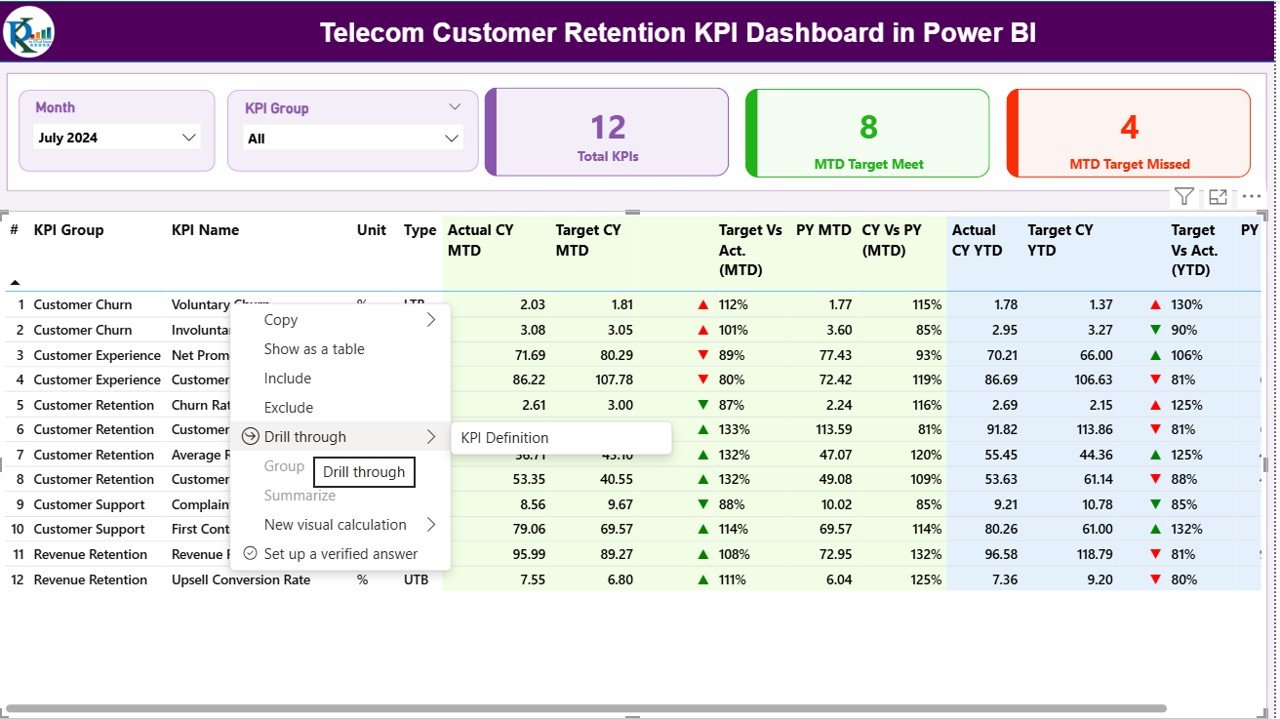
📈 Detailed KPI Table – Displays key metrics such as Actual vs Target, CY vs PY, and MTD/YTD comparisons with intuitive red/green arrows.
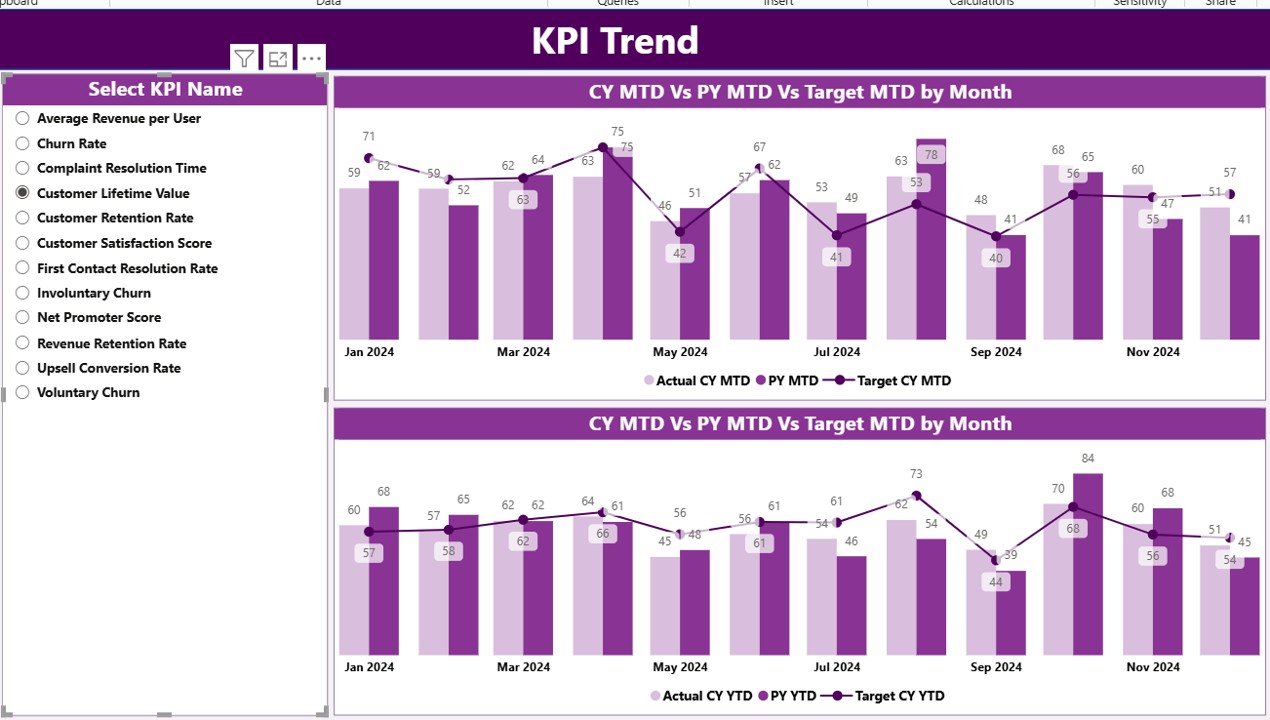
📉 Visual Trend Charts – Track performance over time with combo charts showing Actual, Target, and Previous Year values.
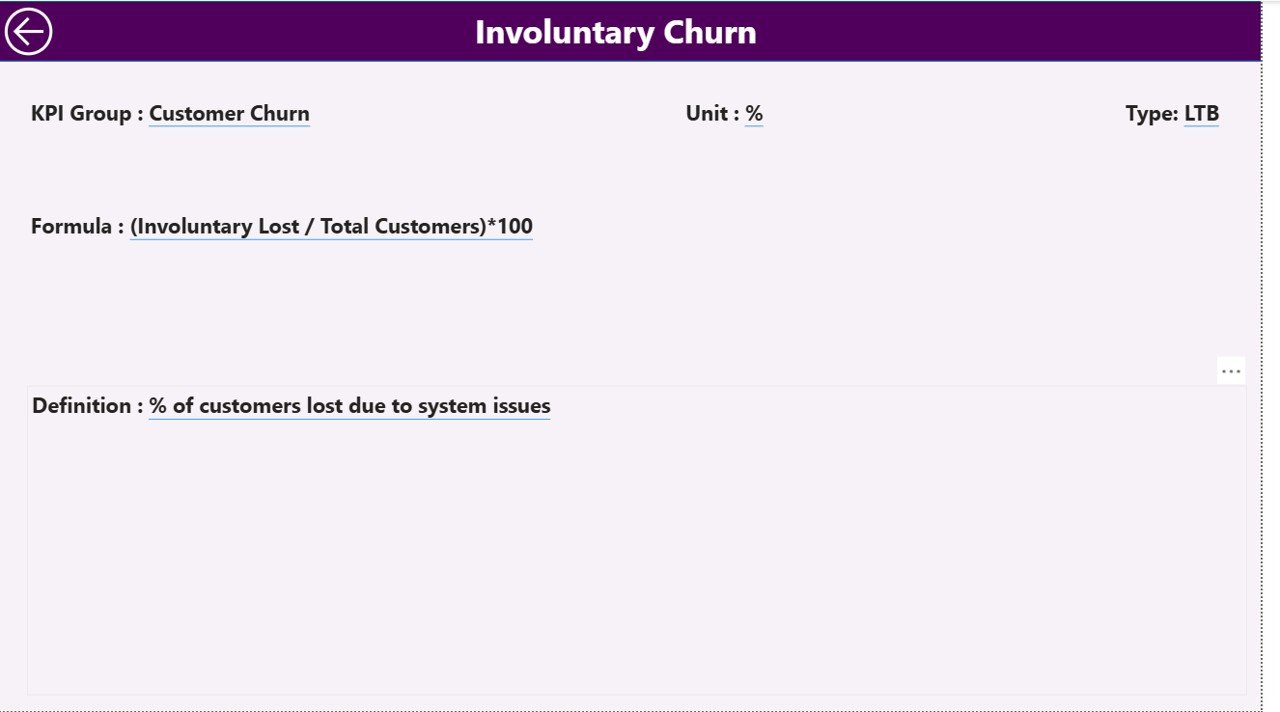
🧩 KPI Drill-Through Pages – Access detailed KPI definitions, formulas, and units to ensure data transparency.
🔄 Auto Data Refresh – Connects to Excel data sources that automatically update Power BI visuals.
👥 Department Collaboration – Perfect for aligning teams across Customer Support, Marketing, and Finance.
🖥️ User-Friendly Design – Simple navigation and clear visuals help everyone make data-driven decisions.

📂 What’s Inside the Telecom Customer Retention KPI Dashboard
When you download this product, you’ll get:
📘 Power BI (.pbix) File – Pre-built, fully functional dashboard ready to use.
📗 Excel Data Source (.xlsx) – Structured sheets for Input_Actual, Input_Target, and KPI_Definition.
📄 KPI Reference Sheet – Definitions, formulas, and KPI types (UTB/LTB) for every key metric.
🧭 3 Dashboard Pages –Telecom Customer Retention KPI Dashboard in Power BI
-
Summary Page: Displays overall performance and KPI highlights.Telecom Customer Retention KPI Dashboard in Power BI
-
KPI Trend Page: Visualizes performance over time using dynamic charts.
-
KPI Definition Page: Details every KPI’s logic, formula, and business relevance.
This structured model ensures a seamless Power BI experience with automatic updates once your Excel data changes.
⚙️ How to Use the Telecom Customer Retention KPI Dashboard
🪄 Step 1: Prepare Your Data Telecom Customer Retention KPI Dashboard in Power BI
Gather monthly customer retention data such as churn rates, satisfaction scores, and renewal rates.
📥 Step 2: Populate the Excel Template
Enter your Actual and Target data in the Input sheets. Ensure consistent naming and date formats.
📊 Step 3: Refresh the Dashboard
Open the Power BI file and click “Refresh” to visualize updated metrics automatically.
🎯 Step 4: Analyze Trends
Use slicers to filter data by Month or KPI Group and identify areas that need improvement.
🔍 Step 5: Drill Down for Insights
Right-click any KPI to open its detailed definition and understand the calculation logic.
🌐 Step 6: Share the InsightsTelecom Customer Retention KPI Dashboard in Power BI
Publish to Power BI Service or export visuals for management reports.
👥 Who Can Benefit from This Dashboard
💼 Telecom Executives: Get real-time visibility into customer loyalty, churn trends, and service performance.
📞 Customer Care Teams: Identify weak areas and improve resolution time.
📈 Marketing Managers: Measure the impact of campaigns on retention rates.
💰 Finance Teams: Track the cost of churn and revenue from loyal customers.
🧠 Data Analysts: Perform deep dives into KPI trends to optimize business strategies.
🤝 Consultants & Analysts: Present client-ready retention insights instantly.
This dashboard is ideal for organizations that want to replace scattered spreadsheets with a single, interactive reporting tool that’s both scalable and cost-effective.Telecom Customer Retention KPI Dashboard in Power BI
🔗 Click here to read the Detailed blog post
Watch the step-by-step video tutorial:


Reviews
There are no reviews yet.