
In the competitive world of retail, understanding your key performance indicators (KPIs) is essential for growth and profitability. The Retail KPI Scorecard in Google Sheets is a ready-to-use, automated, and interactive performance tracking tool that enables retailers to monitor sales, customer satisfaction, and operational efficiency — all in one centralized dashboard.
This scorecard helps you visualize trends, compare Month-to-Date (MTD) and Year-to-Date (YTD) performance, and evaluate progress against set targets with easy-to-read visuals. Designed for simplicity and clarity, it’s an indispensable tool for retail owners, managers, and finance teams who want to make data-driven decisions effortlessly.
🔑 Key Features of the Retail KPI Scorecard in Google Sheets
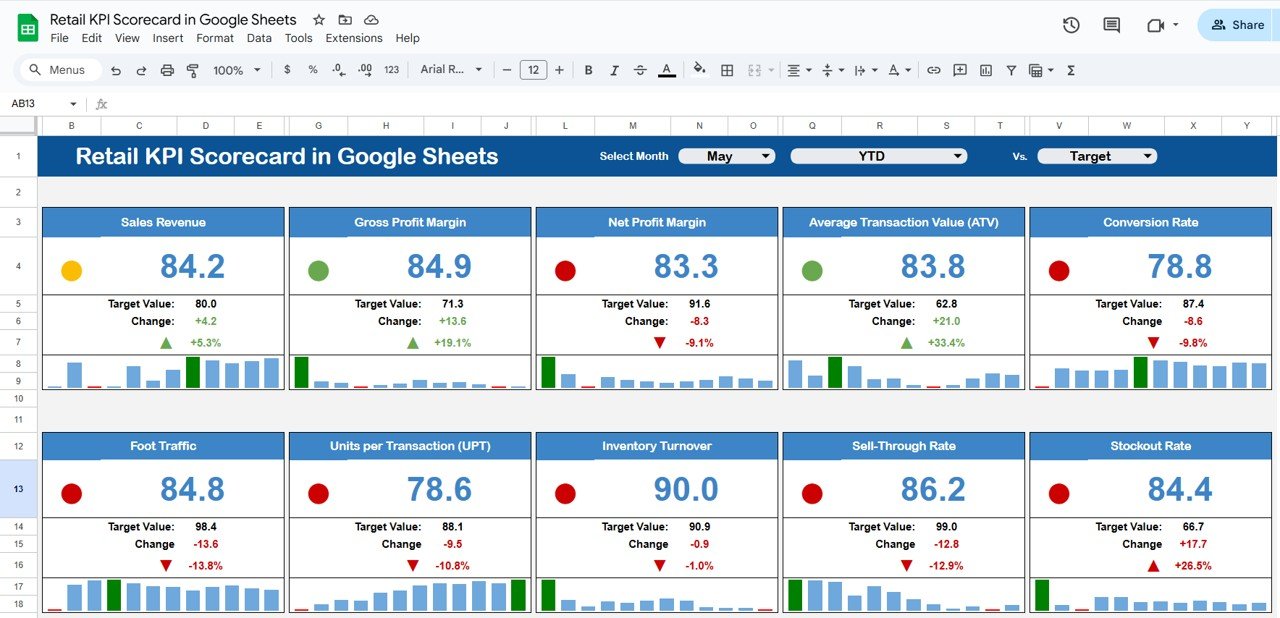
📊 Dashboard Sheet Tab
Your all-in-one control panel for retail performance.
-
Interactive Month Dropdown (Cell D3): Instantly switch between months to view live updates.
-
MTD vs. YTD Comparison: Track short-term and long-term performance side by side.
-
Visual Indicators: Up/down arrows and color-coded lights (red, yellow, green) show trends at a glance.
-
Performance vs Target: See which KPIs have met, exceeded, or missed targets.
This sheet provides a real-time, visual snapshot of your retail performance.
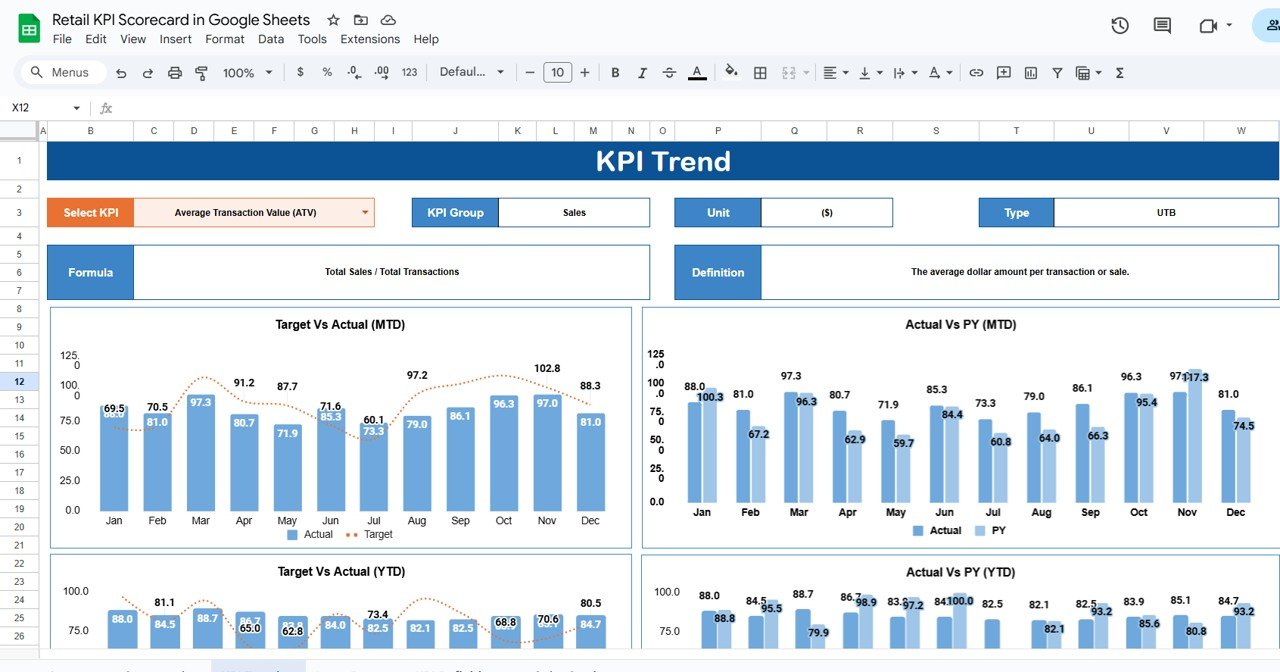
📈 Trend Sheet Tab
Dive deep into KPI analysis and discover performance patterns.
-
Select a KPI name from the dropdown (Cell C3).
-
Automatically displays KPI Group, Unit, Formula, and Type (UTB/LTB).
-
Generates trend charts to show monthly progress over time.
This allows you to monitor progress, seasonal effects, and improvement opportunities effortlessly.
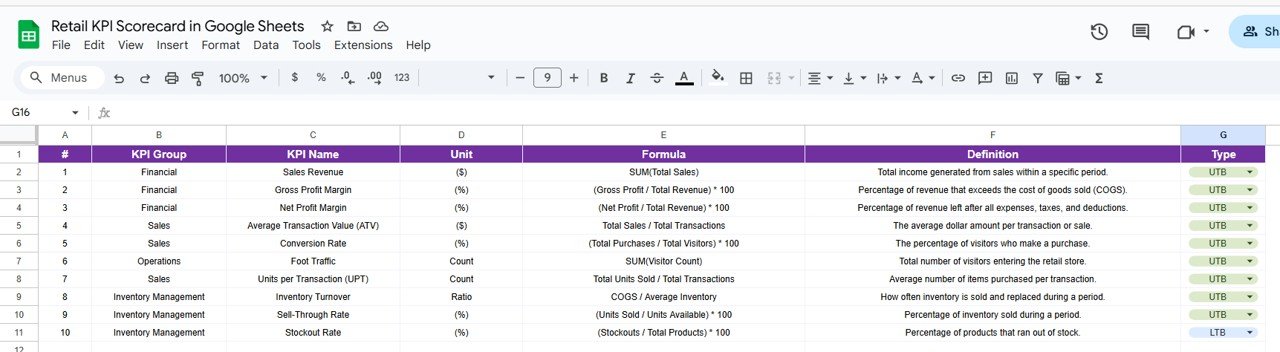
📖 KPI Definition Sheet Tab
Maintain clarity and standardization for all metrics.
-
Clearly define each KPI with Group, Unit, Formula, Definition, and Type (UTB/LTB).
-
Ensures consistency across reporting and communication.
-
Eliminates ambiguity in performance discussions.
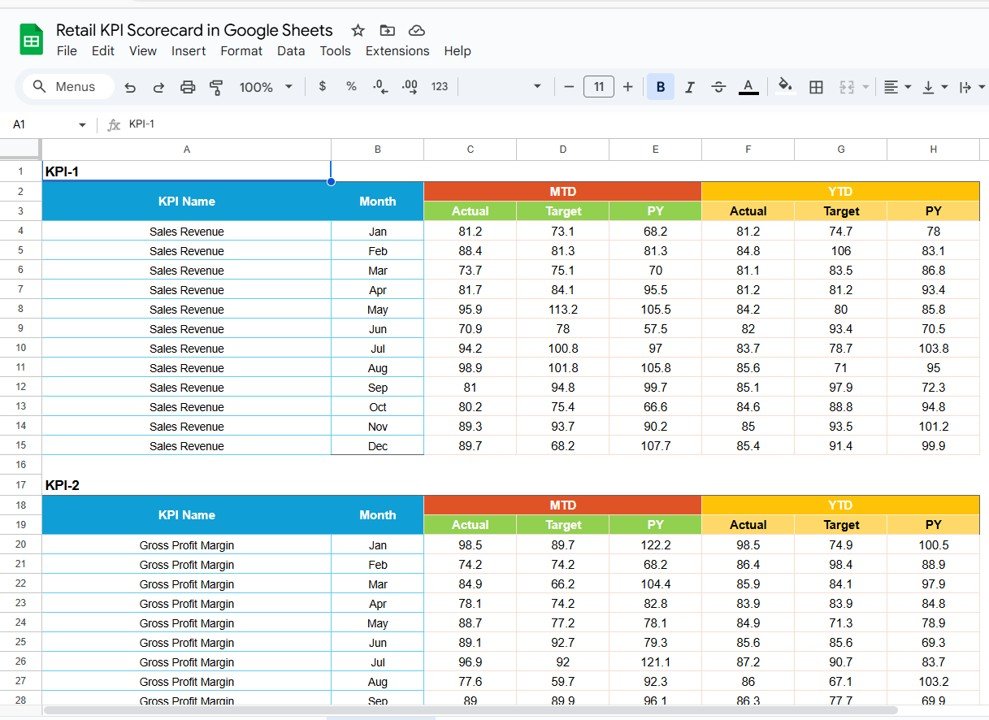
📅 Data Input Sheet Tab
The foundation of your scorecard — where all performance data lives.
-
Enter actual values, targets, and previous year data by month.
-
Automatically feeds into dashboard visuals and tables.
-
Keeps your entire team aligned with one accurate source of data.
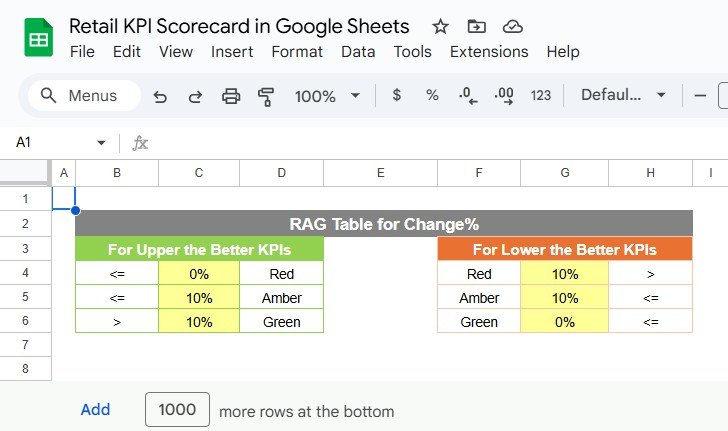
🎨 Color Settings Sheet Tab
Personalize your dashboard’s visual look and feel.
-
Customize thresholds for “Excellent,” “Average,” or “Below Target.”
-
Adjust icon indicators and traffic-light colors as per your brand style.
-
Makes the scorecard visually appealing and easy to interpret.
📦 What’s Inside the Template
✅ Interactive Dashboard – Real-time retail KPI visualization
✅ Trend Analysis Sheet – Detailed monthly progress charts
✅ KPI Definition Sheet – Clear and consistent KPI setup
✅ Data Input Sheet – Centralized location for all actuals and targets
✅ Color Settings Sheet – Full customization of visuals and formatting
✅ Auto Calculations – Dynamic MTD/YTD and % change formulas
Everything is interlinked and automated — no manual formulas needed! 🚀
👩💼 Who Can Use This Retail KPI Scorecard
🛍️ Retail Store Owners – Monitor overall sales and performance trends.
📈 Sales Managers – Evaluate revenue, conversion rate, and customer engagement.
💼 Operations Teams – Track inventory turnover and store efficiency.
👨💼 Finance & Accounting Teams – Compare targets, budgets, and profitability.
🏬 Regional Heads – Review multiple stores’ performance metrics with ease.
🧠 How to Use the Scorecard
-
Input Data: Enter actual KPI numbers and targets in the Data Input tab.
-
Select Month: Use the dropdown (Cell D3) on the Dashboard Sheet to switch views.
-
Analyze Performance: Review KPIs that are above, on, or below target.
-
Identify Trends: Use the Trend Sheet for deeper insights into individual KPIs.
-
Customize Visuals: Adjust color thresholds or add new KPIs if needed.
All charts, calculations, and visual elements update automatically — ensuring real-time accuracy.
🌟 Why Choose the Retail KPI Scorecard in Google Sheets
-
📈 Instant Insights: Real-time dashboard with automated calculations.
-
🎯 Goal-Oriented: Compare actuals vs targets to assess achievements.
-
🕒 Time-Saving: No coding or manual data entry beyond simple updates.
-
💡 Data Transparency: Shareable with team members and management.
-
🧭 Scalable & Customizable: Suitable for single or multi-store setups.
-
🌐 Cloud-Based Collaboration: Update and access anywhere with Google Sheets.
The Retail KPI Scorecard in Google Sheets is more than a reporting tool — it’s a performance management system that empowers retail businesses to make informed decisions, increase efficiency, and maximize profitability.
🔗 Click here to read the Detailed blog post
Watch the step-by-step video Demo:


Reviews
There are no reviews yet.