In the modern education system, data is the foundation of progress. Whether it’s tracking student attendance, improving teacher performance, or managing budgets — every figure reveals valuable insights. The Secondary Schools KPI Dashboard in Excel helps school administrators, principals, and teachers monitor performance through an easy-to-use, visually interactive dashboard.
Built entirely in Microsoft Excel, this ready-to-use template centralizes all key performance indicators (KPIs) — academic, operational, financial, and engagement — in a single system. It transforms raw data into meaningful insights, empowering educators to make informed, data-driven decisions that lead to measurable improvements.
⚙️ Key Features of the Secondary Schools KPI Dashboard in Excel
🏫 7 Functional Worksheets – Home, Dashboard, KPI Trend, Input Data, Target, Previous Year, and KPI Definition sheets for comprehensive performance tracking.
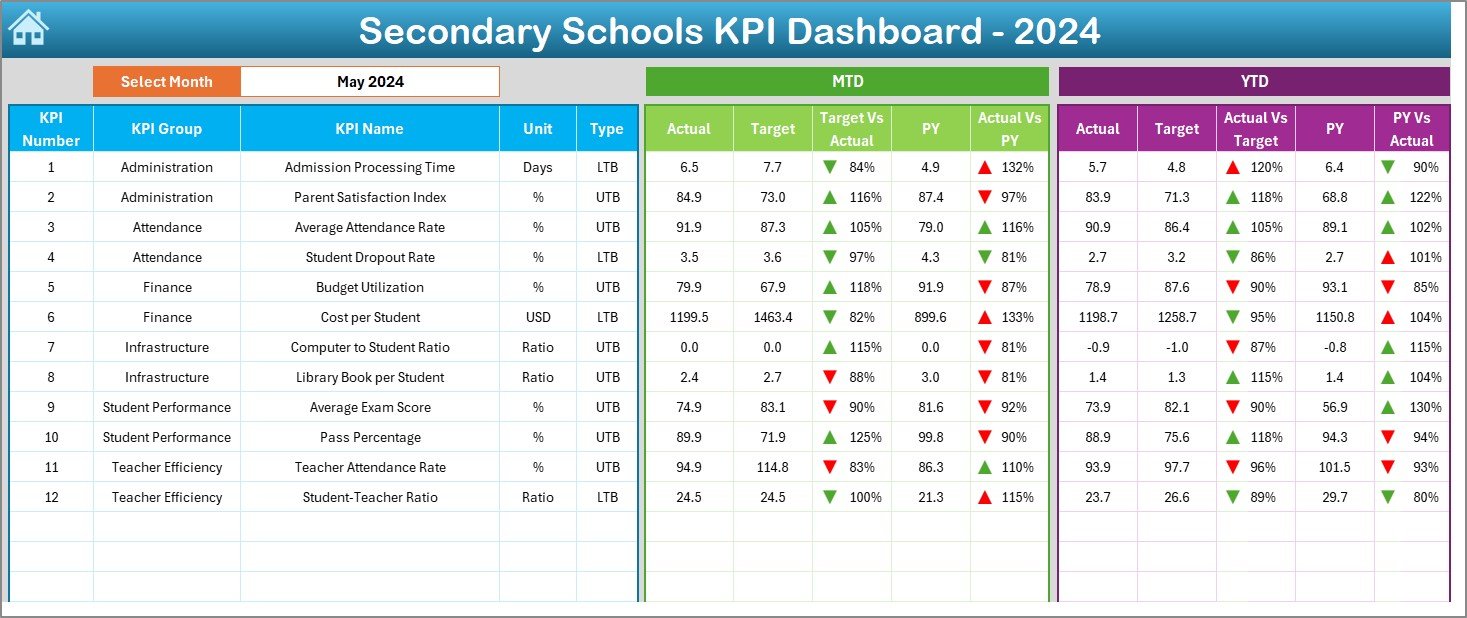
🎯 MTD & YTD Analysis – View Month-to-Date and Year-to-Date Actuals, Targets, and Previous Year results.
📈 Dynamic Visuals & Charts – Instantly see performance trends and year-over-year comparisons.
🟢 Conditional Formatting – Color-coded indicators highlight metrics that meet or miss targets.
📊 Automatic Calculations – Excel formulas compute MTD, YTD, and variance automatically.
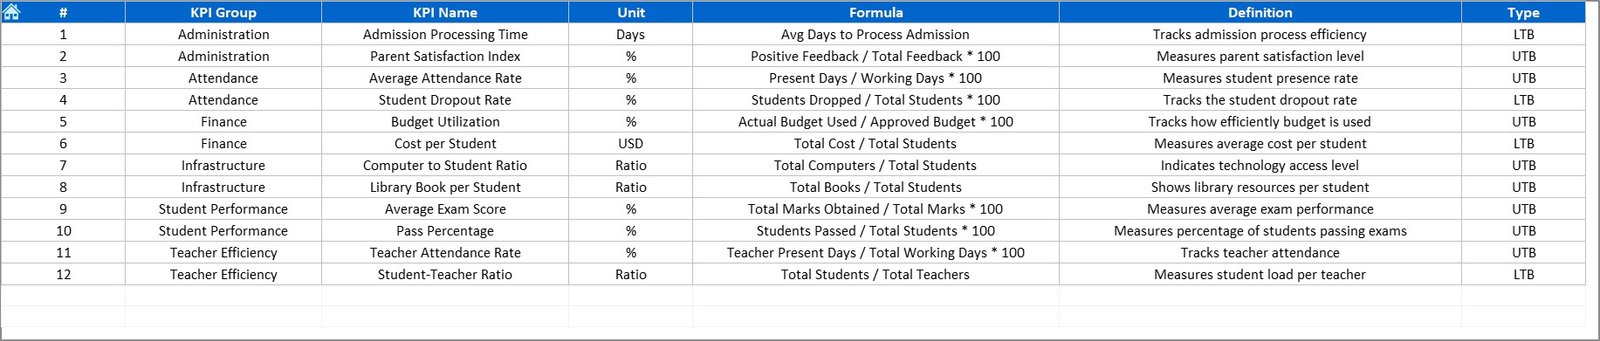
📘 Full KPI Dictionary – Each KPI includes its group, unit, formula, and definition.
💡 No Coding Required – Fully automated using Excel formulas; no VBA or macros needed.
💰 Budget-Friendly Tool – A cost-effective alternative to expensive analytics software.
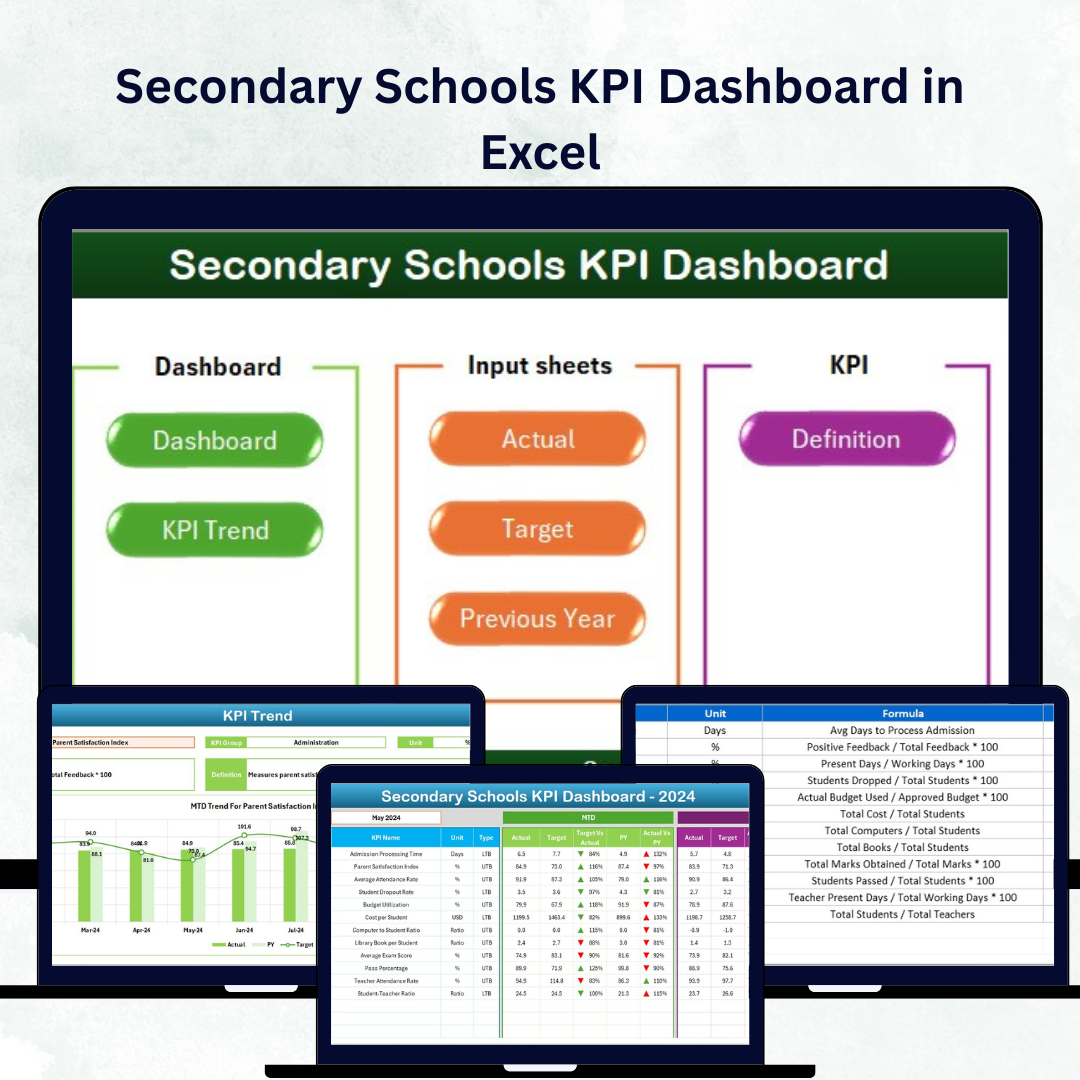
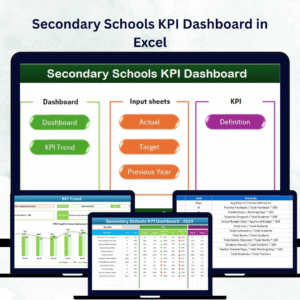
📚 Dashboard Structure Overview
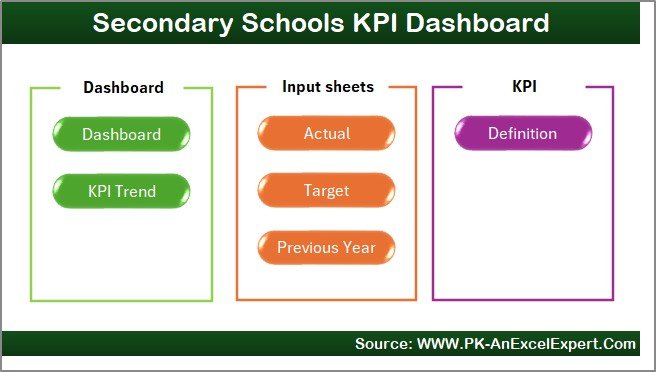
1️⃣ Home Sheet
Acts as the central navigation hub, with quick buttons to open any sheet — making it simple even for beginners.
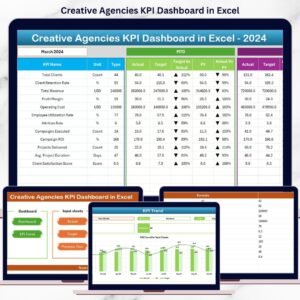
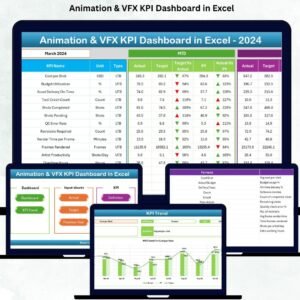
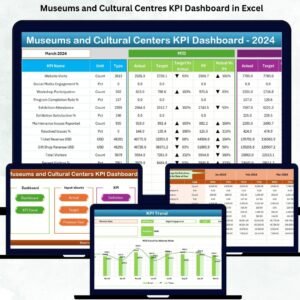
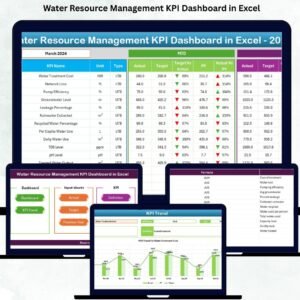
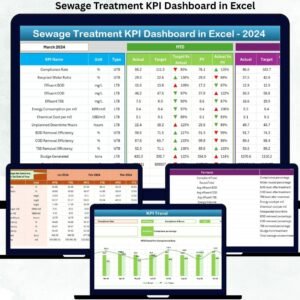
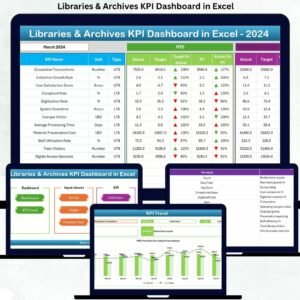
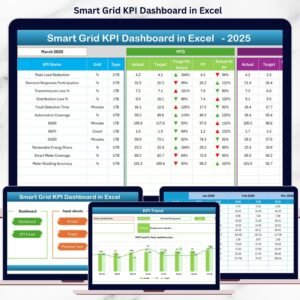
2️⃣ Dashboard Sheet (Main View)
The heart of the dashboard. Choose any month (cell D3) to view MTD and YTD data with automatic updates. Visual indicators and arrows quickly show if performance is above or below targets.
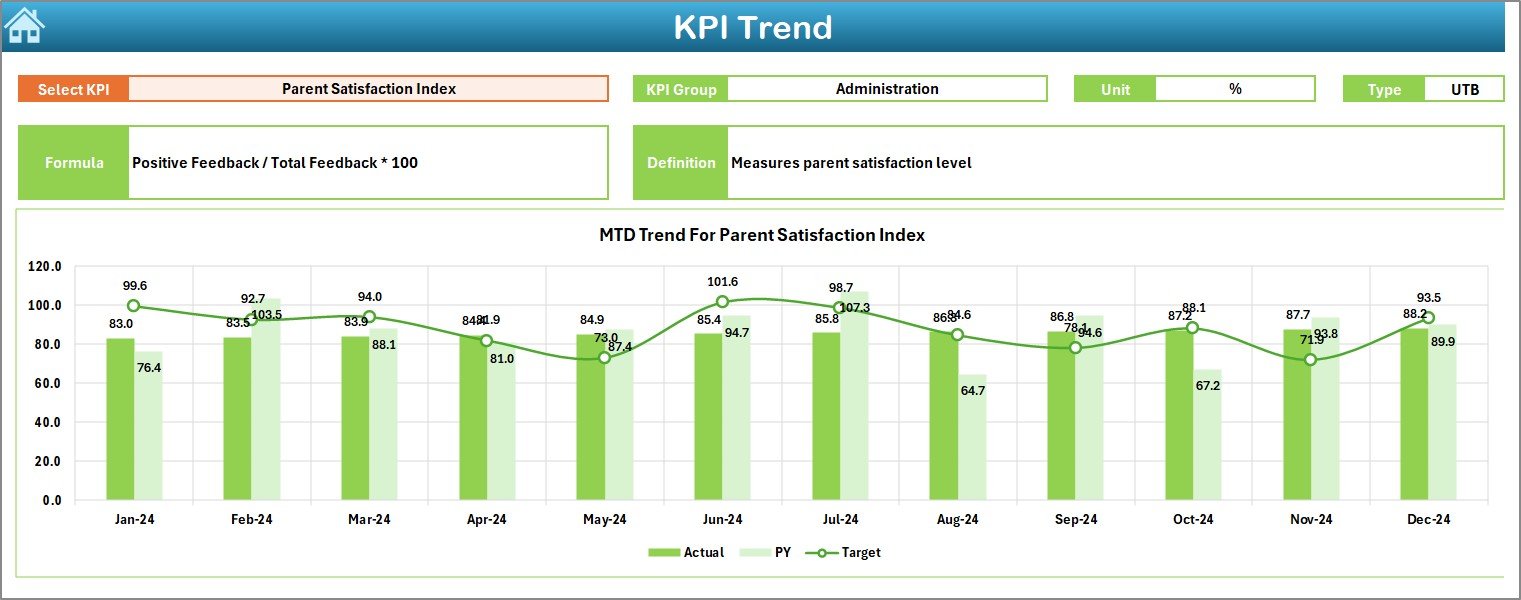
3️⃣ KPI Trend Sheet
Select any KPI (cell C3) to analyze its long-term trend using MTD and YTD charts for Actual, Target, and Previous Year data. Perfect for identifying academic and operational trends.
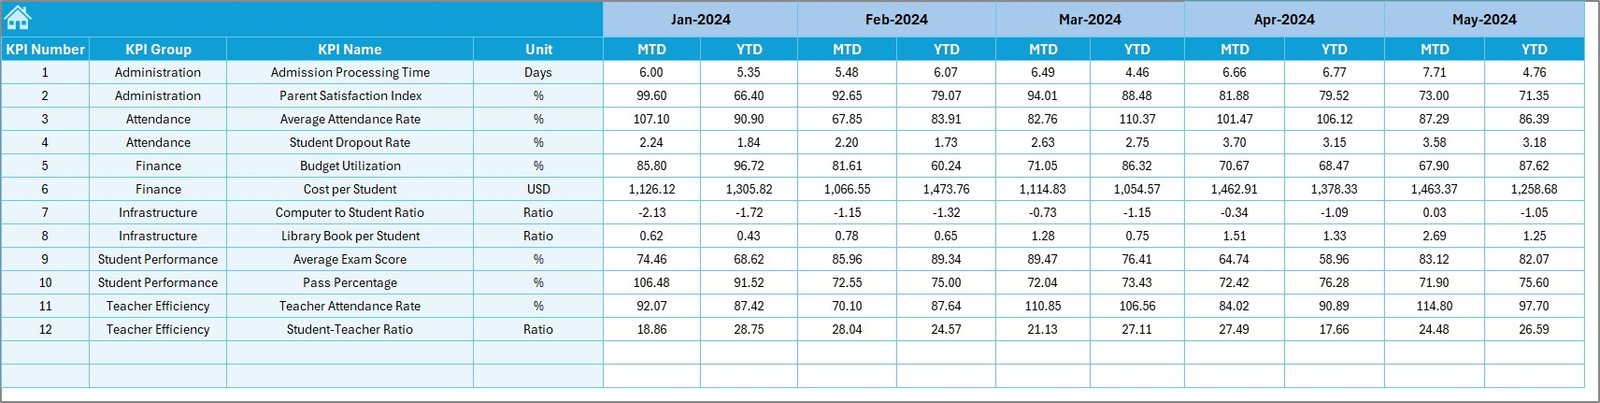
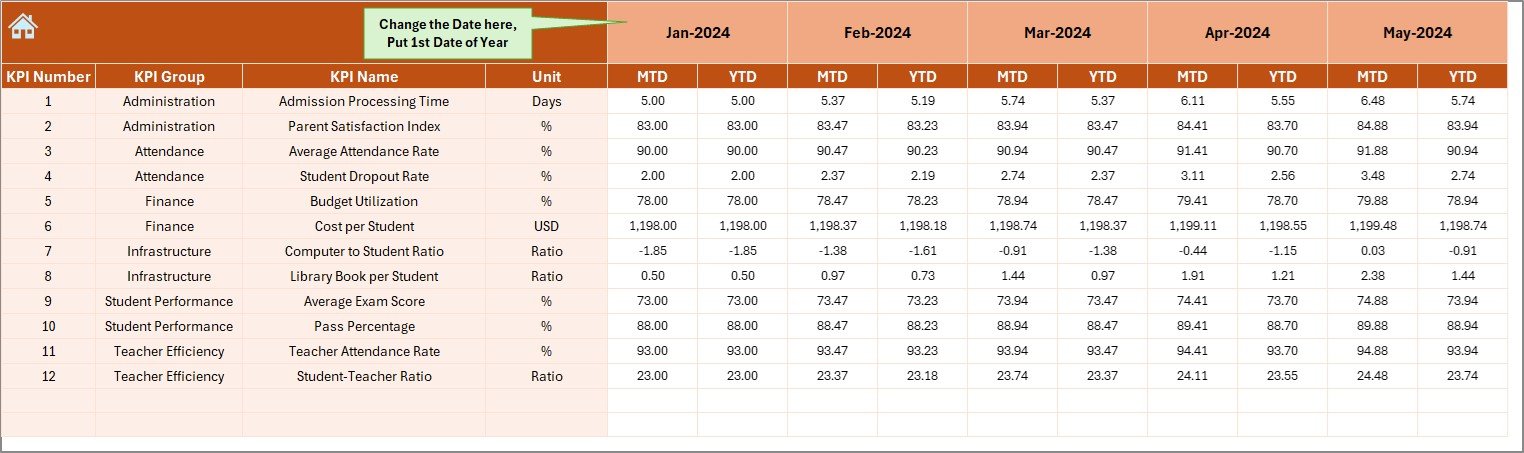
4️⃣ Input Data Sheet
Record monthly Actual data for each KPI. The dashboard updates instantly as new data is entered.
5️⃣ Target Sheet
Set your school’s monthly and yearly goals for academic, financial, or operational KPIs.
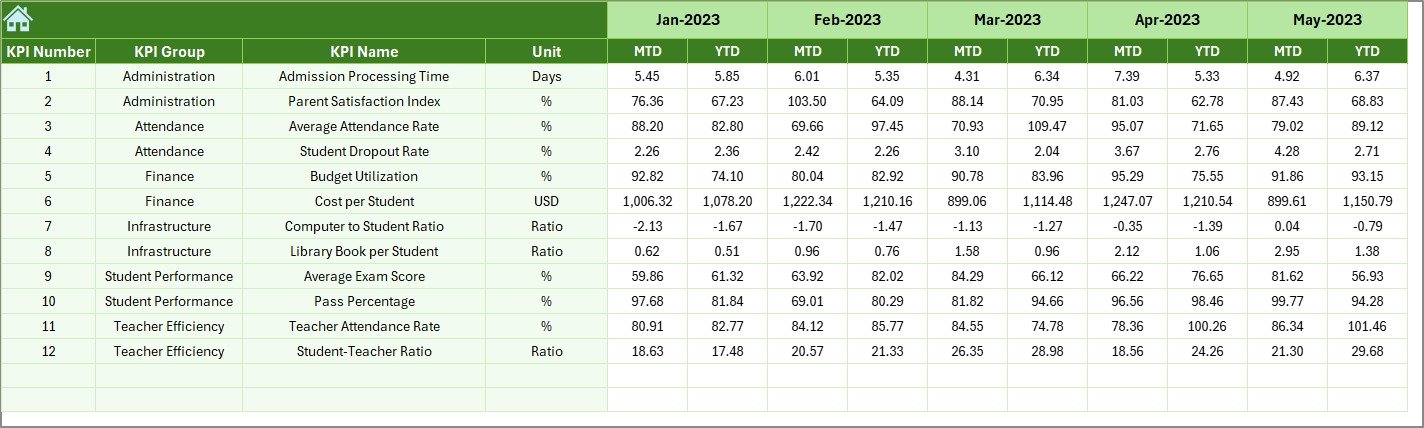
6️⃣ Previous Year Sheet
Maintain last year’s results for side-by-side benchmarking and improvement tracking.
7️⃣ KPI Definition Sheet
Your internal guide — listing KPI names, groups, units, formulas, and definitions for clarity and consistency.
🎓 Common KPIs in Secondary Schools Dashboard
Student KPIs: Attendance %, Pass Rate %, Dropout Rate %, Average Test Scores, Student-Teacher Ratio.
Teacher KPIs: Attendance %, Lesson Plan Completion %, Training Hours per Teacher, Feedback Score.
Administrative KPIs: Budget Utilization %, Classroom Utilization %, Maintenance Response Time.
Financial KPIs: Fee Collection %, Scholarship Allocation %, Operating Cost per Student.
Community KPIs: Parent Meeting Attendance %, Extracurricular Participation %, Student Satisfaction %.
These KPIs can be customized to fit your school’s priorities and structure.
🧭 How It Works
1️⃣ Input monthly Actual values in the Input Sheet.
2️⃣ Define your school’s goals in the Target Sheet.
3️⃣ Add historical performance data in the Previous Year Sheet.
4️⃣ The Dashboard and KPI Trend Sheets update automatically with charts and indicators.
No coding, no complex setup — just data-driven visibility in minutes.
🌟 Key Advantages
✅ Centralized Data View – Manage academic, financial, and staff performance from one file.
✅ Real-Time Updates – Charts and tables refresh automatically.
✅ Customizable & Scalable – Add KPIs or modify formulas as needed.
✅ Collaborative Access – Works perfectly with OneDrive or Google Drive.
✅ Historical Insights – Compare results with previous years.
✅ Enhanced Accountability – Assign KPIs to staff or departments for ownership.
✅ Improved Academic Results – Use insights to strengthen learning outcomes.
🧩 Best Practices for Maximum Impact
📌 Focus on 10–20 high-impact KPIs that align with school goals.
📌 Use Excel formulas (SUMIFS, AVERAGEIFS) to automate calculations.
📌 Visualize data using charts, arrows, and color coding.
📌 Protect formula cells to prevent accidental edits.
📌 Conduct monthly performance reviews and share reports across departments.
Following these best practices ensures accuracy, clarity, and consistency in school performance tracking.
🎯 Why Every School Needs This Dashboard
The Secondary Schools KPI Dashboard in Excel empowers education leaders to move beyond intuition and focus on measurable outcomes. It enhances transparency, accountability, and collaboration — helping schools achieve excellence in academics, operations, and resource management.
Whether you manage a private institution, government school, or international curriculum, this Excel-based dashboard ensures your school turns data into progress.
Click here to read the Detailed blog post
🎥 Watch the tutorial: YouTube.com/@PKAnExcelExpert
Watch the step-by-step video tutorial:


Reviews
There are no reviews yet.