

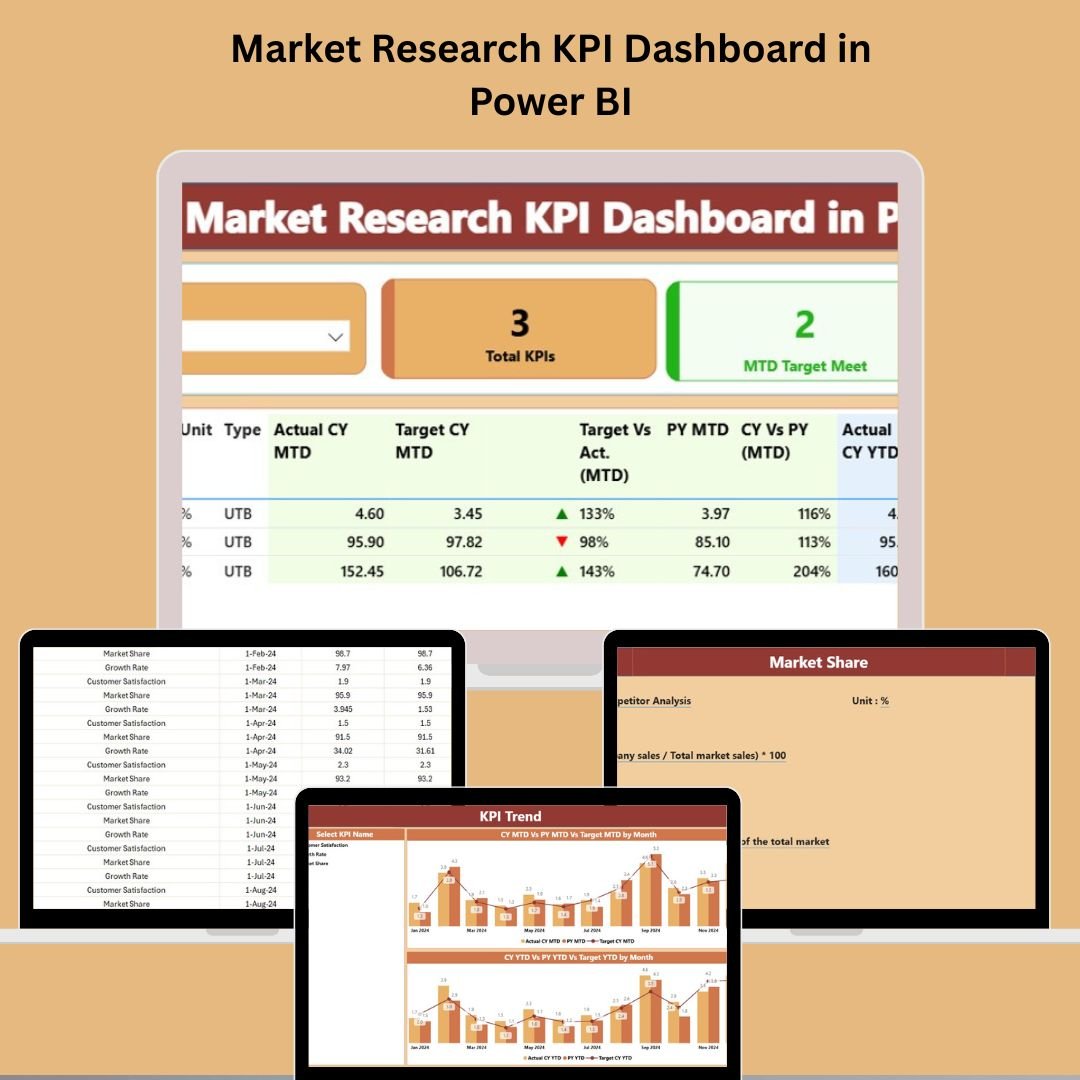

If you’re struggling to make sense of scattered KPIs, shifting trends, and missed targets in your market research, you’re not alone. But now, there’s a better way. Introducing the Market Research KPI Dashboard in Power BI — a dynamic and professional-grade dashboard that transforms your raw market data into clear, actionable insights. ⚙️📈
Perfect for analysts, marketing teams, and decision-makers, this dashboard integrates seamlessly with Excel to give you real-time visibility into how your marketing KPIs are performing — both this month and year-over-year.
🛠️ Key Features of Market Research KPI Dashboard in Power BI
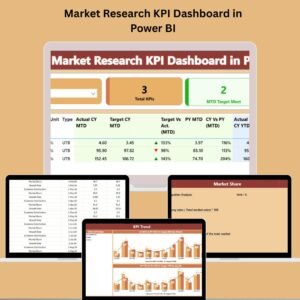
📌 Summary Page – Instant Overview of Your KPIs
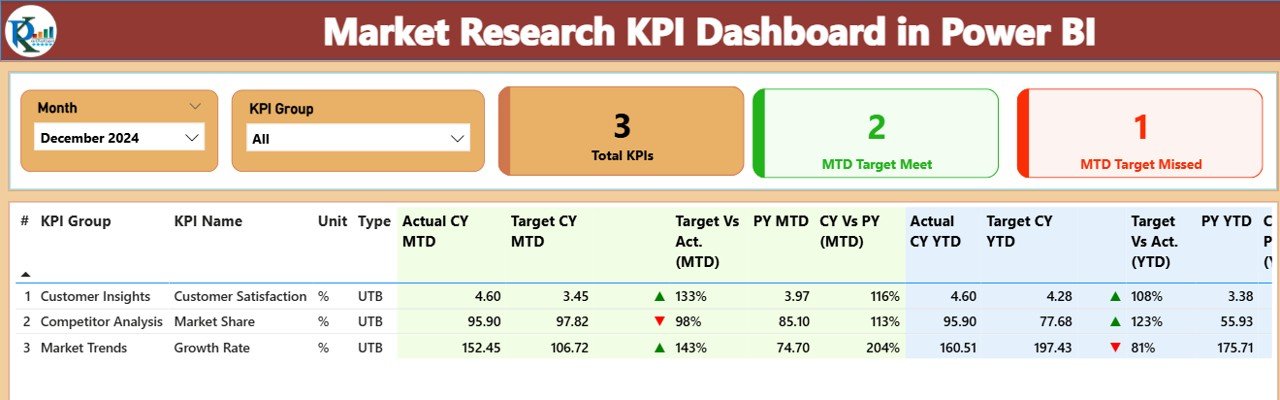
🔄 Month & KPI Group Slicers – Filter insights effortlessly
📋 KPI Cards – Display total KPIs, targets met, and missed
🧮 Detailed KPI Table – Includes KPI Number, Group, Unit, Type (LTB or UTB), Actual vs. Target (MTD/YTD), and performance icons (▲▼)
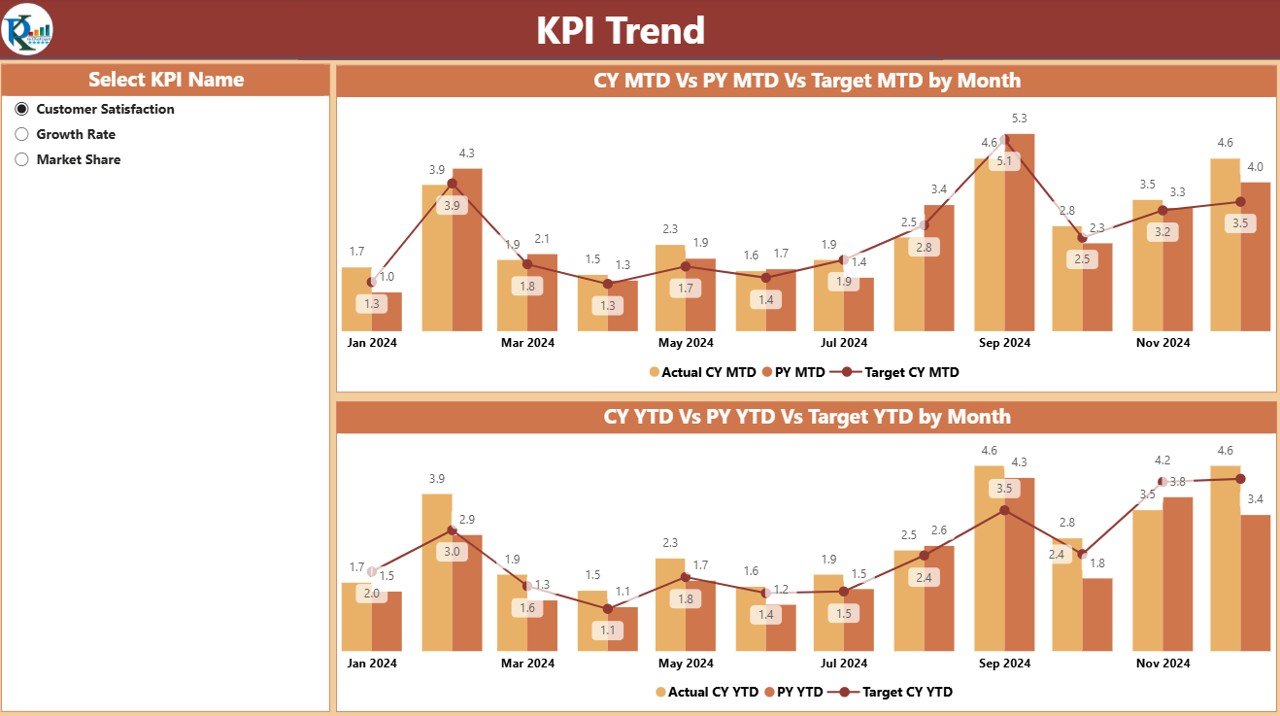
📊 KPI Trend Page – Visualize KPI Movements Over Time
📈 Combo Charts – Track current year, previous year, and target trends
🔍 KPI Selector – Analyze individual KPIs across time for deeper understanding
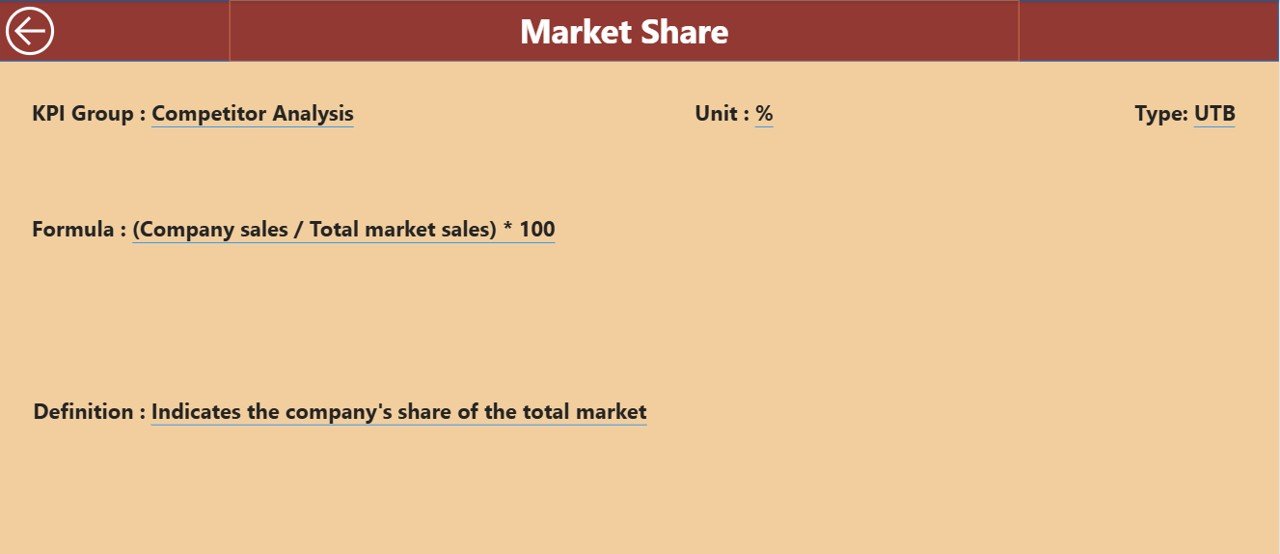
📚 KPI Definition Page – Know What Every KPI Means
🧠 A hidden drill-through page showing:
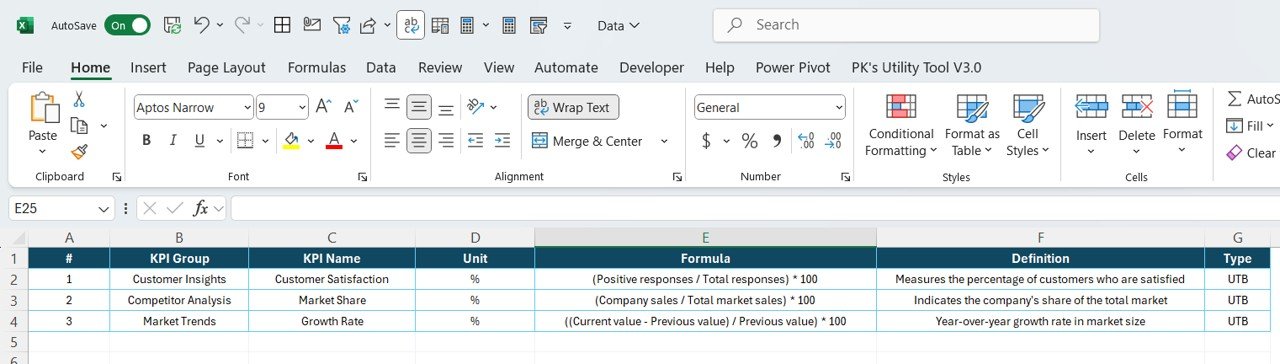
KPI Formula
Unit
Group
Description
Type (LTB or UTB)
Just click the KPI and navigate back effortlessly.
📂 What’s Inside the Market Research KPI Dashboard Package?
✅ A Power BI file (.pbix) with 3 detailed pages: Summary, Trend, and Definitions
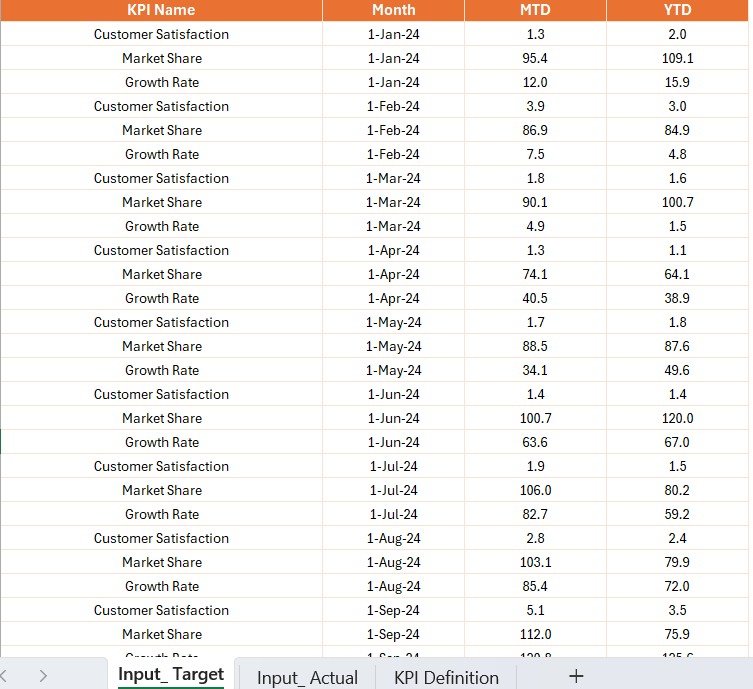
✅ A connected Excel file with 3 sheets:
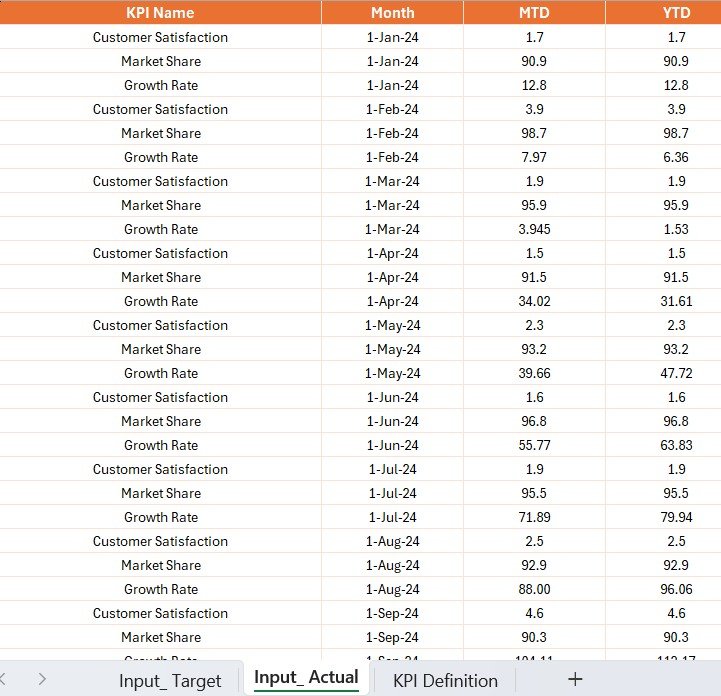
Input_Actual – Input actual MTD/YTD numbers
Input_Target – Define KPI targets
KPI_Definition – Store all KPI formulas, units, and categories
✅ Visual performance indicators (green/red arrows)
✅ Built-in slicers for dynamic filtering
✅ Combo charts for side-by-side year comparisons
✅ Automatic % calculations for Actual vs. Target
Whether you’re running weekly reports or conducting quarterly reviews, this setup is built to scale.
🧑💻 How to Use the Market Research KPI Dashboard in Power BI
🧾 Open the Excel file and input your actual and target numbers
📥 Load the data into Power BI (pre-linked, so just refresh)
🎯 Use slicers to filter by month or KPI group
📊 Analyze KPI cards, performance tables, and charts
🔁 Drill into KPI details using the definition page
💡 Identify gaps and wins in your market research with one glance
It’s plug-and-play! No coding or Power BI expertise needed.
🎯 Who Can Benefit from This Dashboard?
🧑💼 Marketing Analysts – Evaluate campaign ROI and lead performance
📊 Business Leaders – Get big-picture insight without digging through spreadsheets
🕵️♂️ Market Researchers – Track key metrics across timelines
🏢 Startups & Corporates – Scalable for both small teams and enterprise use
📆 Agencies – Showcase client performance in visually appealing dashboards
📣 Brand Managers – Monitor reach, engagement, and awareness KPIs
This dashboard speaks data in the language decision-makers understand.
🔗 Click here to read the Detailed blog post
🔗 Visit our YouTube channel to learn step-by-step video tutorials
Compatibility and Requirements
- Works in Power BI Desktop, which is free to download. Microsoft explains the install in Get Power BI Desktop.
- Your actual numbers, targets and KPI definitions live in the connected Excel file, so you also need Excel to edit them.
Frequently Asked Questions
What is in the download?
A Power BI file (.pbix) with three pages (Summary, KPI Trend and KPI Definition) and a connected Excel file with three sheets: Input_Actual, Input_Target and KPI_Definition.
How do I update the dashboard with my own numbers?
Type your actual MTD and YTD figures into Input_Actual and your goals into Input_Target in the Excel file. Then refresh the data in Power BI and the pages update.
Can I compare this year with last year?
Yes. The KPI Trend page has combo charts that show the current year, the previous year and the target. You pick a KPI to see its trend over time.
How do I see what a KPI means?
Drill through from a KPI to the KPI Definition page. It shows the formula, unit, group, description and type (LTB or UTB) for that KPI.
Is there an Excel or Google Sheets version?
Yes. See the Market Research KPI Dashboard in Excel and the Market Research KPI Dashboard in Google Sheets.
Related Market Research Templates
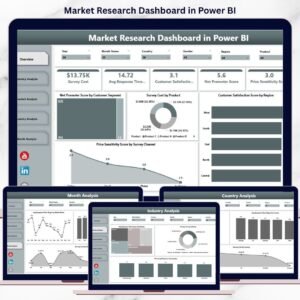
- Market Research Dashboard in Power BI: a dashboard view of market research data in Power BI
- Market Research KPI Dashboard in Excel: the same KPI dashboard in Excel
- Market Research KPI Dashboard in Google Sheets: the Google Sheets edition
- Marketing Dashboard in Power BI: a marketing dashboard on the same platform
- Marketing and Social Media Analytics Kit: 7 marketing templates in one download
Browse all Power BI KPI dashboards.






















Reviews
There are no reviews yet.