Tourism can be both a force for good and a source of strain—especially when sustainability isn’t measured and managed. That’s why we created the Sustainable Tourism KPI Dashboard in Power BI — a ready-to-use, visually dynamic tool that helps tourism professionals track, analyze, and improve their environmental, economic, and social impact in real time.
Whether you’re part of a national tourism board, a regional travel agency, or an eco-resort team, this dashboard empowers you to make data-driven decisions that align with sustainability goals.
🧭 Key Features of the Dashboard
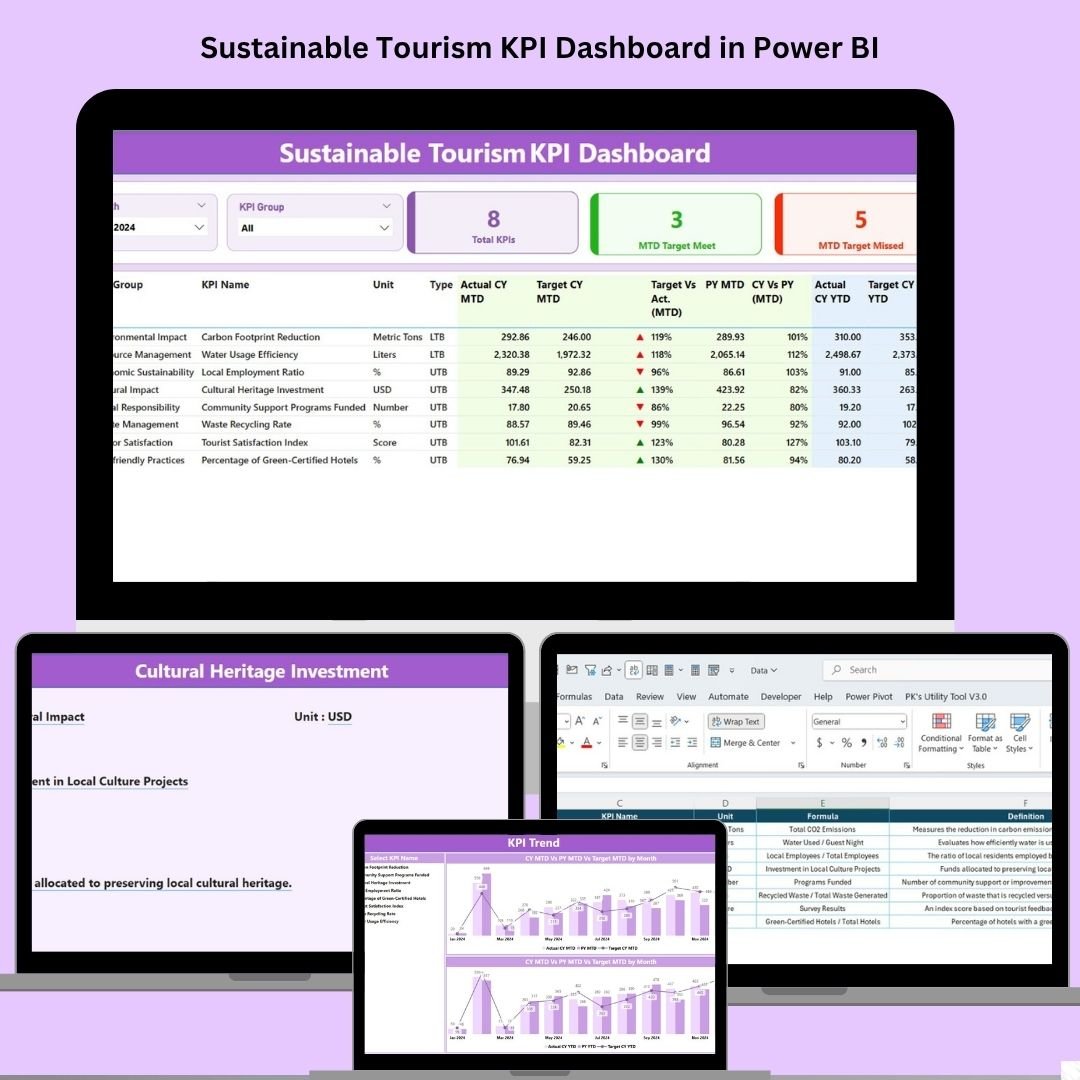
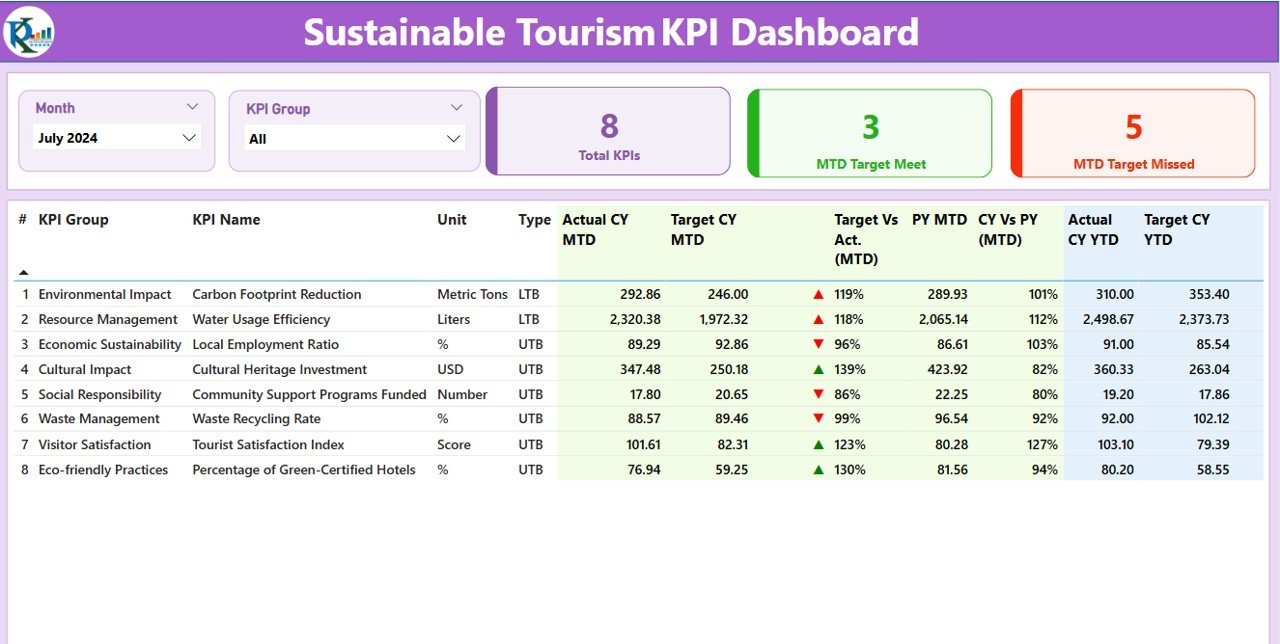
📊 Summary Page
-
MTD and YTD performance overview
-
Slicers for Month and KPI Group
-
Cards showing total KPIs, Target Met, and Missed
-
Table with actual vs target comparisons, status icons, and PY benchmarks
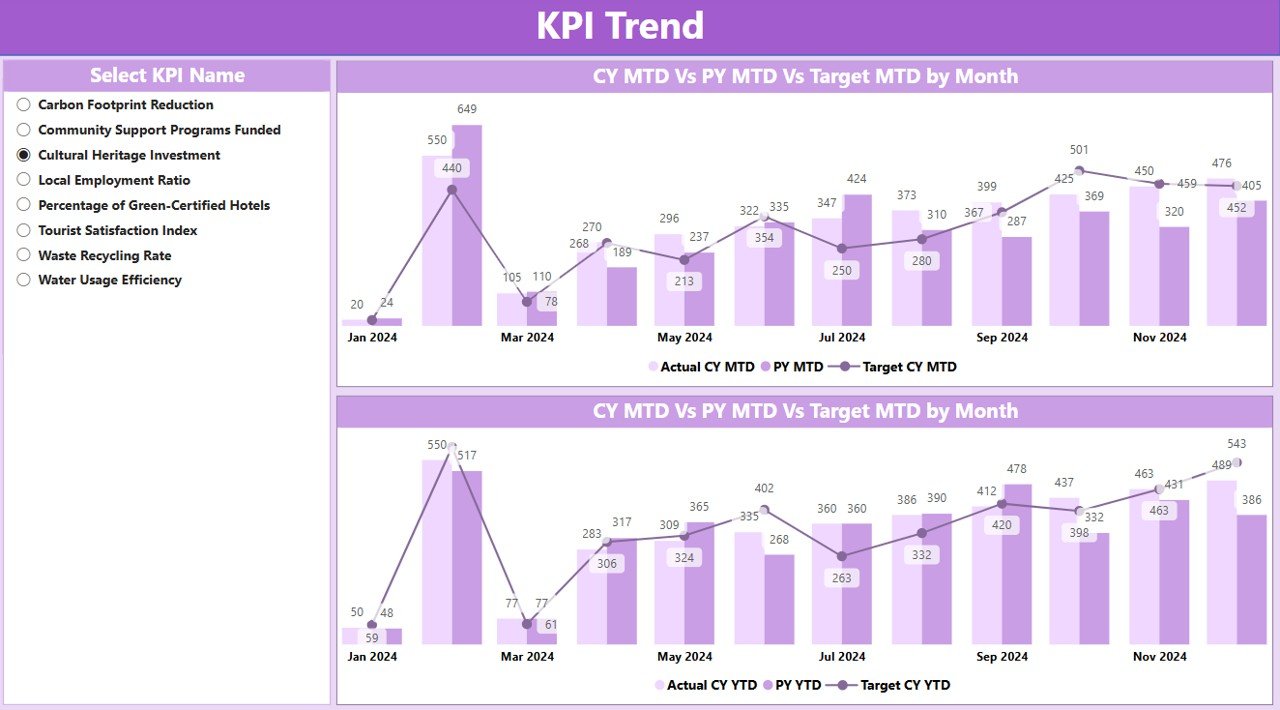
📈 KPI Trend Page
-
Interactive slicer for KPI selection
-
Line and combo charts to compare Current Year vs Previous Year
-
Targets displayed for both MTD and YTD
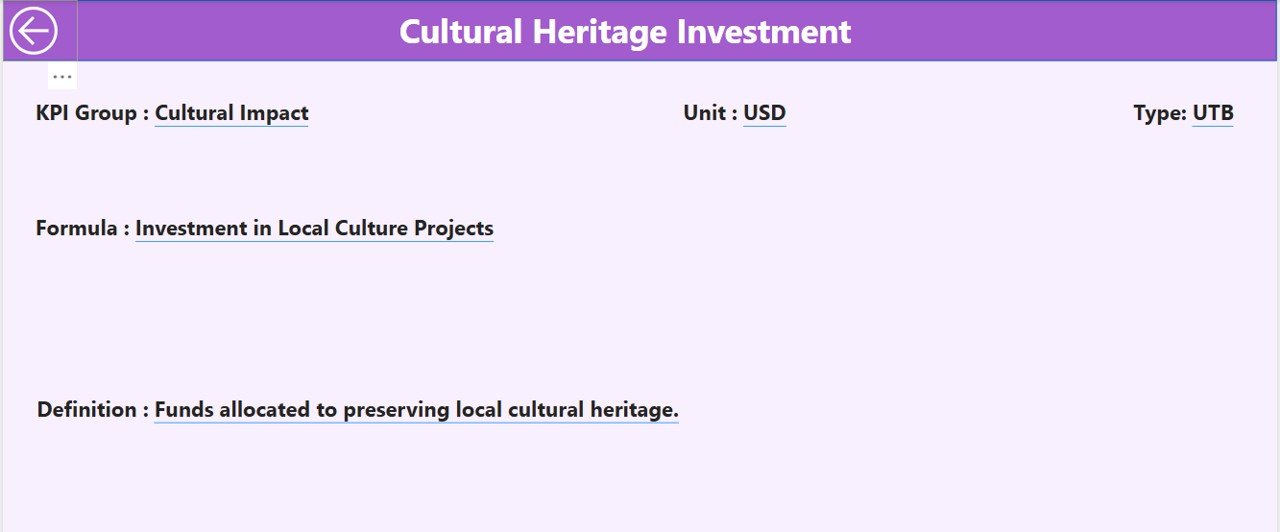
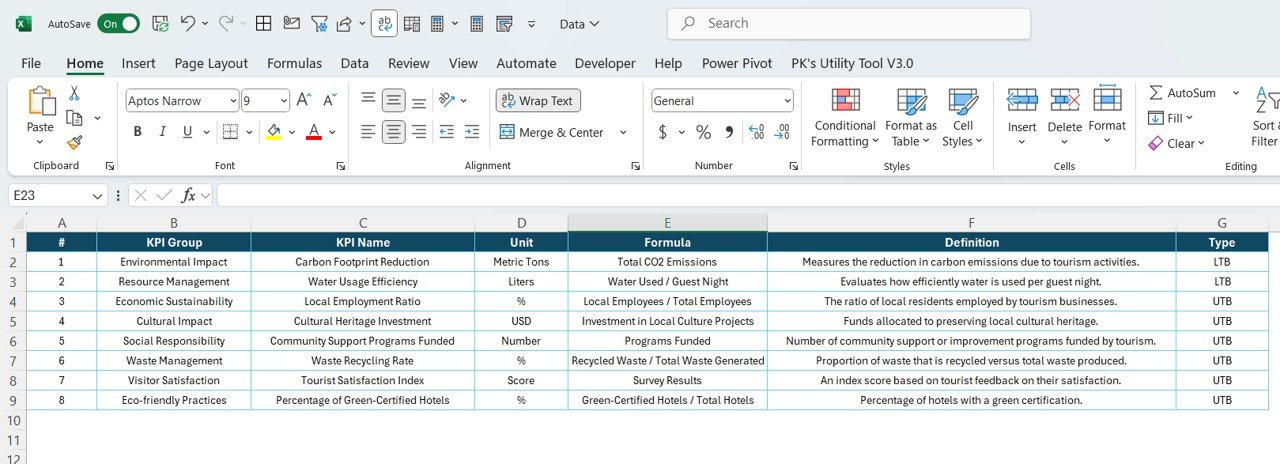
📘 KPI Definition Page (Drill-Through)
-
View KPI formulas, unit, and type (UTB or LTB)
-
Jump into definitions directly from summary view
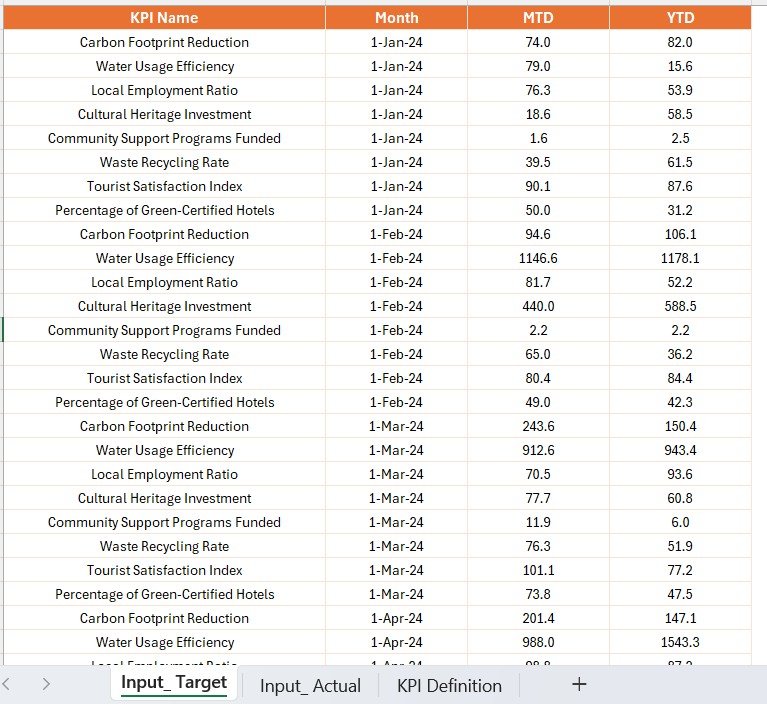
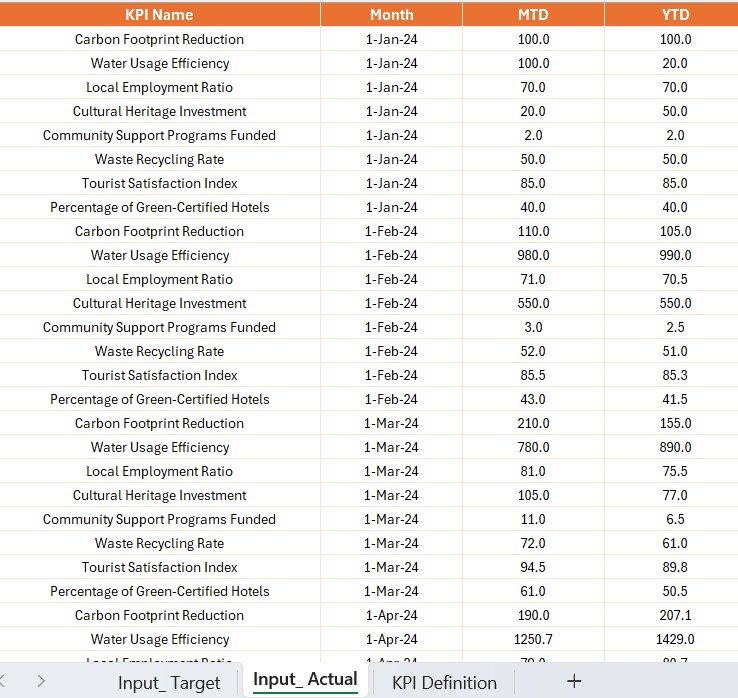
📂 Data Source & Structure
Connects directly to an Excel file structured with three sheets:
-
Input_Actual – Actual MTD & YTD numbers
-
Input_Target – Monthly and yearly targets
-
KPI Definition – Name, Group, Unit, Type, and Formula
This separation ensures accuracy, scalability, and ease of maintenance.
🌟 Advantages of Using This Dashboard
🔢 Real-Time Monitoring – Instantly track sustainability KPIs
📊 Informed Decisions – Visualize what’s working and what needs attention
♻️ Sustainability Focused – Measure eco-impact, community benefit, and efficiency
📤 Stakeholder-Ready – Easy to present to governments, NGOs, and travel boards
🌎 Benchmarking Power – Compare performance with past years or regions
🛠️ Best Practices for Maximum Impact
-
Choose Meaningful KPIs – Align with UNWTO sustainability pillars
-
Update Monthly – Keep your data fresh for reliable insights
-
Use Conditional Formatting – Let arrows and color cues do the talking
-
Drill into Insights – Leverage drill-through to explore KPI definitions
-
Segment Smartly – View trends by region, season, or tourism type
🎯 Use Cases
🏞️ National Parks – Track conservation, waste management, and visitor education
🏖️ Beach Cities – Monitor water quality, waste, and crowd control
🏙️ Urban Tourism – Assess traffic impact, local job creation, and energy use
🎭 Cultural Heritage – Measure preservation efforts and tourism revenue
🔗 Works Seamlessly With:


Reviews
There are no reviews yet.