



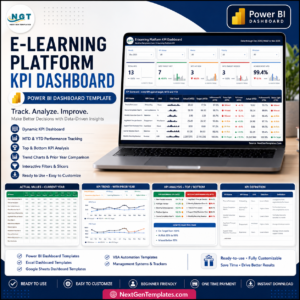
Online education platforms are thriving—but are you effectively tracking what truly matters? With student engagement, course completion, and learner satisfaction on the line, it’s critical to have real-time visibility into your performance. That’s where the Online Education KPI Dashboard in Power BI comes in. 📊📚
Designed for schools, universities, and e-learning platforms, this dashboard bridges Excel’s familiarity with Power BI’s powerful analytics. Whether you’re monitoring course performance or analyzing student feedback, this all-in-one tool helps you measure success, identify trends, and take data-backed action—without writing a single line of code.
✨ Key Features of Online Education KPI Dashboard
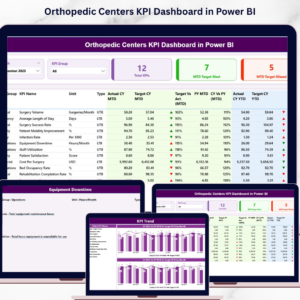
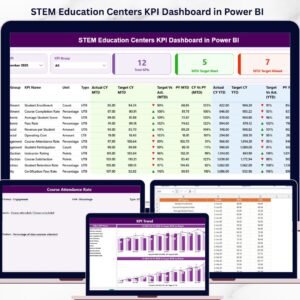
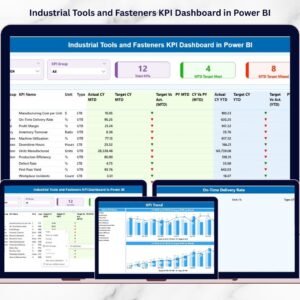
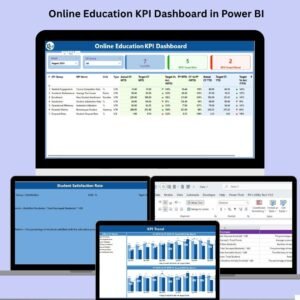
🏠 Summary Page – At-a-Glance Performance View

Month & KPI Group slicers to focus your reporting
KPI Cards show:
🔹 Total KPIs
🔹 MTD Targets Met
🔹 MTD Targets MissedTable View with all essential metrics:
🔹 KPI Number, Name, Group
🔹 Unit, Type (LTB/UTB)
🔹 Actual vs Target (MTD & YTD)
🔹 Previous Year comparisons
🔹 Green/Red arrows for visual status
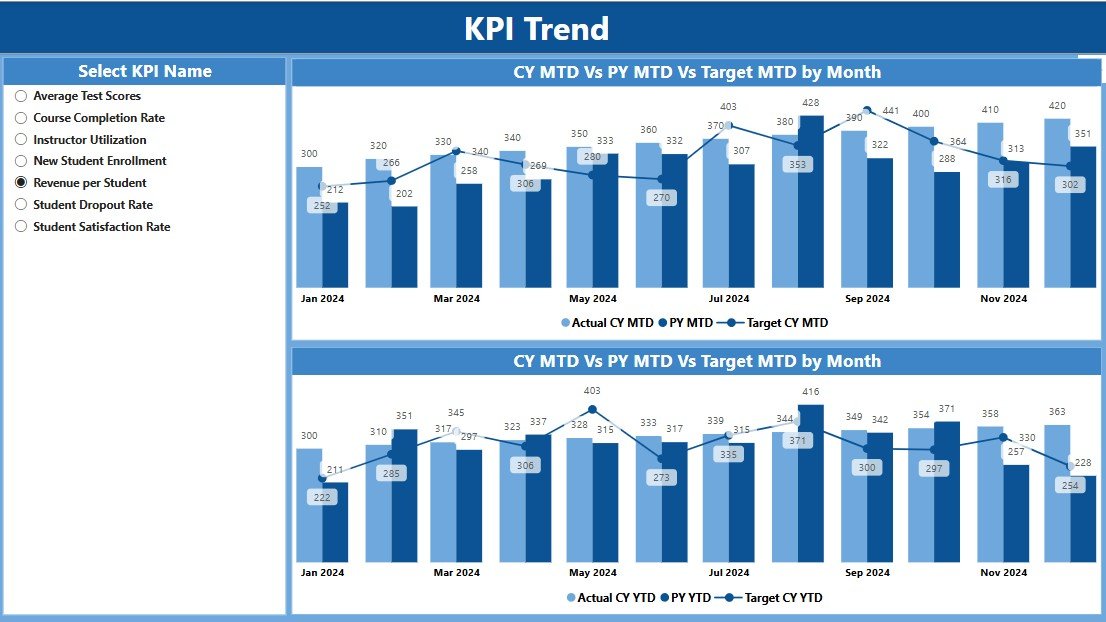
📈 KPI Trend Page – Visualize Your Progress
Select a KPI and view its trend line over time
Combo charts for:
🔹 MTD (Actual vs Target vs Previous Year)
🔹 YTD (Same structure)Clear insight into whether metrics are improving or need attention
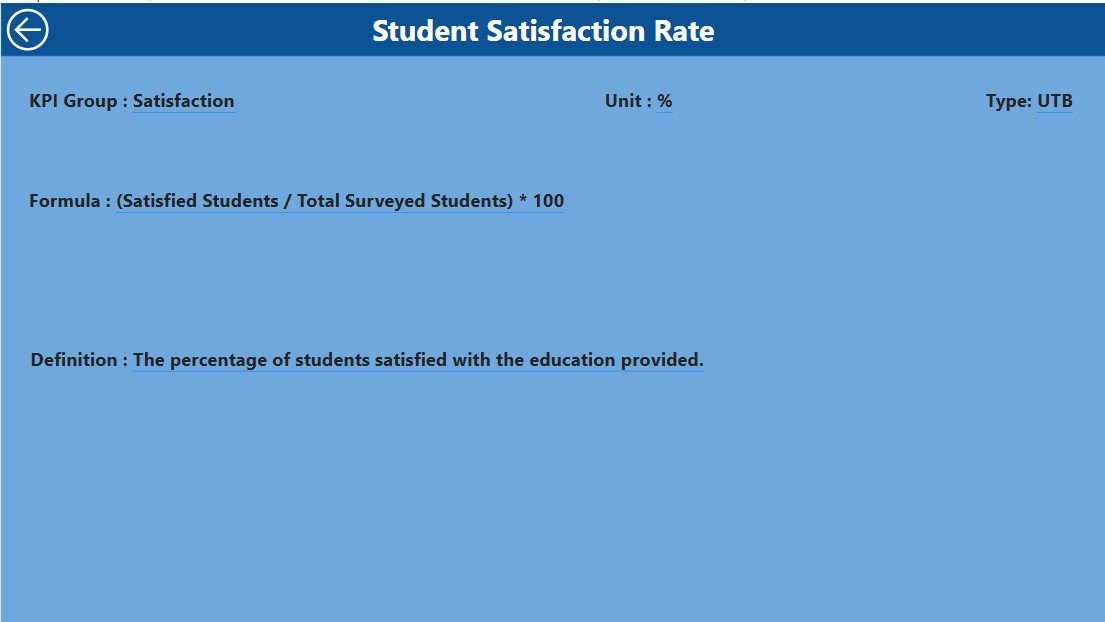
📘 KPI Definition Page – Drill-Through Clarity
Right-click a KPI in the summary table to see:
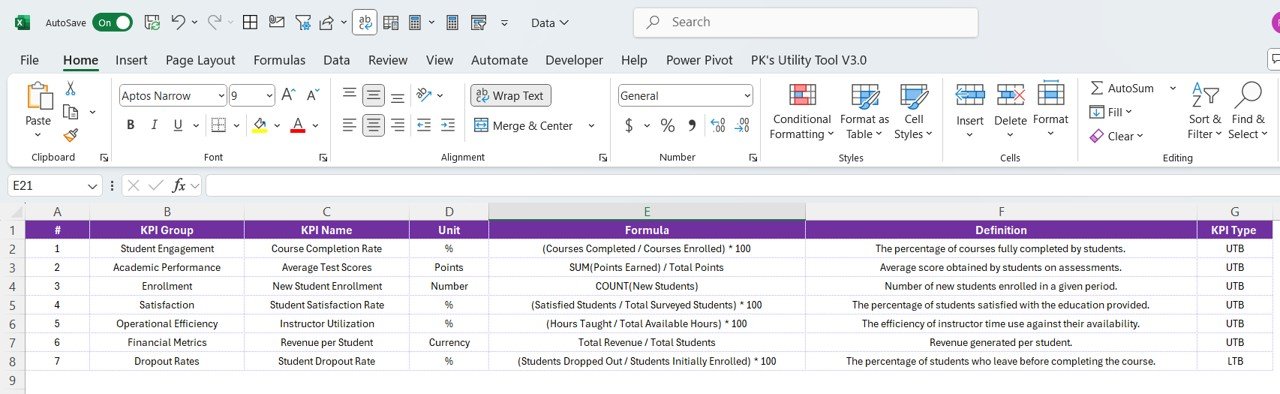
🔹 Formula
🔹 Definition
🔹 Unit & KPI TypeIncludes a Back button for easy navigation
📊 Excel-Powered Data Engine
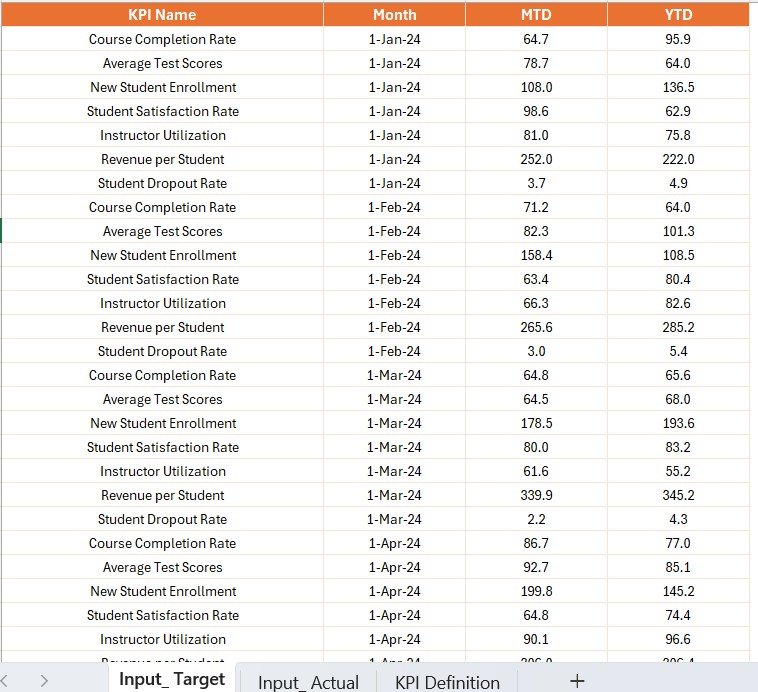
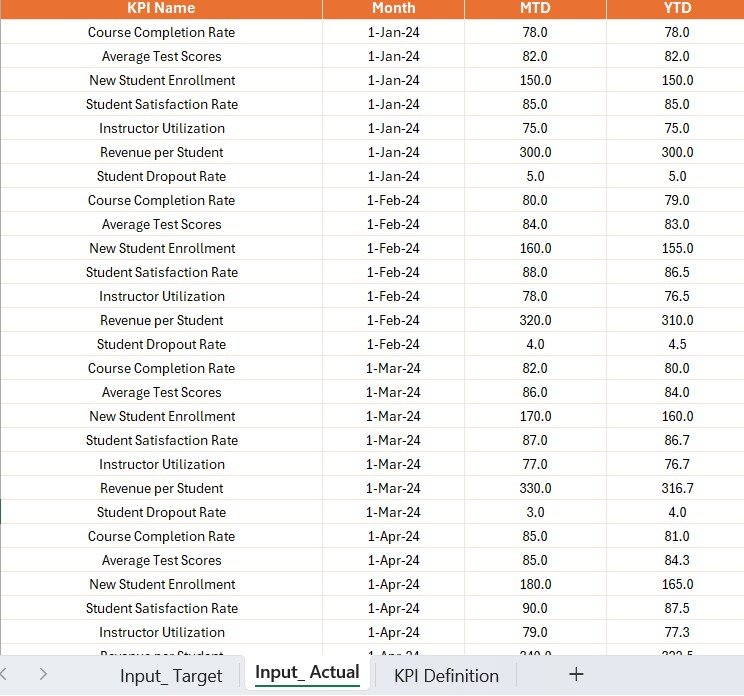
All data is managed in a connected Excel file with 3 sheets:
1️⃣ Input_Actual – Enter monthly Actuals (MTD/YTD)
2️⃣ Input_Target – Input monthly Target values
3️⃣ KPI_Definition – Set KPI Name, Formula, Group, Unit, and Type
No database or advanced setup needed—just Excel + Power BI.
📂 What’s Inside the Power BI Dashboard?
This dashboard includes:
1️⃣ Summary View – For high-level performance tracking
2️⃣ KPI Trends – For deep-dive analysis of individual metrics
3️⃣ KPI Definitions – For documentation and team alignment
4️⃣ Excel Integration – Input sheets for Actuals, Targets, and Definitions
It’s clean, structured, and powerful designed for both simplicity and insight.
👨🏫 Who Can Benefit from This Product?
Perfect for:
✅ Course Managers & Admins – Track completion, drop-off rates, satisfaction
✅ Education Analysts – Monitor month-over-month performance
✅ Instructional Designers – Assess engagement and platform efficiency
✅ Online Learning Platforms – Align content and strategy with results
✅ Small Institutes & EdTech Startups – Affordable and scalable performance tracking
If you’re in education and want to turn raw data into real impact—this dashboard is made for you.
🔗 Click here to read the Detailed blog post
🎥 Visit our YouTube channel to learn step-by-step video tutorials
Watch the step-by-step video tutorial:
Compatibility and Requirements
- Works in Power BI Desktop, which is free to download. Microsoft explains the download in Get Power BI Desktop.
- Your data sits in a connected Excel file, so you also need Microsoft Excel to edit the Input_Actual, Input_Target and KPI_Definition sheets.
Frequently Asked Questions
What pages does the dashboard have?
Three pages: Summary, KPI Trend and KPI Definition. The Summary page has Month and KPI Group slicers, KPI cards and a table of all KPIs.
Where do I enter my data?
In the connected Excel file. Enter monthly Actuals (MTD and YTD) in Input_Actual, monthly Targets in Input_Target, and the KPI name, formula, group, unit and type in KPI_Definition.
Do I need a database or any code?
No. The data comes from the Excel file and you do not write any code.
How do I see the formula and definition of a KPI?
Right-click a KPI in the Summary table and drill through to the KPI Definition page. It shows the formula, definition, unit and KPI type, with a Back button to return.
Is there an Excel or Google Sheets version?
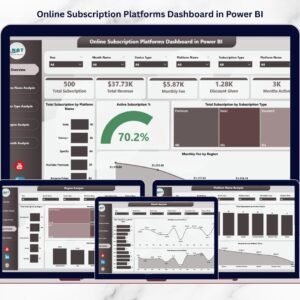
Yes. See the Online Education KPI Dashboard in Excel and the Online Education KPI Dashboard in Google Sheets.
Related Education Templates
- Online Education KPI Dashboard in Excel: the same KPIs in Excel
- Online Education KPI Dashboard in Google Sheets: the Google Sheets edition
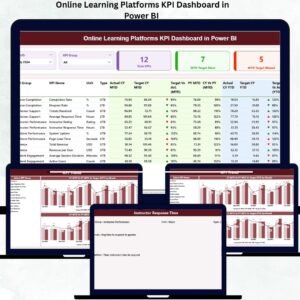
- Online Learning Platforms KPI Dashboard in Power BI: another Power BI KPI dashboard for e-learning
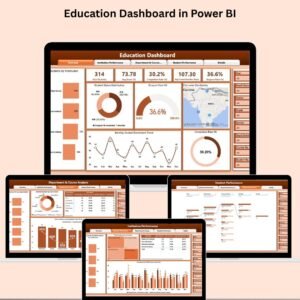
- Education Dashboard in Power BI: a wider education dashboard in Power BI
- Education & School Management Bundle: 8 Excel and Google Sheets templates for schools in one download
Browse all Power BI KPI dashboards.



























Reviews
There are no reviews yet.