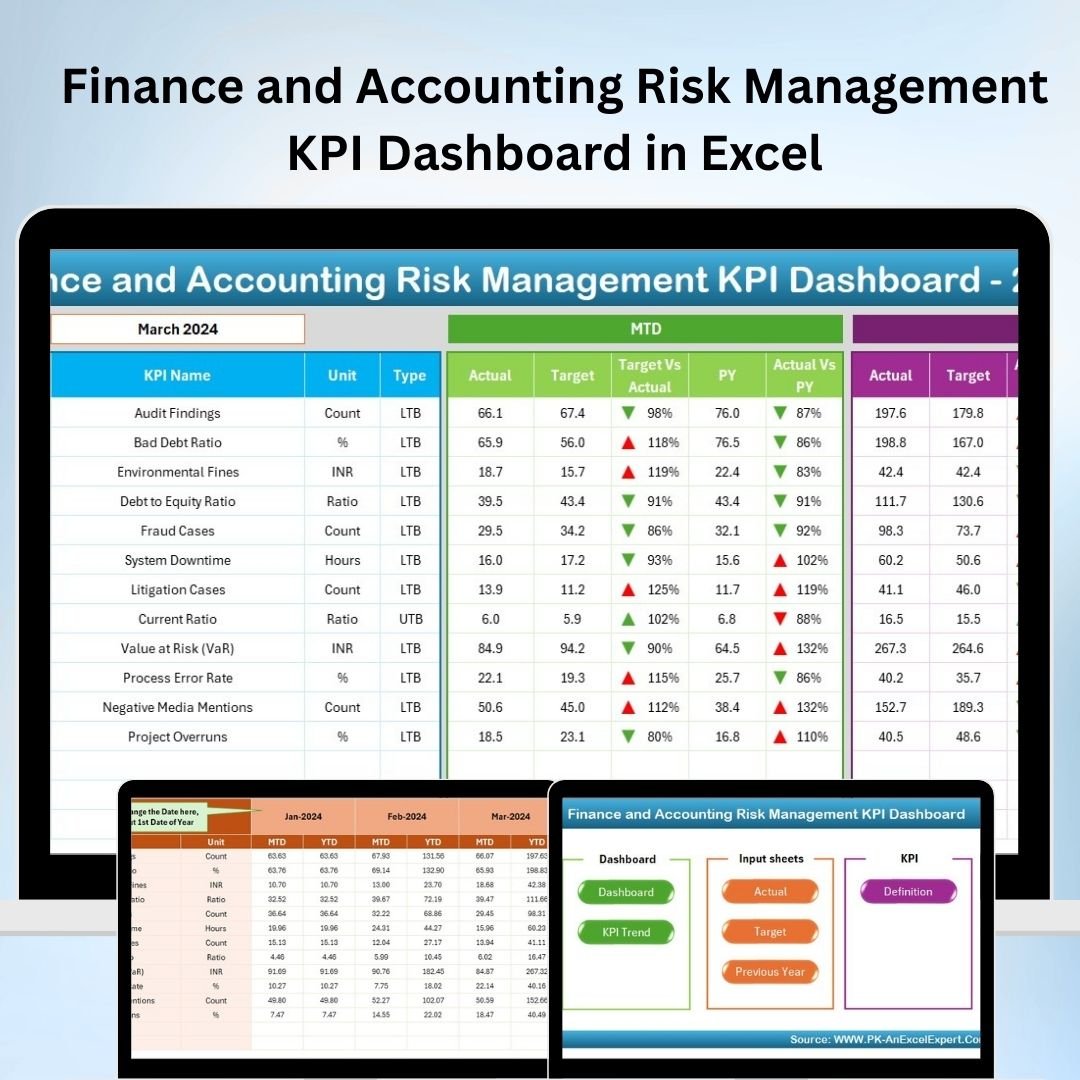


The Finance and Accounting Risk Management KPI Dashboard in Excel is an essential tool for financial professionals, accountants, and risk managers looking to efficiently track and manage key financial and risk performance indicators. This Excel-based dashboard provides a comprehensive overview of risk management strategies, enabling you to assess financial risks, monitor performance metrics, and make data-driven decisions to mitigate potential risks in your organization.
Designed for financial institutions, large enterprises, and accounting teams, the dashboard covers critical KPIs like liquidity ratios, credit risk, financial compliance, and risk-adjusted returns. With this tool, you can improve financial decision-making, ensure compliance, and reduce exposure to financial risks while optimizing your financial management processes.
Key Features of the Finance and Accounting Risk Management KPI Dashboard in Excel
📊 Risk Exposure & Financial Health Tracking
Track and manage your organization’s financial risk exposure by monitoring key metrics such as liquidity, credit risk, and operational risk. Assess your financial health with real-time data and performance metrics.
📉 Credit Risk & Default Rate Monitoring
Monitor credit risk and default rates across your portfolio. This feature helps you track the likelihood of defaults and manage the potential impact of non-performing assets.
📈 Financial Compliance Monitoring
Ensure that your organization is compliant with financial regulations. The dashboard includes performance metrics related to compliance adherence, helping you mitigate financial risks related to non-compliance.
💰 Risk-Adjusted Return on Investment (ROI)
Measure the risk-adjusted ROI of your investments. This feature helps you track how much return you’re generating relative to the risk involved, ensuring that your investment strategy aligns with your risk tolerance.
⚙️ Customizable KPIs & Metrics
Customize the dashboard to track the specific KPIs relevant to your financial and risk management needs. Tailor the metrics to reflect the unique financial goals and risk exposure of your organization.
📅 Time-Based Performance Analysis
Analyze performance over different time periods (monthly, quarterly, yearly) to identify trends and patterns in risk exposure and financial performance. Use time-based insights to make proactive adjustments to your risk management strategies.
Why You’ll Love the Finance and Accounting Risk Management KPI Dashboard in Excel
✅ Comprehensive Financial & Risk Tracking
Monitor and track multiple financial and risk performance metrics in one place. Stay on top of key indicators such as liquidity, credit risk, and compliance, all in real-time.
✅ Make Data-Driven Risk Management Decisions
Use the insights from the dashboard to make informed decisions that reduce exposure to financial risks, improve returns, and optimize your financial strategy.
✅ Ensure Financial Compliance
Track compliance with regulatory requirements and mitigate the risk of non-compliance. Keep your organization’s finances aligned with industry regulations.
✅ Maximize ROI While Managing Risk
Measure the risk-adjusted return on investments and optimize your portfolio to achieve the best possible financial outcomes with minimal risk exposure.
✅ Scalable & Customizable for Any Business
Whether you’re a small business or a large financial institution, this tool is fully scalable and customizable to suit your organization’s specific risk management needs.
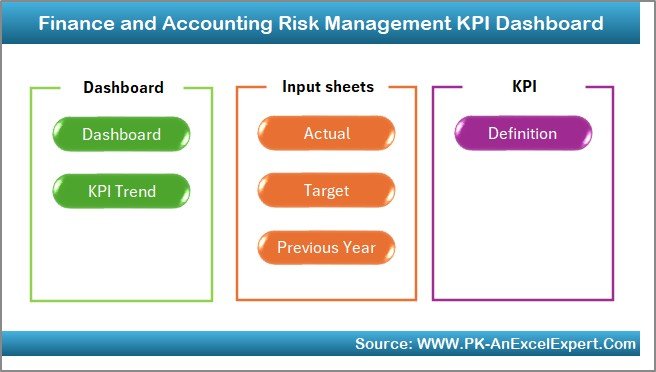
What’s Inside the Finance and Accounting Risk Management KPI Dashboard in Excel?
-
Risk Exposure Tracking: Monitor financial risk exposure across your portfolio.
-
Credit Risk & Default Rate Monitoring: Track credit risk and default rates.
-
Compliance Monitoring: Ensure adherence to financial regulations and compliance standards.
-
Risk-Adjusted ROI: Measure the risk-adjusted return on your investments.
-
Time-Based Analysis: Analyze trends in financial and risk performance over time.
-
Customizable KPIs & Metrics: Tailor the dashboard to reflect your unique financial and risk management goals.
How to Use the Finance and Accounting Risk Management KPI Dashboard in Excel
1️⃣ Download the Template: Access the Finance and Accounting Risk Management KPI Dashboard in Excel instantly.
2️⃣ Input Your Financial Data: Enter your financial and risk data, including credit risk, liquidity ratios, and compliance metrics.
3️⃣ Track KPIs & Metrics: Monitor KPIs such as risk-adjusted ROI, default rates, and financial health in real time.
4️⃣ Analyze Data & Trends: Use time-based analysis to track trends in risk exposure and financial performance.
5️⃣ Optimize Risk Management Strategy: Make informed decisions to improve financial performance and reduce risk exposure.
Who Can Benefit from the Finance and Accounting Risk Management KPI Dashboard in Excel?
🔹 Financial Institutions & Banks
🔹 Risk Management Professionals & Consultants
🔹 Accountants & Financial Analysts
🔹 Compliance Officers
🔹 Business Owners & Financial Managers
🔹 Large Enterprises with Complex Financial Operations
🔹 Small & Medium Businesses (SMBs)
🔹 Investment Managers & Portfolio Analysts
Ensure that your organization’s financial and risk management processes are optimized with the Finance and Accounting Risk Management KPI Dashboard in Excel. Track financial health, monitor risk exposure, and make informed decisions to mitigate risks and maximize profitability.
Click here to read the Detailed blog post
Visit our YouTube channel to learn step-by-step video tutorials
Youtube.com/@PKAnExcelExpert


Reviews
There are no reviews yet.