


The R&D KPI Dashboard in Power BI is a powerful, data-driven tool designed for research and development (R&D) managers, teams, and executives to track and monitor key performance indicators (KPIs) within the R&D process. This interactive, real-time Power BI dashboard provides comprehensive insights into the efficiency, progress, and success of R&D projects. Whether you’re managing product innovation, research initiatives, or testing and development cycles, this dashboard enables you to make informed, data-backed decisions to optimize R&D performance.
With customizable features and advanced data visualizations, this dashboard helps you monitor R&D activities, track resource allocation, and evaluate the return on investment (ROI) for your research and development efforts.

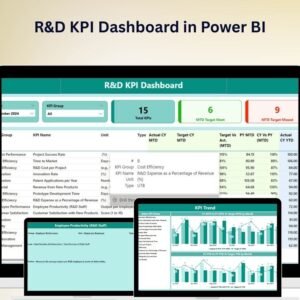
Key Features of the R&D KPI Dashboard in Power BI:
🧪 Project Performance Tracking
Monitor the progress and performance of R&D projects, track timelines, milestones, and deliverables to ensure on-time project completion.
💡 Innovation and Research Metrics
Track the number of new ideas, patents, prototypes, and innovations generated, providing insights into your team’s ability to drive new product development.
💼 Resource Allocation and Budget Tracking
Track resource usage, including personnel, equipment, and financial resources, ensuring optimal allocation and cost management across R&D projects.
📊 Time-to-Market Analysis
Measure the time it takes to move products from concept to market, optimizing R&D cycles for quicker innovation and faster market delivery.
💰 ROI and Financial Metrics
Track the return on investment (ROI) for R&D projects by comparing R&D expenses with product success and market revenue.
🚀 Why You’ll Love the R&D KPI Dashboard in Power BI:
✅ Track Project Progress – Monitor key milestones, deadlines, and deliverables for R&D projects to ensure timely completion.
✅ Optimize Innovation – Track the generation of new ideas, patents, and prototypes to assess your team’s innovative output.
✅ Ensure Efficient Resource Use – Monitor resource allocation across R&D projects, ensuring that your team is utilizing time, budget, and personnel effectively.
✅ Measure Time-to-Market – Track the time from concept to market for your products, helping to speed up R&D processes.
✅ Evaluate ROI – Track the financial success of R&D projects by comparing the costs of research with the generated revenues.
✅ Customizable and Interactive – Tailor the dashboard to suit your R&D department’s specific needs, with interactive features for real-time insights and strategic decision-making.
What’s Inside the R&D KPI Dashboard in Power BI:
-
Project Performance: Track project timelines, milestones, and deliverables to ensure R&D projects stay on schedule.
-
Innovation Metrics: Monitor the number of new ideas, prototypes, patents, and innovations produced by your R&D team.
-
Resource and Budget Management: Track the allocation of financial and human resources across R&D projects to ensure optimal usage.
-
Time-to-Market: Measure how long it takes to move products from initial research and development stages to market launch.
-
ROI Analysis: Monitor the return on investment for R&D projects by comparing research costs with market revenue and product success.
-
Custom Reports: Generate custom reports summarizing key metrics such as project performance, innovation success, resource usage, and ROI to inform strategic decision-making.
How to Use the R&D KPI Dashboard in Power BI:
1️⃣ Download the Template – Access your Power BI file instantly after purchase.
2️⃣ Input R&D Data – Enter your project data, innovation metrics, resource allocation, and financial details to start tracking KPIs.
3️⃣ Monitor Key Metrics – Use the dashboard to track project progress, innovation, resource usage, and ROI in real-time.
4️⃣ Analyze Time-to-Market – Measure the time taken for product ideas to reach the market and optimize your R&D processes.
5️⃣ Generate Reports – Create detailed reports summarizing key R&D performance metrics for strategic decision-making and analysis.
Who Can Benefit from the R&D KPI Dashboard in Power BI:
-
R&D Managers and Directors
-
Product Development Teams
-
Innovation and Research Teams
-
Financial Analysts in R&D
-
Project Management Teams in R&D
-
Executives and Stakeholders
-
Business Analysts
-
Consultants and Advisors for R&D Departments
The R&D KPI Dashboard in Power BI is the perfect tool for managing and optimizing your research and development efforts. By offering real-time insights into key metrics such as project performance, innovation output, resource allocation, and ROI, this dashboard ensures that your R&D team operates efficiently and delivers maximum value to the business.
Click here to read the Detailed blog post
https://www.pk-anexcelexpert.com/r-d-kpi-dashboard-in-power-bi/
Visit our YouTube channel to learn step-by-step video tutorials
Youtube.com/@PKAnExcelExpert


Reviews
There are no reviews yet.