


The Hospital Emergency KPI Dashboard in Power BI is an advanced, interactive tool designed for hospital administrators, healthcare managers, and emergency department (ED) teams to efficiently track key performance indicators (KPIs) related to hospital emergency services. This Power BI-based dashboard helps you monitor the performance of your emergency department in real time, track patient flow, assess response times, and ensure the delivery of high-quality care to all patients.
With customizable features and real-time data tracking, this dashboard empowers healthcare professionals to make informed decisions, improve operational efficiency, and enhance patient care in the emergency department.
Key Features of the Hospital Emergency KPI Dashboard in Power BI:
⏱️ Response Time and Efficiency Tracking
Monitor key metrics such as patient wait time, time to treatment, and length of stay in the emergency department to ensure timely and efficient care delivery.
🚑 Patient Flow Management
Track patient admissions, transfers, and discharges in real-time to optimize bed management and reduce overcrowding.
📊 Patient Outcomes and Satisfaction
Analyze patient outcomes, including discharge rates, readmission rates, and satisfaction scores, to improve the overall patient experience.
💼 Staffing and Resource Allocation
Track staffing levels, shift schedules, and resource utilization to ensure the emergency department is adequately staffed and resources are used efficiently.
📈 Emergency Department Performance
Monitor the department’s overall performance, including key metrics like the number of patients treated, triage accuracy, and the overall capacity of the emergency services.
🚀 Why You’ll Love the Hospital Emergency KPI Dashboard in Power BI:
✅ Optimize Patient Flow – Monitor patient admissions, transfers, and discharges in real-time to reduce overcrowding and ensure efficient bed management.
✅ Track Response Times – Measure patient wait times and treatment times to improve emergency care efficiency and minimize delays.
✅ Enhance Patient Care – Track key outcomes such as patient satisfaction, discharge rates, and readmission rates to improve care delivery.
✅ Ensure Effective Resource Allocation – Monitor staffing levels, shift schedules, and resource utilization to ensure your emergency department runs smoothly.
✅ Customizable and Interactive – Customize the dashboard to fit your hospital’s unique needs, with interactive features for real-time monitoring and strategic decision-making.
What’s Inside the Hospital Emergency KPI Dashboard in Power BI:
-
Response Time Monitoring: Track patient wait times, time to treatment, and other critical response time metrics to ensure timely care.
-
Patient Flow Management: Monitor patient admissions, transfers, and discharges to optimize patient flow and reduce wait times.
-
Staffing and Resource Utilization: Track staffing levels, resource allocation, and shift schedules to ensure optimal department performance.
-
Patient Satisfaction and Outcomes: Measure patient satisfaction, discharge rates, and readmission rates to assess care quality and outcomes.
-
Emergency Department Capacity: Track the capacity of your emergency department to ensure it can handle the number of patients, especially during peak times.
-
Custom Reports: Generate customized reports summarizing key metrics such as response times, patient flow, and resource utilization to inform operational decisions.
How to Use the Hospital Emergency KPI Dashboard in Power BI:
1️⃣ Download the Template – Instantly access your Power BI file upon purchase.
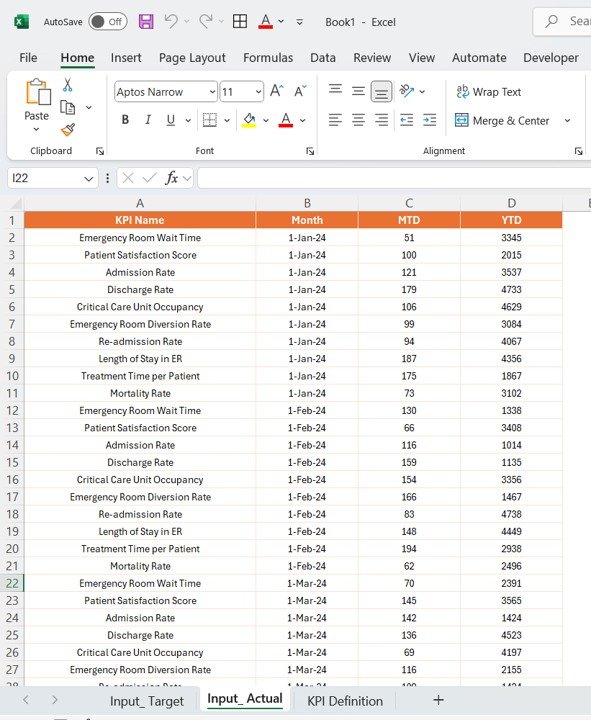
2️⃣ Input Data – Enter data on patient flow, staffing, response times, and patient outcomes to start tracking your KPIs.
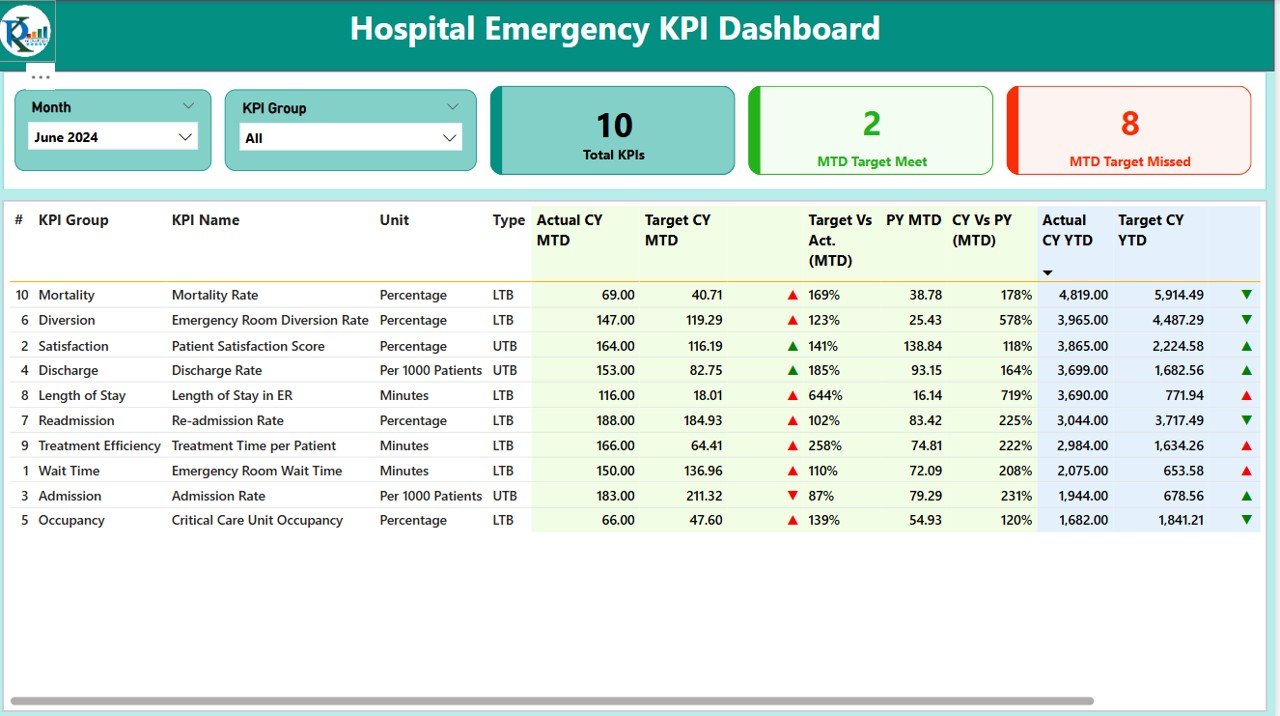
3️⃣ Monitor Key Metrics – Use the dashboard to track real-time performance data for response times, patient flow, staffing, and patient satisfaction.
4️⃣ Analyze Resource Allocation – Track staffing and resource usage to optimize department efficiency and ensure timely care.
5️⃣ Generate Reports – Create customized reports that summarize key performance metrics for better decision-making and resource management.
Who Can Benefit from the Hospital Emergency KPI Dashboard in Power BI:
-
Hospital Administrators
-
Emergency Department Managers
-
Healthcare Managers
-
Patient Care Coordinators
-
Data Analysts in Healthcare
-
Emergency Response Teams
-
Hospital Operational Teams
-
Healthcare Consultants
The Hospital Emergency KPI Dashboard in Power BI is the ideal tool for managing and optimizing your emergency department. By tracking key performance metrics such as response times, patient flow, and patient satisfaction, this dashboard helps you improve patient care and ensure the efficient functioning of your hospital’s emergency services.
Click here to read the Detailed blog post
https://www.pk-anexcelexpert.com/hospital-emergency-kpi-dashboard-in-power-bi/
Visit our YouTube channel to learn step-by-step video tutorials
Youtube.com/@PKAnExcelExpert


Reviews
There are no reviews yet.