

The best free training plan template Excel users can start with comes from Microsoft Create or Vertex42, and either covers a basic schedule well. Once you need to track completion, cost and ROI, a paid option such as the Learning and Development (L&D) KPI Dashboard in Excel at $14.99 replaces the manual work.
Last updated: November 2026
Key takeaways
- Free training plan templates from Microsoft Create and Vertex42 are enough for a simple calendar of sessions, trainers and dates, and they cost $0.
- A plan tells you what is scheduled. A KPI dashboard tells you whether the training worked, which is where paid templates start at $6.99.
- The Learning and Development (L&D) KPI Dashboard in Excel ($14.99) is our top pick: 7 sheets, MTD and YTD views, and cost per employee and ROI tracking.
- If your team lives in Google Sheets, the Training Financial Planning Dashboard ($6.99) is the cheapest way to track budget against actual training spend.
- If you already report in Power BI, the Learning & Development Dashboard in Power BI ($17.99) adds slicers for department, region, trainer type and delivery mode.
 Launch offer
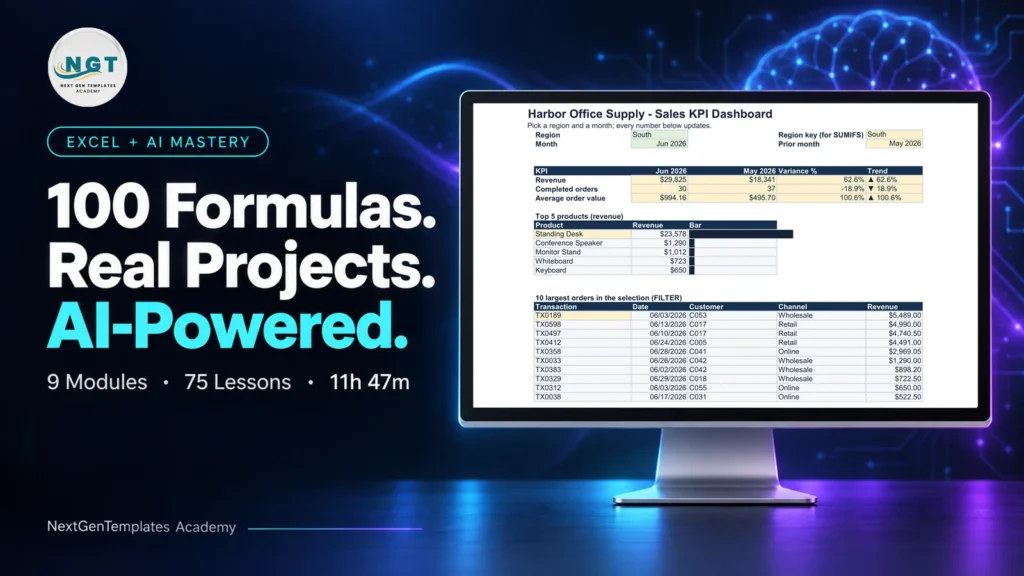
SUMIFS, XLOOKUP, FILTER, LAMBDA and checking AI-written formulas, with real business projects. 11h 47m of video by PK, with practice files, quizzes and a capstone.
Free and paid training plan templates compared
The first row is the free baseline. The other eight rows are the paid upgrades we picked from the NGT catalog. Prices are in USD.
| Template | Format | Best For | Price |
|---|---|---|---|
| Generic training plan and schedule templates (Microsoft Create, Vertex42) | Excel | A simple session calendar with no tracking | Free |
| Learning and Development (L&D) KPI Dashboard in Excel (Best overall) | Excel | HR and L&D teams proving training ROI | $14.99 |
| Learning & Development KPI Dashboard in Excel | Excel | Completion rates, skills and per-employee history | $12.99 |
| Project Management Training and Development KPI Dashboard in Excel | Excel | Training schedules and milestones for project teams | $12.99 |
| Skill Development Missions KPI Dashboard in Excel | Excel | Skilling programs tracking enrollments to placements | $14.99 |
| Training and Development Dashboard in Google Sheets | Google Sheets | Shared HR teams tracking cost and feedback | $9.99 |
| Training Financial Planning Dashboard in Google Sheets (Best value) | Google Sheets | HR and finance watching training budgets | $6.99 |
| Training and Development Dashboard in Power BI | Power BI | Skill gap analysis and engagement | $17.99 |
| Learning & Development Dashboard in Power BI | Power BI | Trainer and delivery mode analysis | $17.99 |
How we picked these
We searched the NGT catalog for training, learning and development dashboards across Excel, Google Sheets and Power BI. We kept paid templates that track training activity, cost or outcomes, and we dropped anything only loosely related to training, such as general project or event planners.
The free row is deliberately generic. We name Microsoft Create and Vertex42 because both publish free Excel templates, but we do not list specific file names or promise what any individual download contains. Check each file before you rely on it.
Each paid product is described only from its own product page. We did not test every dashboard with your data, so treat the use cases below as examples of how to apply them.
What does a free training plan template in Excel actually give you?
A free training plan template is usually a grid: one row per session, with columns for topic, trainer, audience, date, duration and status. That is useful. It replaces a pile of emails with one sheet, and it costs nothing.
You can find starting points on Microsoft Create, which hosts Microsoft’s own Office templates, and on Vertex42, which is a long-standing source of free Excel spreadsheets. Both are fine for a first version of a training calendar.
What a plain plan cannot do is answer the questions your manager will ask in the second quarter. How many people finished? What did it cost per employee? Did the spend match the budget? Those questions need a data layer and a reporting layer, which is the gap the templates below fill.
The 8 best training plan upgrades for 2026
1. Learning and Development (L&D) KPI Dashboard in Excel (best overall)
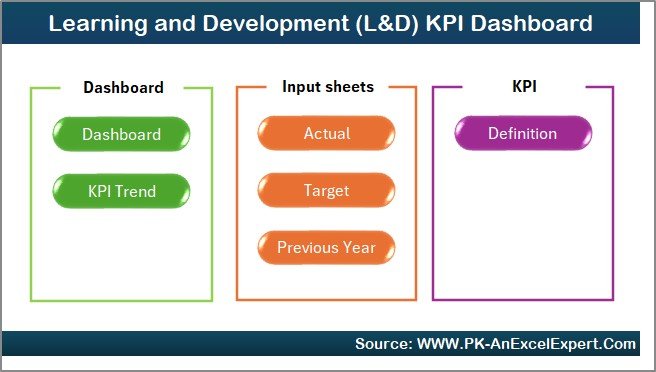
This is the one we would buy first. It takes a training plan and turns it into a monthly performance review, entirely in Excel formulas with no macros.
Who it is for: HR and L&D teams that need to show leadership what training delivers.
- 7 sheets: Home, Dashboard, KPI Trend, Actual Numbers, Target, Previous Year and KPI Definition
- Month selector with MTD and YTD comparison
- Actual vs target vs previous year, with conditional formatting arrows
- KPI trend charts for long-term evaluation
- Cost per employee and ROI tracking
Use cases: set a completion-rate target in the Target sheet and watch the gap close each month; compare this year’s training cost per employee with last year’s; keep one definitions sheet so HR and finance read the same KPI the same way; use the month selector to prepare a quarterly review in minutes instead of rebuilding a report.
Price: $14.99. Get the L&D KPI dashboard in Excel.
Best for: teams graduating from a schedule sheet to measured training outcomes. We rank it first because it covers targets, prior-year comparison and ROI in a single file.
2. Learning & Development KPI Dashboard in Excel

This dashboard is built around the employee. It shows training progress, skill development and each person’s training history in one place.
Who it is for: HR managers, team leaders and organizational development specialists.
- Course completion rates and progress tracking
- Skill acquisition, certifications and competencies over time
- Employee training overview with courses completed and status
- Training costs against performance improvement
- Time-based trend analysis
Use cases: check who is behind on mandatory courses before a deadline; review an individual’s development at an appraisal; follow new hires from onboarding training into ongoing skill building; compare what a program cost with the performance change afterwards.
Price: $12.99. See the Learning & Development KPI dashboard.
Best for: managers who care more about individual progress than about a target-versus-actual scorecard.
3. Project Management Training and Development KPI Dashboard in Excel

This is the closest of the eight to a true training plan, because it includes schedules and milestones alongside the KPIs.
Who it is for: HR managers, training coordinators and project managers running training for project teams.
- KPIs such as completion rates, post-training performance, training hours and skill assessments
- Participant progress through courses, assessments and feedback
- Individual development: skill improvements, certifications, role advancements
- Visual timelines for upcoming sessions and key milestones
- Customizable to your project’s needs
Use cases: plan a certification path for a project office and see who is on track; log training hours per person and compare with assessment results; keep the next sessions and deadlines visible to everyone involved.
Price: $12.99. Open the project management training dashboard.
Best for: anyone who wants the schedule and the scorecard in one workbook.
4. Skill Development Missions KPI Dashboard in Excel
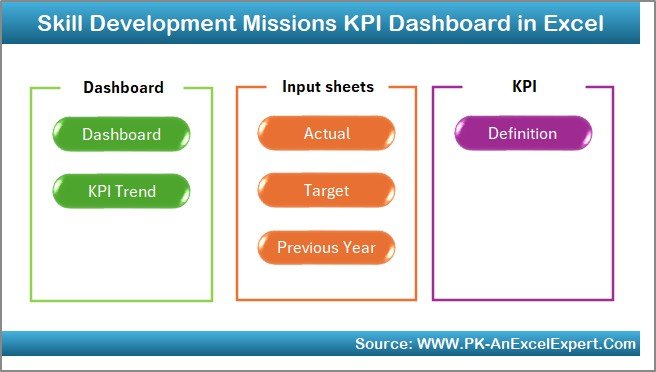
This template is aimed at skilling programs that run at scale: government missions, training institutions and development agencies.
Who it is for: program managers who report on enrollments, training, certifications and placements.
- Centralized KPI tracking for the full pipeline from enrollment to placement
- Month and year view with automatic MTD and YTD calculations
- Target vs actual with automatic variance, plus previous year comparison
- KPI trend charts and a clear KPI definition framework
- Excel only, easy to adapt to different missions, regions or programs
Use cases: report one region’s placements against target; compare this year’s certifications with last year’s; replace several scattered spreadsheets with one monthly review file.
Price: $14.99. View the skill development missions dashboard.
Best for: large skilling programs where outcomes like placements matter as much as attendance.
5. Training and Development Dashboard in Google Sheets
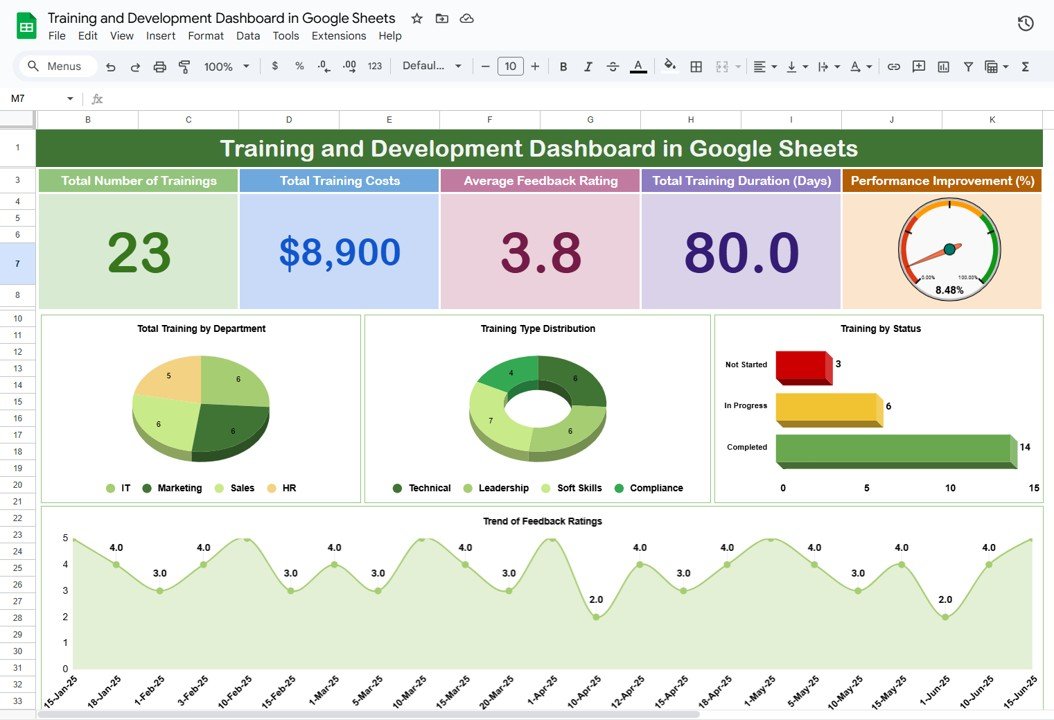
If your HR team already shares files in Google Drive, this is the easiest way to move from a static plan to a live one.
Who it is for: HR managers and L&D coordinators who work together in the cloud.
- Dashboard tab with cards for total trainings, total training cost, average feedback rating and total duration in days
- Cost analysis by department, training type, location and end date
- Performance improvement analysis by training type, department or trainer
- Search tab and a central data tab
- Customizable KPIs with automatic updates
Use cases: see which department takes the biggest share of training cost; compare the effect of different training methods; find a specific employee’s record through the search tab.
Price: $9.99. Try the Google Sheets training dashboard.
Best for: collaborative HR teams who want cost and feedback in one shared sheet.
6. Training Financial Planning Dashboard in Google Sheets (best value)

This one focuses on money. It is the lowest-priced template in the list, and it answers the budget question a plain schedule cannot.
Who it is for: HR, L&D and finance teams who share responsibility for the training budget.
- Allocated versus utilized budget, with variance in USD and overspent budget
- Overspending alerts by department and program
- Department insights: variance, training count and duration
- Program-level breakdown of cost-effective and costly programs
- Trainer-focused budget variance and a search tool
Use cases: flag a department that has used its allocation early in the year; compare programs to see which cost most per session; give finance read access so both teams look at the same numbers. For a wider look at budget tracking, see our guide to training budget dashboards.
Price: $6.99. Get the training financial planning dashboard.
Best for: keeping training spend honest at the lowest price in this roundup.
7. Training and Development Dashboard in Power BI

Choose this when your organization already uses Power BI and wants training data next to other HR reporting.
Who it is for: HR managers, training teams and business leaders.
- Real-time tracking of completion rates, progress and skills development
- Skill gap analysis aligned with business needs
- Engagement and feedback measurement
- Interactive drill-down with customizable KPIs
- Time-based insights across different periods
Use cases: spot skill gaps that training has not closed; judge whether a program is engaging by looking at participation and feedback; drill from a company-level completion rate to the detail behind it.
Price: $17.99. Explore the Power BI training dashboard.
Best for: skill gap analysis in a Power BI environment.
8. Learning & Development Dashboard in Power BI
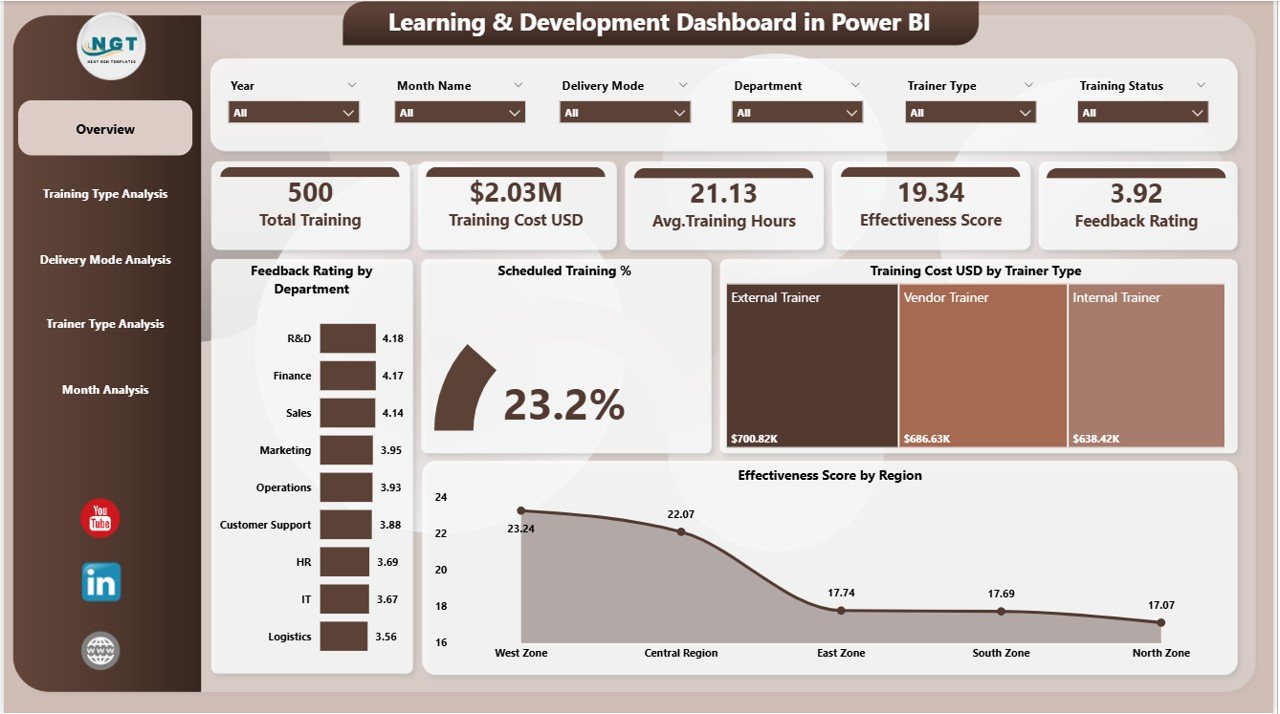
This dashboard has five analytical pages, each answering a different L&D question.
Who it is for: HR leaders who need to compare trainers, delivery modes and cost.
- Slicers for Month, Department, Region, Trainer Type and Training Type
- Four KPI cards: Total Trainings Conducted, Scheduled Training %, Average Feedback Rating and Overall Effectiveness Score
- Training cost visibility and feedback and effectiveness tracking
- Trainer performance analysis and delivery mode comparison: classroom, online and hybrid
- Monthly trend monitoring and automated reporting
Use cases: see whether online sessions earn better feedback than classroom ones; identify top trainers by rating; compare cost across departments before the next budget round.
Price: $17.99. See the Learning & Development Power BI dashboard.
Best for: deciding between classroom, online and hybrid delivery with data.
How do you choose between a free template and a paid one?
Start from the question you need answered, not from the file type. The table below maps common needs to a starting point.
| If you need to… | Start with | Price |
|---|---|---|
| List sessions, trainers and dates | A free template from Microsoft Create or Vertex42 | Free |
| Report training ROI and cost per employee in Excel | L&D KPI Dashboard in Excel | $14.99 |
| Track each employee’s courses and skills | Learning & Development KPI Dashboard in Excel | $12.99 |
| Plan sessions with milestones for a project team | Project Management Training and Development KPI Dashboard | $12.99 |
| Control training budget in a shared sheet | Training Financial Planning Dashboard in Google Sheets | $6.99 |
| Compare trainers and delivery modes | Learning & Development Dashboard in Power BI | $17.99 |
A simple rule: if you open the file once a month to reschedule sessions, stay free. If you present numbers to anyone else, upgrade. The KPI definitions behind those numbers are explained in our post on 12 training KPIs to track.
Which training metrics should a plan include?
Even with a free template, you can add three calculations by hand. They are the core of every dashboard above.
- Completion rate = completed participants / enrolled participants x 100.
- Cost per employee = total training cost / number of employees trained.
- Budget variance = budget allocated – budget utilized. A negative result means overspend.
Worked example, with made-up numbers: a team enrolls 40 people in a course, 34 finish, and the total cost is $6,800. Completion rate is 34 / 40 = 85%. Cost per employee trained is $6,800 / 34 = $200. If the allocated budget was $7,500, the variance is $700 under budget.
Doing this by hand for every course and every month is where free templates stop being free in practice, because the time goes into the spreadsheet. A dashboard computes these for you. For a broader view, our training and learning dashboard templates guide and the L&D manager template stack show how these tools fit together, and the e-learning and EdTech templates list covers online course tracking.
When is a template NOT the right answer?
Be honest about the limits before you spend even $6.99.
- You need automatic data from an LMS. These are spreadsheet and Power BI templates. You enter or paste data. If your learning platform already has built-in reporting that your leaders trust, use that.
- You run a very small program. If you deliver a handful of sessions a year, a free calendar is enough and a dashboard adds overhead.
- You need enterprise workflows. Approvals, learner enrollment portals and certification expiry reminders belong to dedicated learning software, not to a spreadsheet.
- You have no training data yet. A dashboard cannot fix missing records. Collect attendance, cost and feedback for a couple of months first.
- Your tools are not a match. Do not buy the Power BI version if nobody in your company has Power BI.
For general planning and organizing beyond training, you can also compare spreadsheet-based workspaces in our Notion alternatives roundup, or see the similar free-versus-paid reasoning in free budget templates and planners.
Frequently asked questions
Where can I find a free training plan template for Excel?
Microsoft Create and Vertex42 both publish free Excel templates, and a search for training plan or training schedule will give you starting points. They work for listing sessions, trainers and dates. Check each file before use, because the columns and formulas differ from one download to the next.
What should a training plan template include?
At minimum: topic, audience, trainer, date, duration, delivery mode, cost and status. To measure results, add enrollment and completion counts, a feedback rating and a target for each. Those extra columns are what let you calculate completion rate and cost per employee later.
Is a free training plan template enough?
It is enough when the goal is scheduling. It stops being enough when someone asks for completion rates, cost per employee or ROI, because a free calendar does not calculate or chart them. At that point a KPI dashboard such as the $14.99 L&D dashboard saves rebuilding reports each month.
How do I calculate training ROI in Excel?
A common approach is (benefit from training – training cost) / training cost x 100. The hard part is putting a value on the benefit. The L&D KPI Dashboard in Excel includes cost per employee and ROI tracking, so the calculation sits next to your actuals and targets.
What is the difference between a training plan and a training KPI dashboard?
A training plan lists what will happen and when. A KPI dashboard measures what did happen: completion, cost, feedback and progress against target. Most teams need both. The plan feeds data into the dashboard, and the dashboard shows whether the plan is working.
Can I use these training templates in Google Sheets?
Yes, two of the eight are Google Sheets templates: the Training and Development Dashboard at $9.99 and the Training Financial Planning Dashboard at $6.99. They suit teams that share files in the cloud and want dashboards that update as new rows are added.
Do the Excel dashboards need macros?
The Learning and Development (L&D) KPI Dashboard in Excel is described as macro-free and entirely formula driven. The Skill Development Missions dashboard is described as Excel-based with no Power BI or external tools required. Check each product page for the full details before you buy.
Which training dashboard is the cheapest?
The Training Financial Planning Dashboard in Google Sheets is the lowest priced in this roundup at $6.99. It tracks allocated and utilized budget, variance and overspending by department and program. The Excel options start at $12.99.
Should I choose Excel or Power BI for training reporting?
Choose Excel if your team already works in spreadsheets and wants editable formulas, from $12.99. Choose Power BI, at $17.99, if you want slicers, drill-down and cross-department comparison, and someone already has Power BI access. Both are available for training and development.
How often should I update my training dashboard?
Monthly works for most teams. The Excel KPI dashboards use a month selector with MTD and YTD views, which fits a monthly review cycle. Update attendance, cost and feedback after each session, so the month-end review takes minutes rather than days.
Need one for equipment or facilities? See our guide to the free maintenance log template options and when a paid upgrade makes sense.
Get more training and L&D templates
Start with our top pick, the Learning and Development (L&D) KPI Dashboard in Excel for $14.99, or the Training Financial Planning Dashboard in Google Sheets for $6.99 if budget is your main concern.
Watch walkthroughs of our dashboards on the NextGenTemplates YouTube channel.