

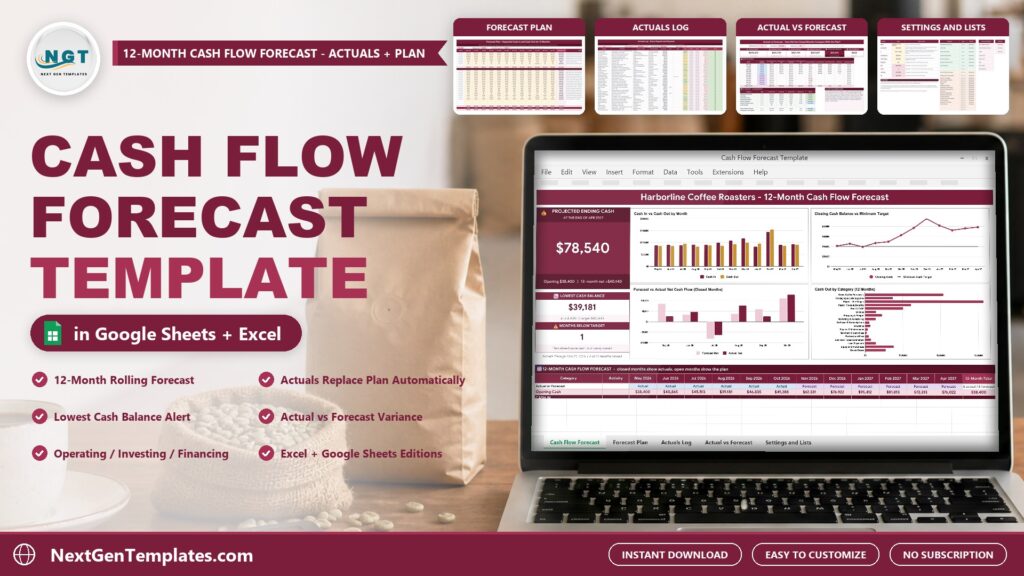
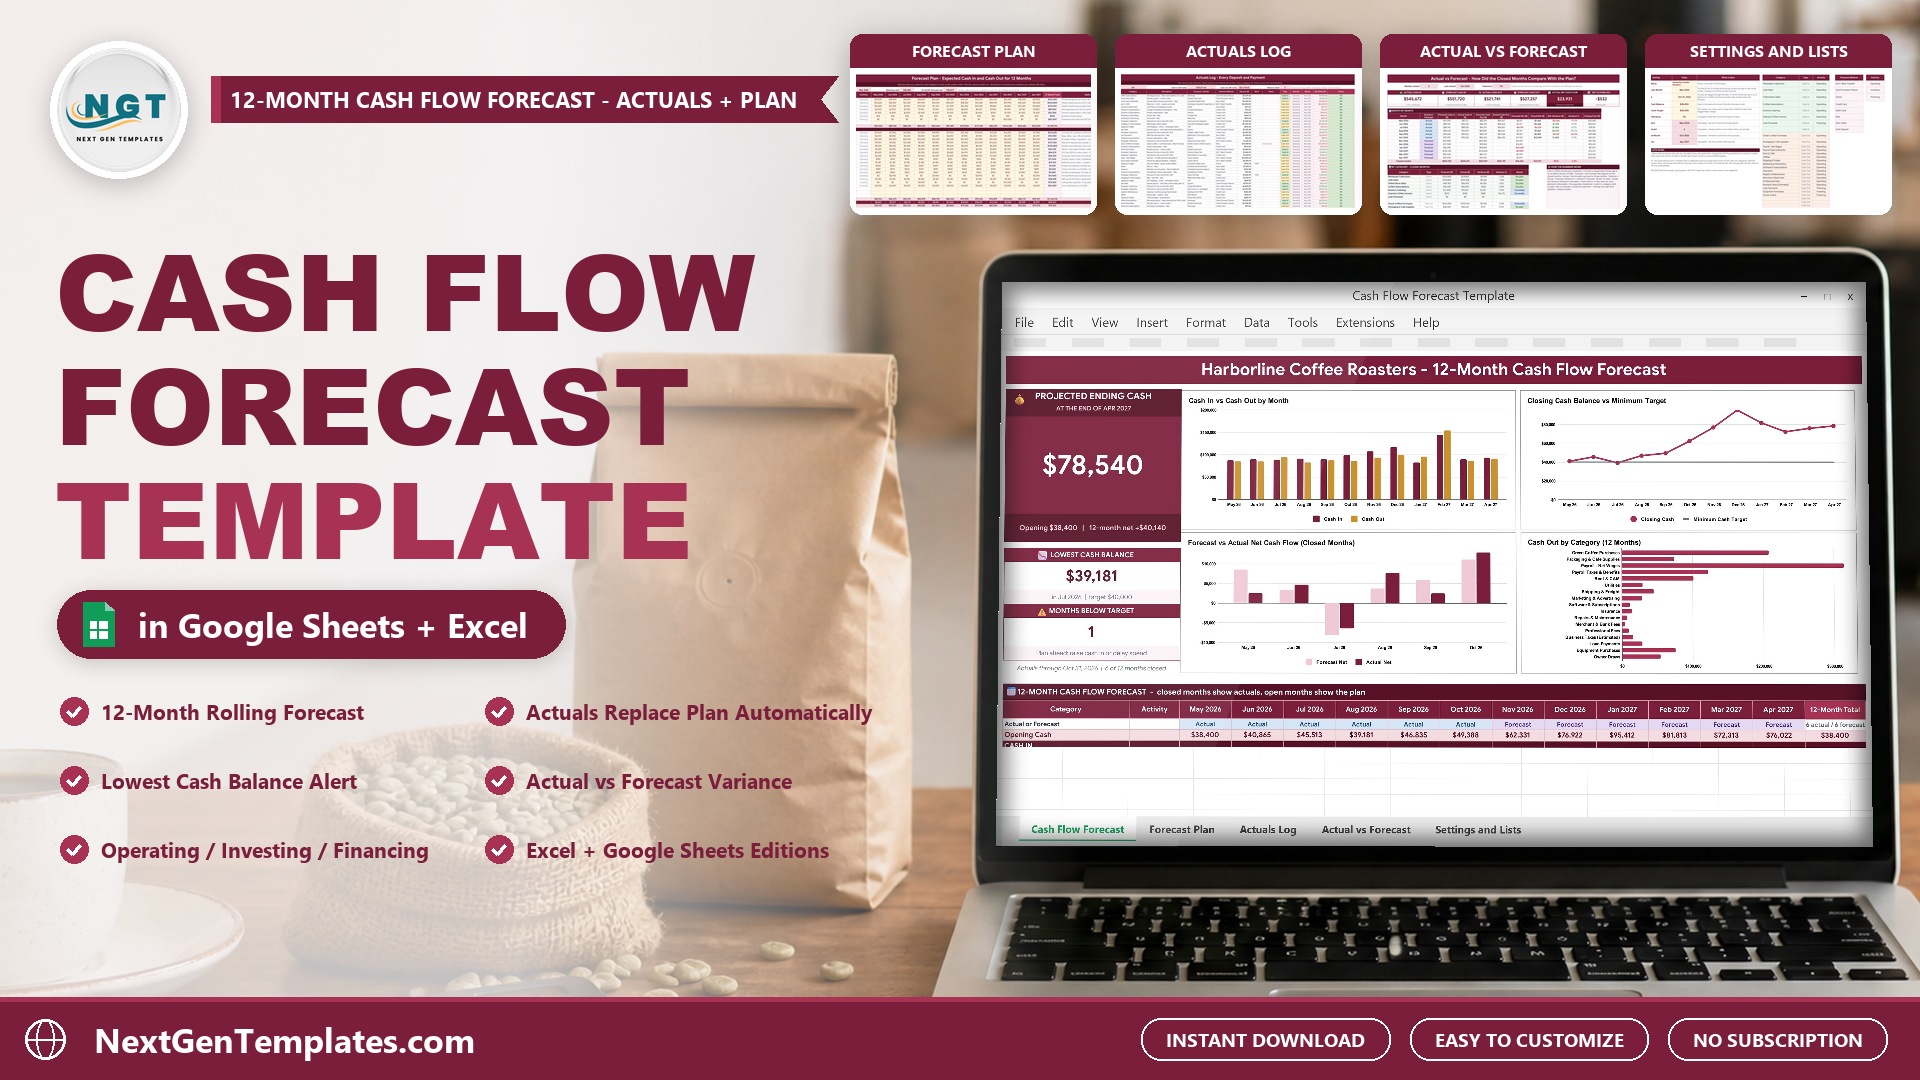
Profit on paper is one thing. Cash in the bank is what keeps a small business alive. The Cash Flow Forecast Template in Excel and Google Sheets answers the questions every owner asks: how much cash will I have at the end of the year, which month will be the tightest, will I drop below my safety cushion, and did the last few months go to plan?
🌍 Join 10,000+ customers in 180+ countries using NextGenTemplates to replace paid SaaS tools with one-time-purchase Excel, Google Sheets, Power BI and HTML templates.
Watch the Cash Flow Forecast Template in Excel and Google Sheets: 12-Month Cash Plan walkthrough
 Launch offer
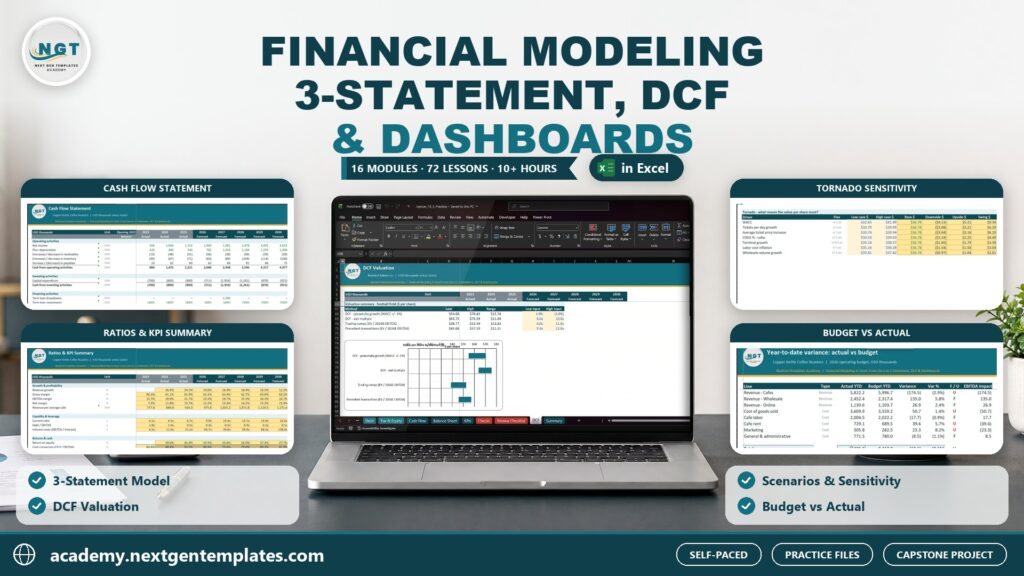
Build a linked three-statement model, a DCF valuation, scenarios and budget vs actual, plus a Power BI finance dashboard. 10h 27m of video by PK, with practice and solution files for every lesson.
What the Cash Flow Forecast Template does
- 12-month forecast: every cash in and cash out category gets one row and every month one column, with a 12-month total on the right.
- Actuals for closed months: a month that ends on or before your As-of Date shows the real figures from the Actuals Log. Later months show your plan.
- Minimum cash target: months below your cushion are flagged Below Target, and a negative balance is flagged Shortfall.
- Actual vs Forecast: see which categories came in On plan, Favorable or Unfavorable.
- Two editions: Google Sheets and Microsoft Excel (.xlsx, no macros) in one download.
This cash flow projection template is a 12 month cash flow forecast for a small business cash flow forecast of any size, and it includes sample data: a fictional coffee roaster in Portland, planned from May 2026 to April 2027, with actuals logged through October 31, 2026.
A look at the tabs
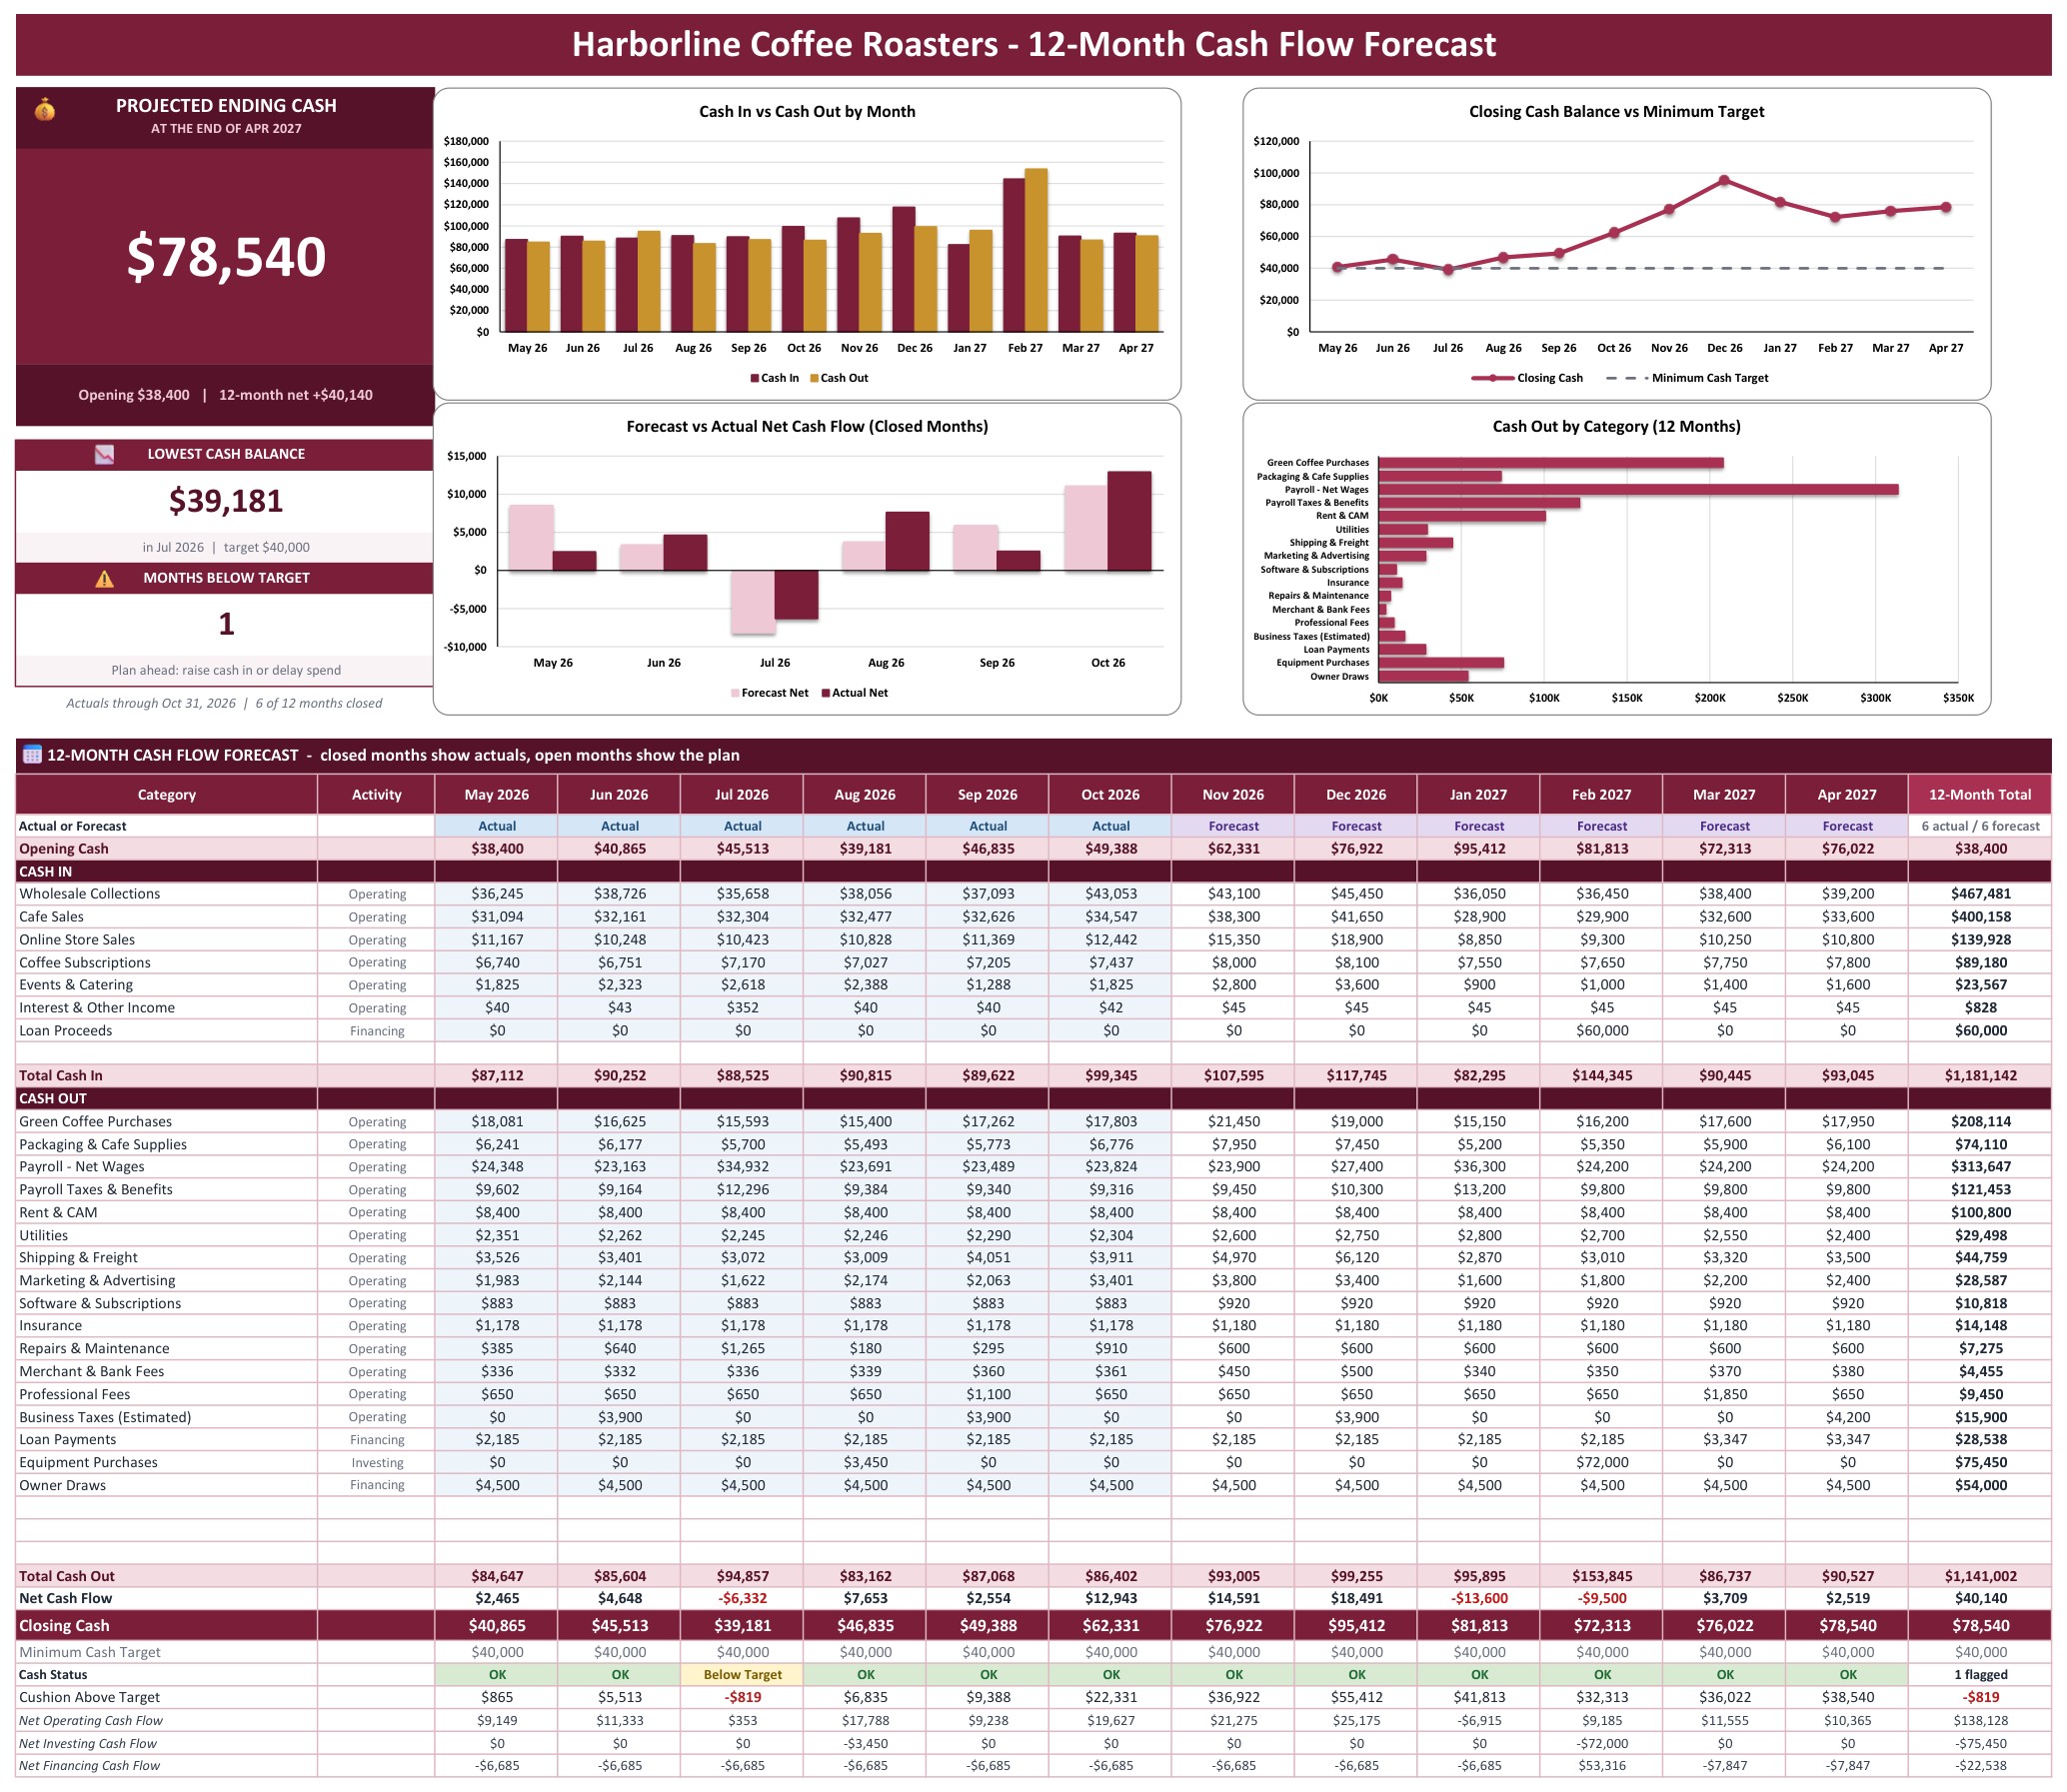
Cash Flow Forecast (Google Sheets)
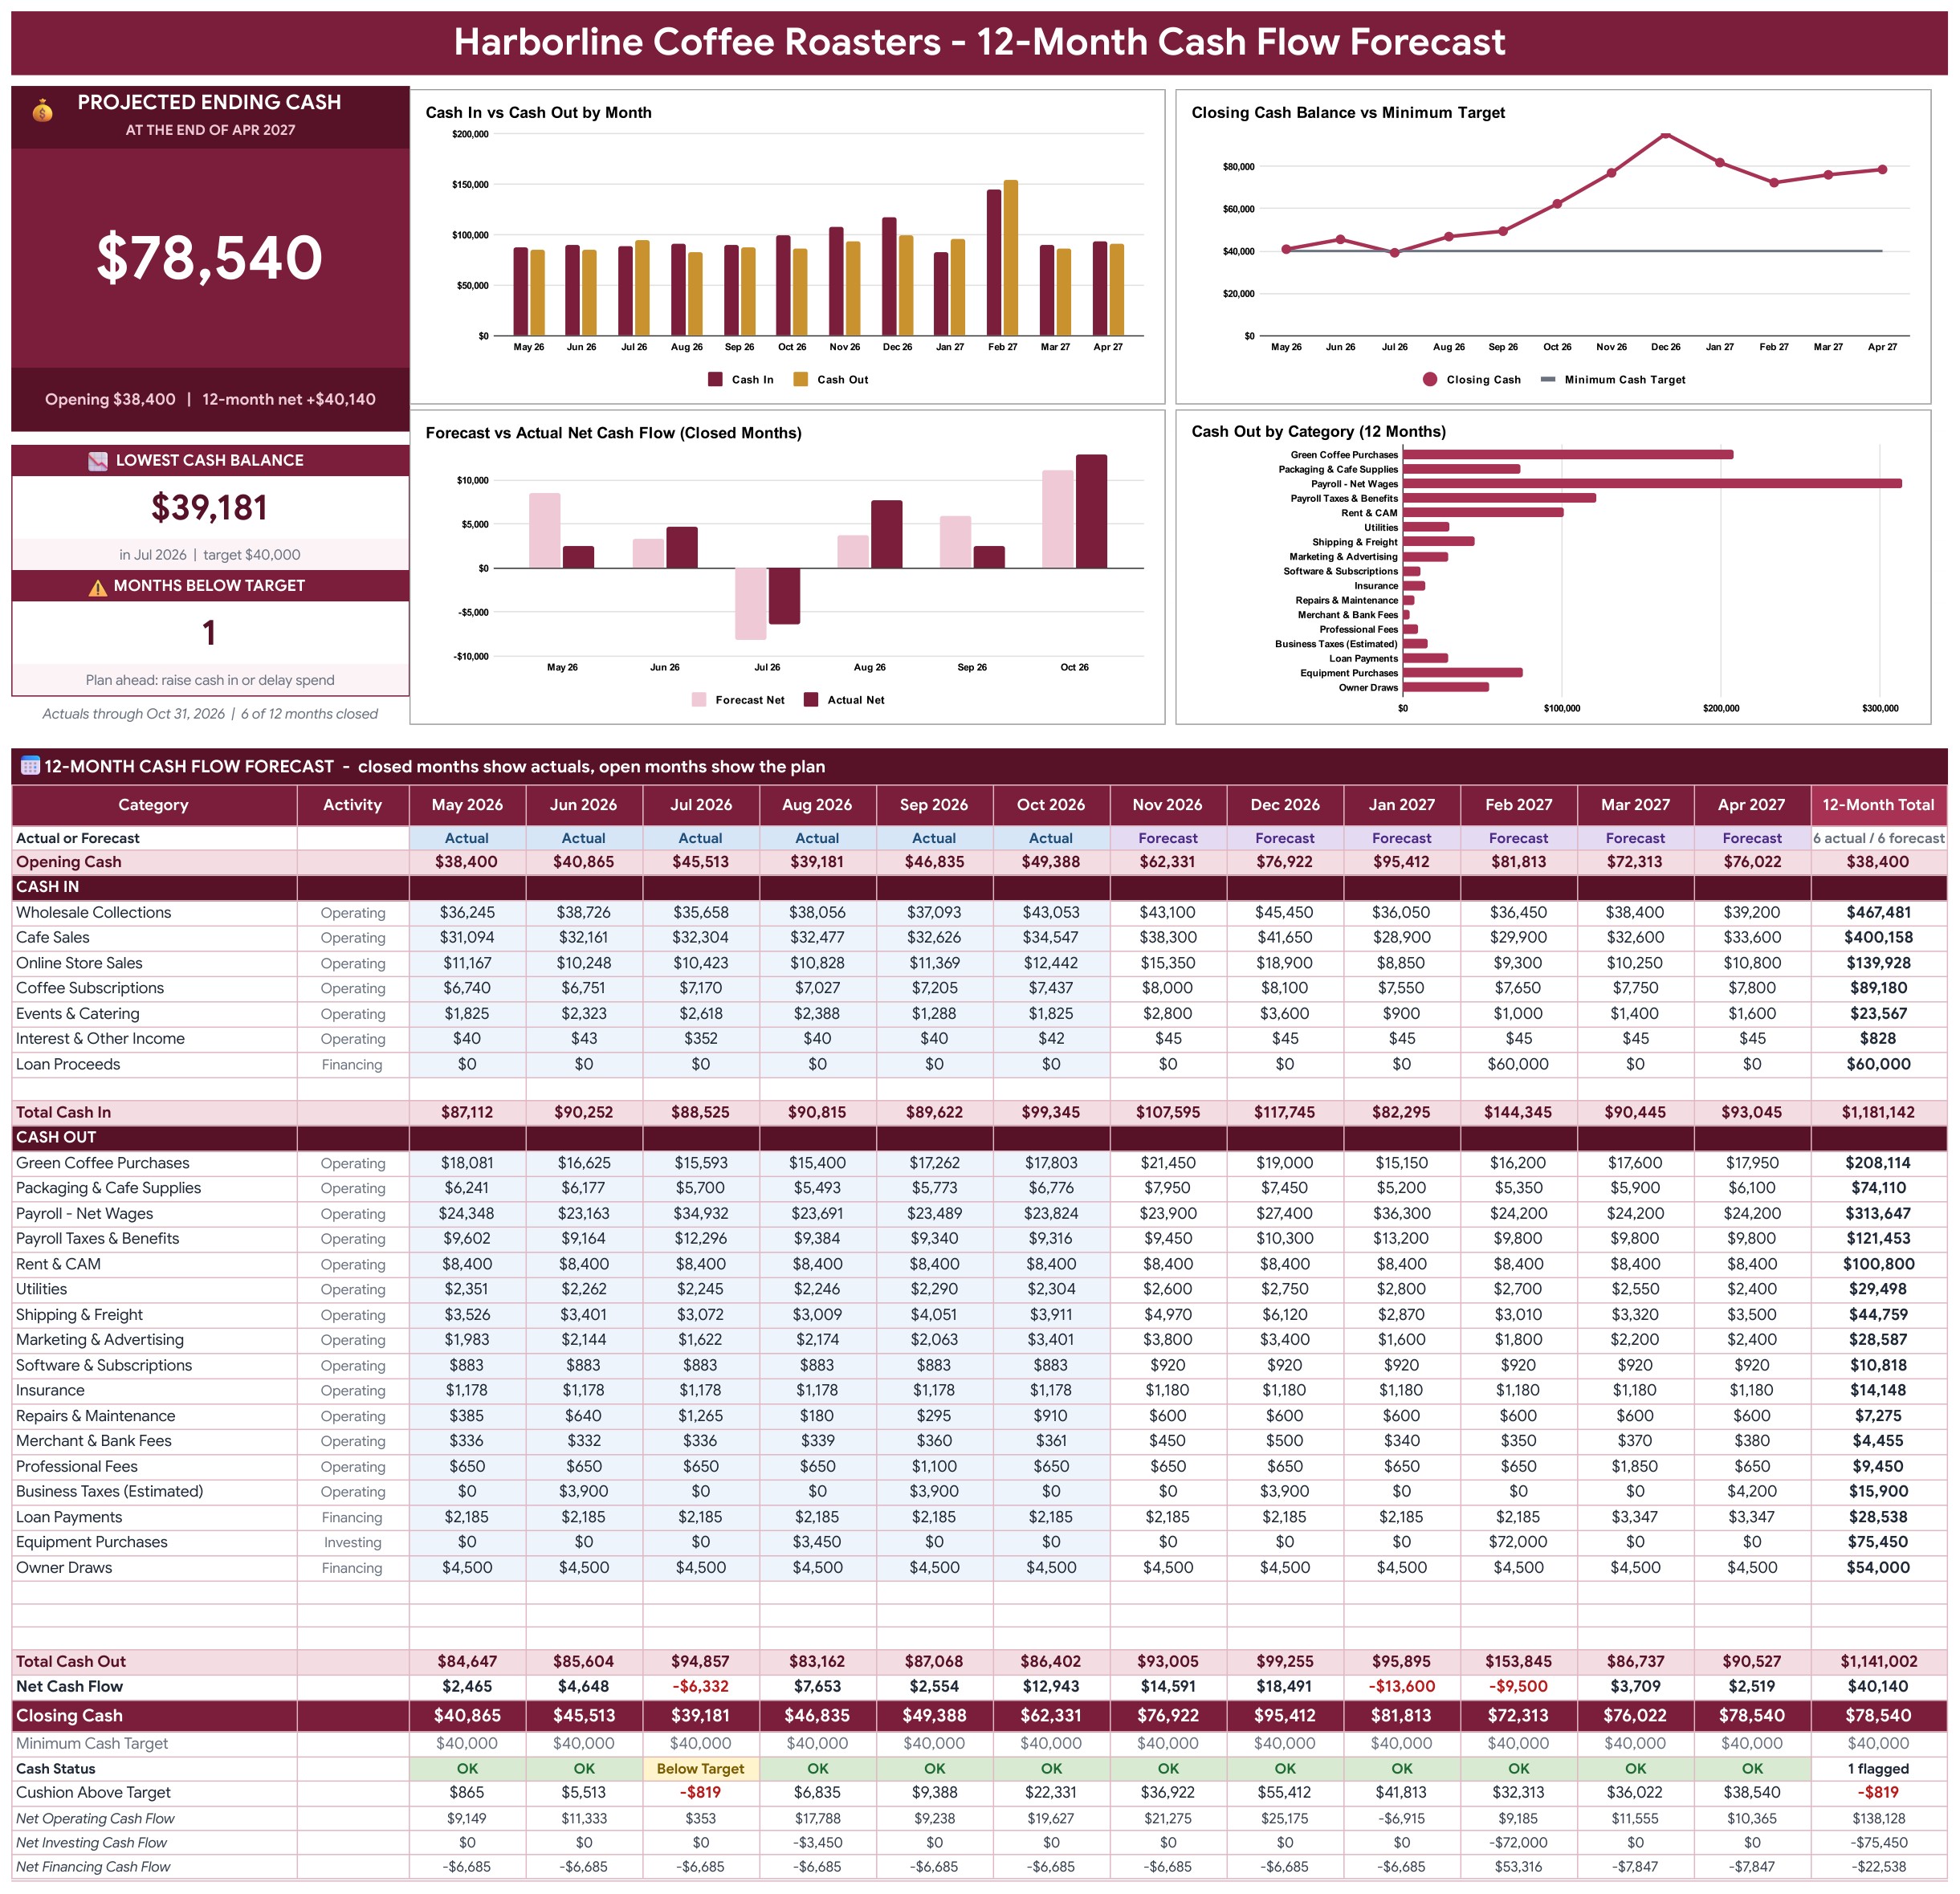
The Cash Flow Forecast tab opens with a Projected Ending Cash card, a Lowest Cash Balance tile and a Months Below Target tile beside four charts: Cash In vs Cash Out by Month, Closing Cash Balance vs Minimum Target, Forecast vs Actual Net Cash Flow for the closed months, and Cash Out by Category. Under them sits the 12-month statement, where closed months show your actuals and open months show your plan.
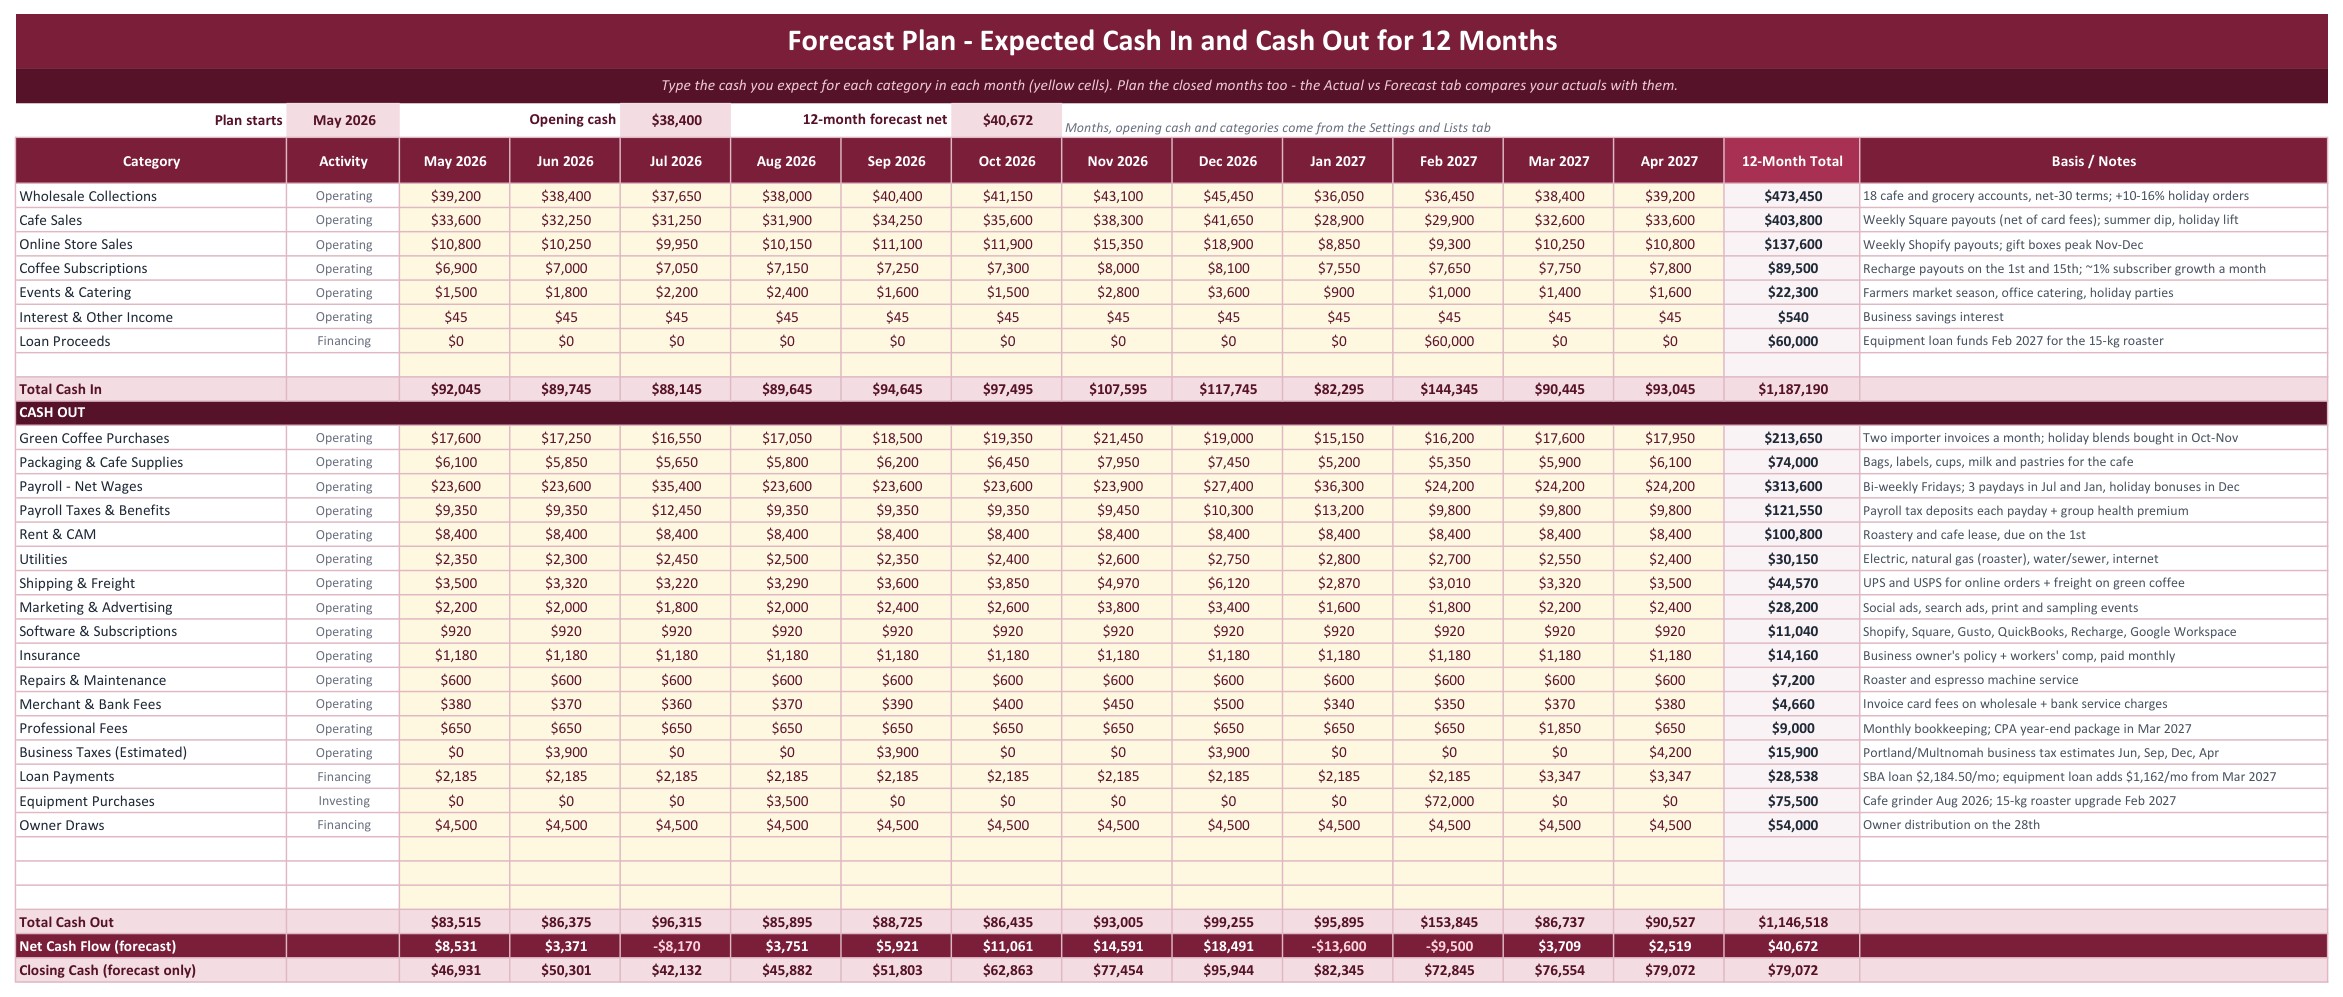
Forecast Plan (Google Sheets)
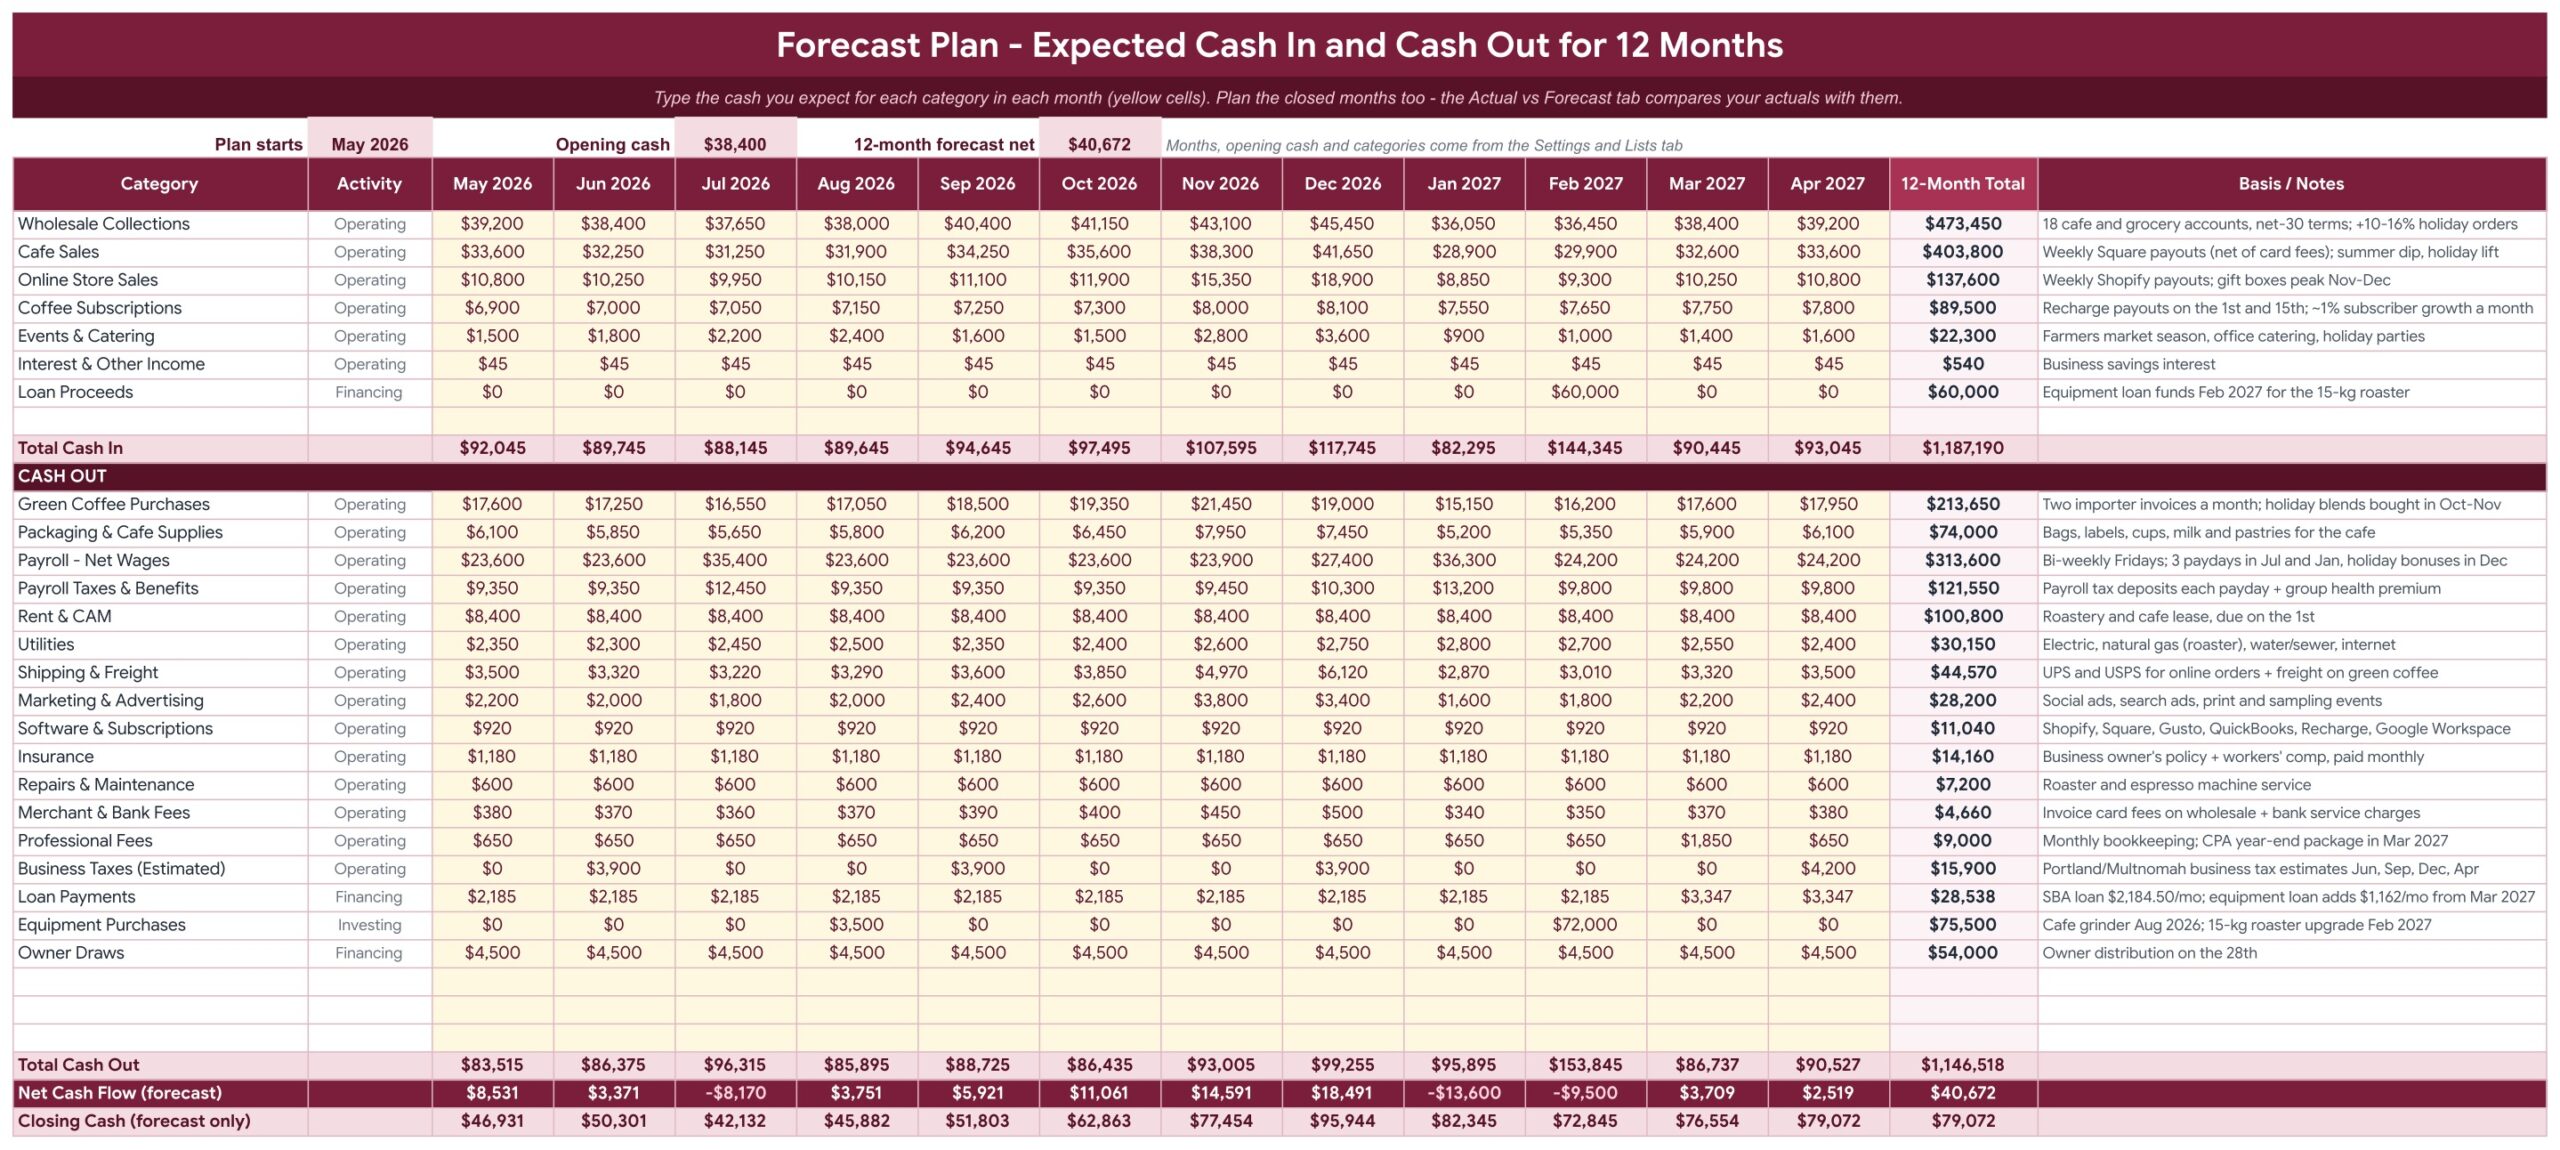
Type the cash you expect to receive and spend for each category in each of the 12 months in the yellow cells, with a Basis / Notes column for your assumptions. Totals, the forecast net cash flow and a forecast-only closing balance sit at the bottom.
Actuals Log (Google Sheets)
Log every deposit and payment in one row: date, category, description, customer or vendor, payment method and a positive amount. The type, activity, month, net effect and a Check column fill in for you, and the log holds 2,000 rows.

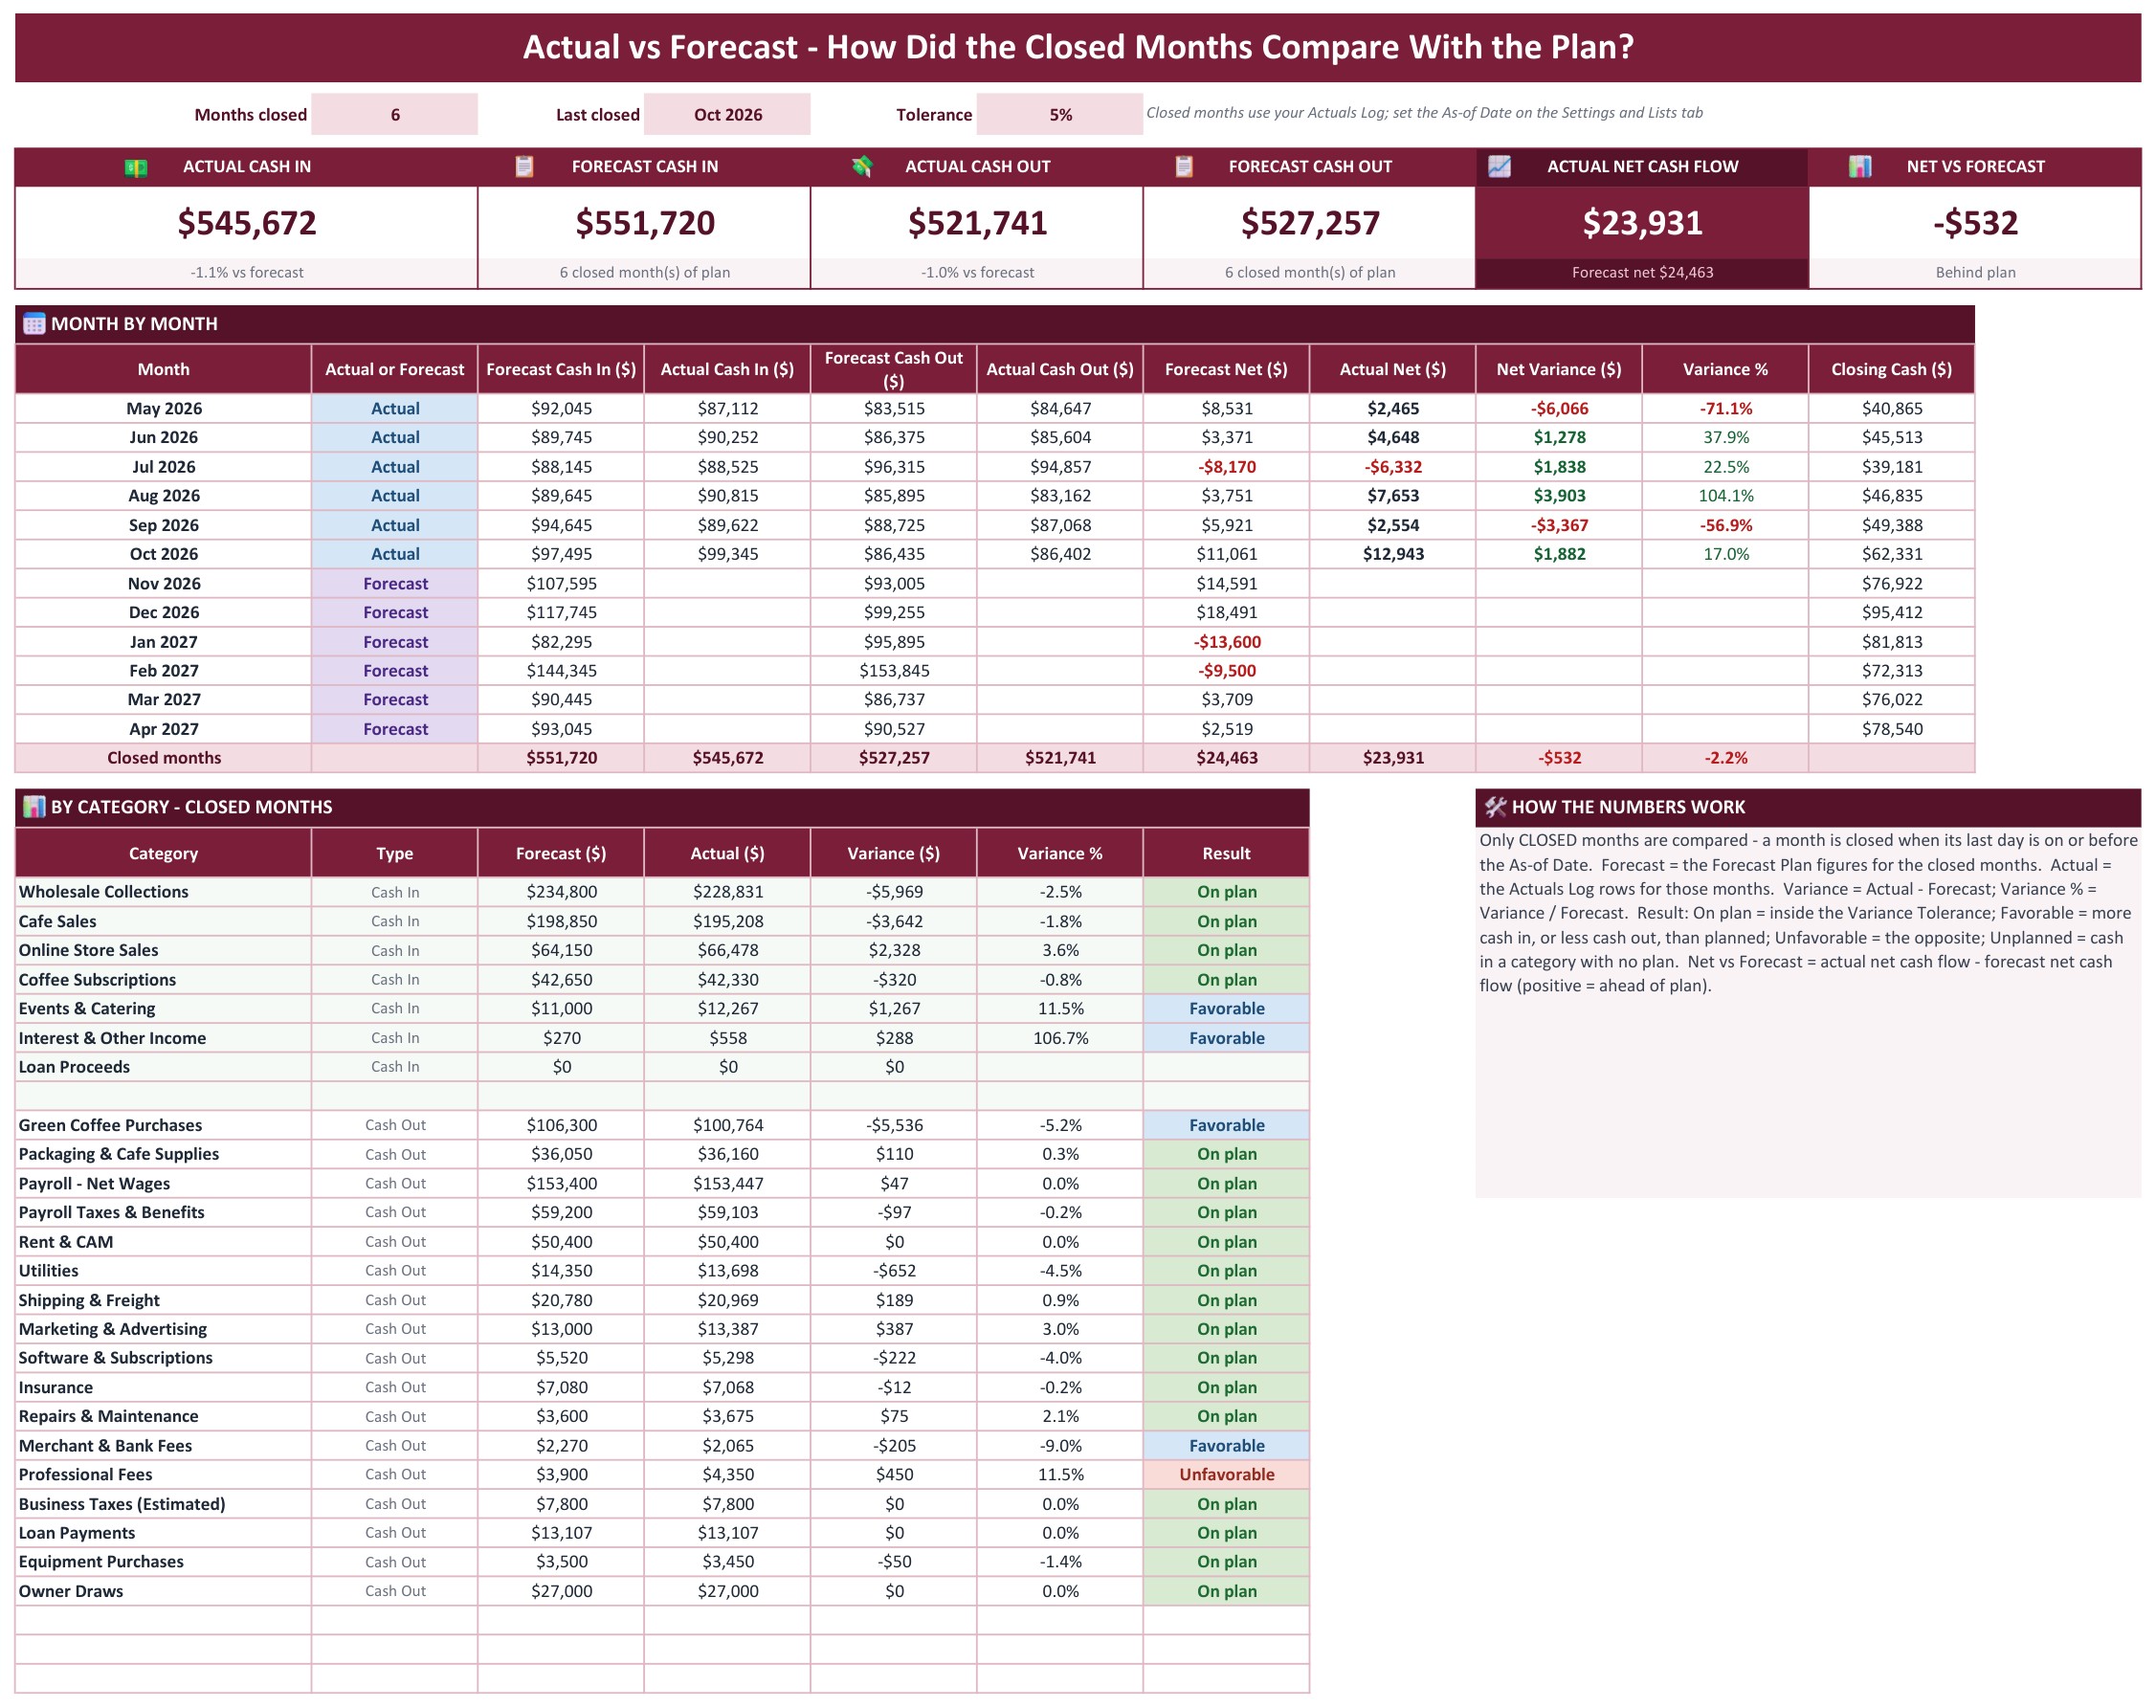
Actual vs Forecast (Google Sheets)
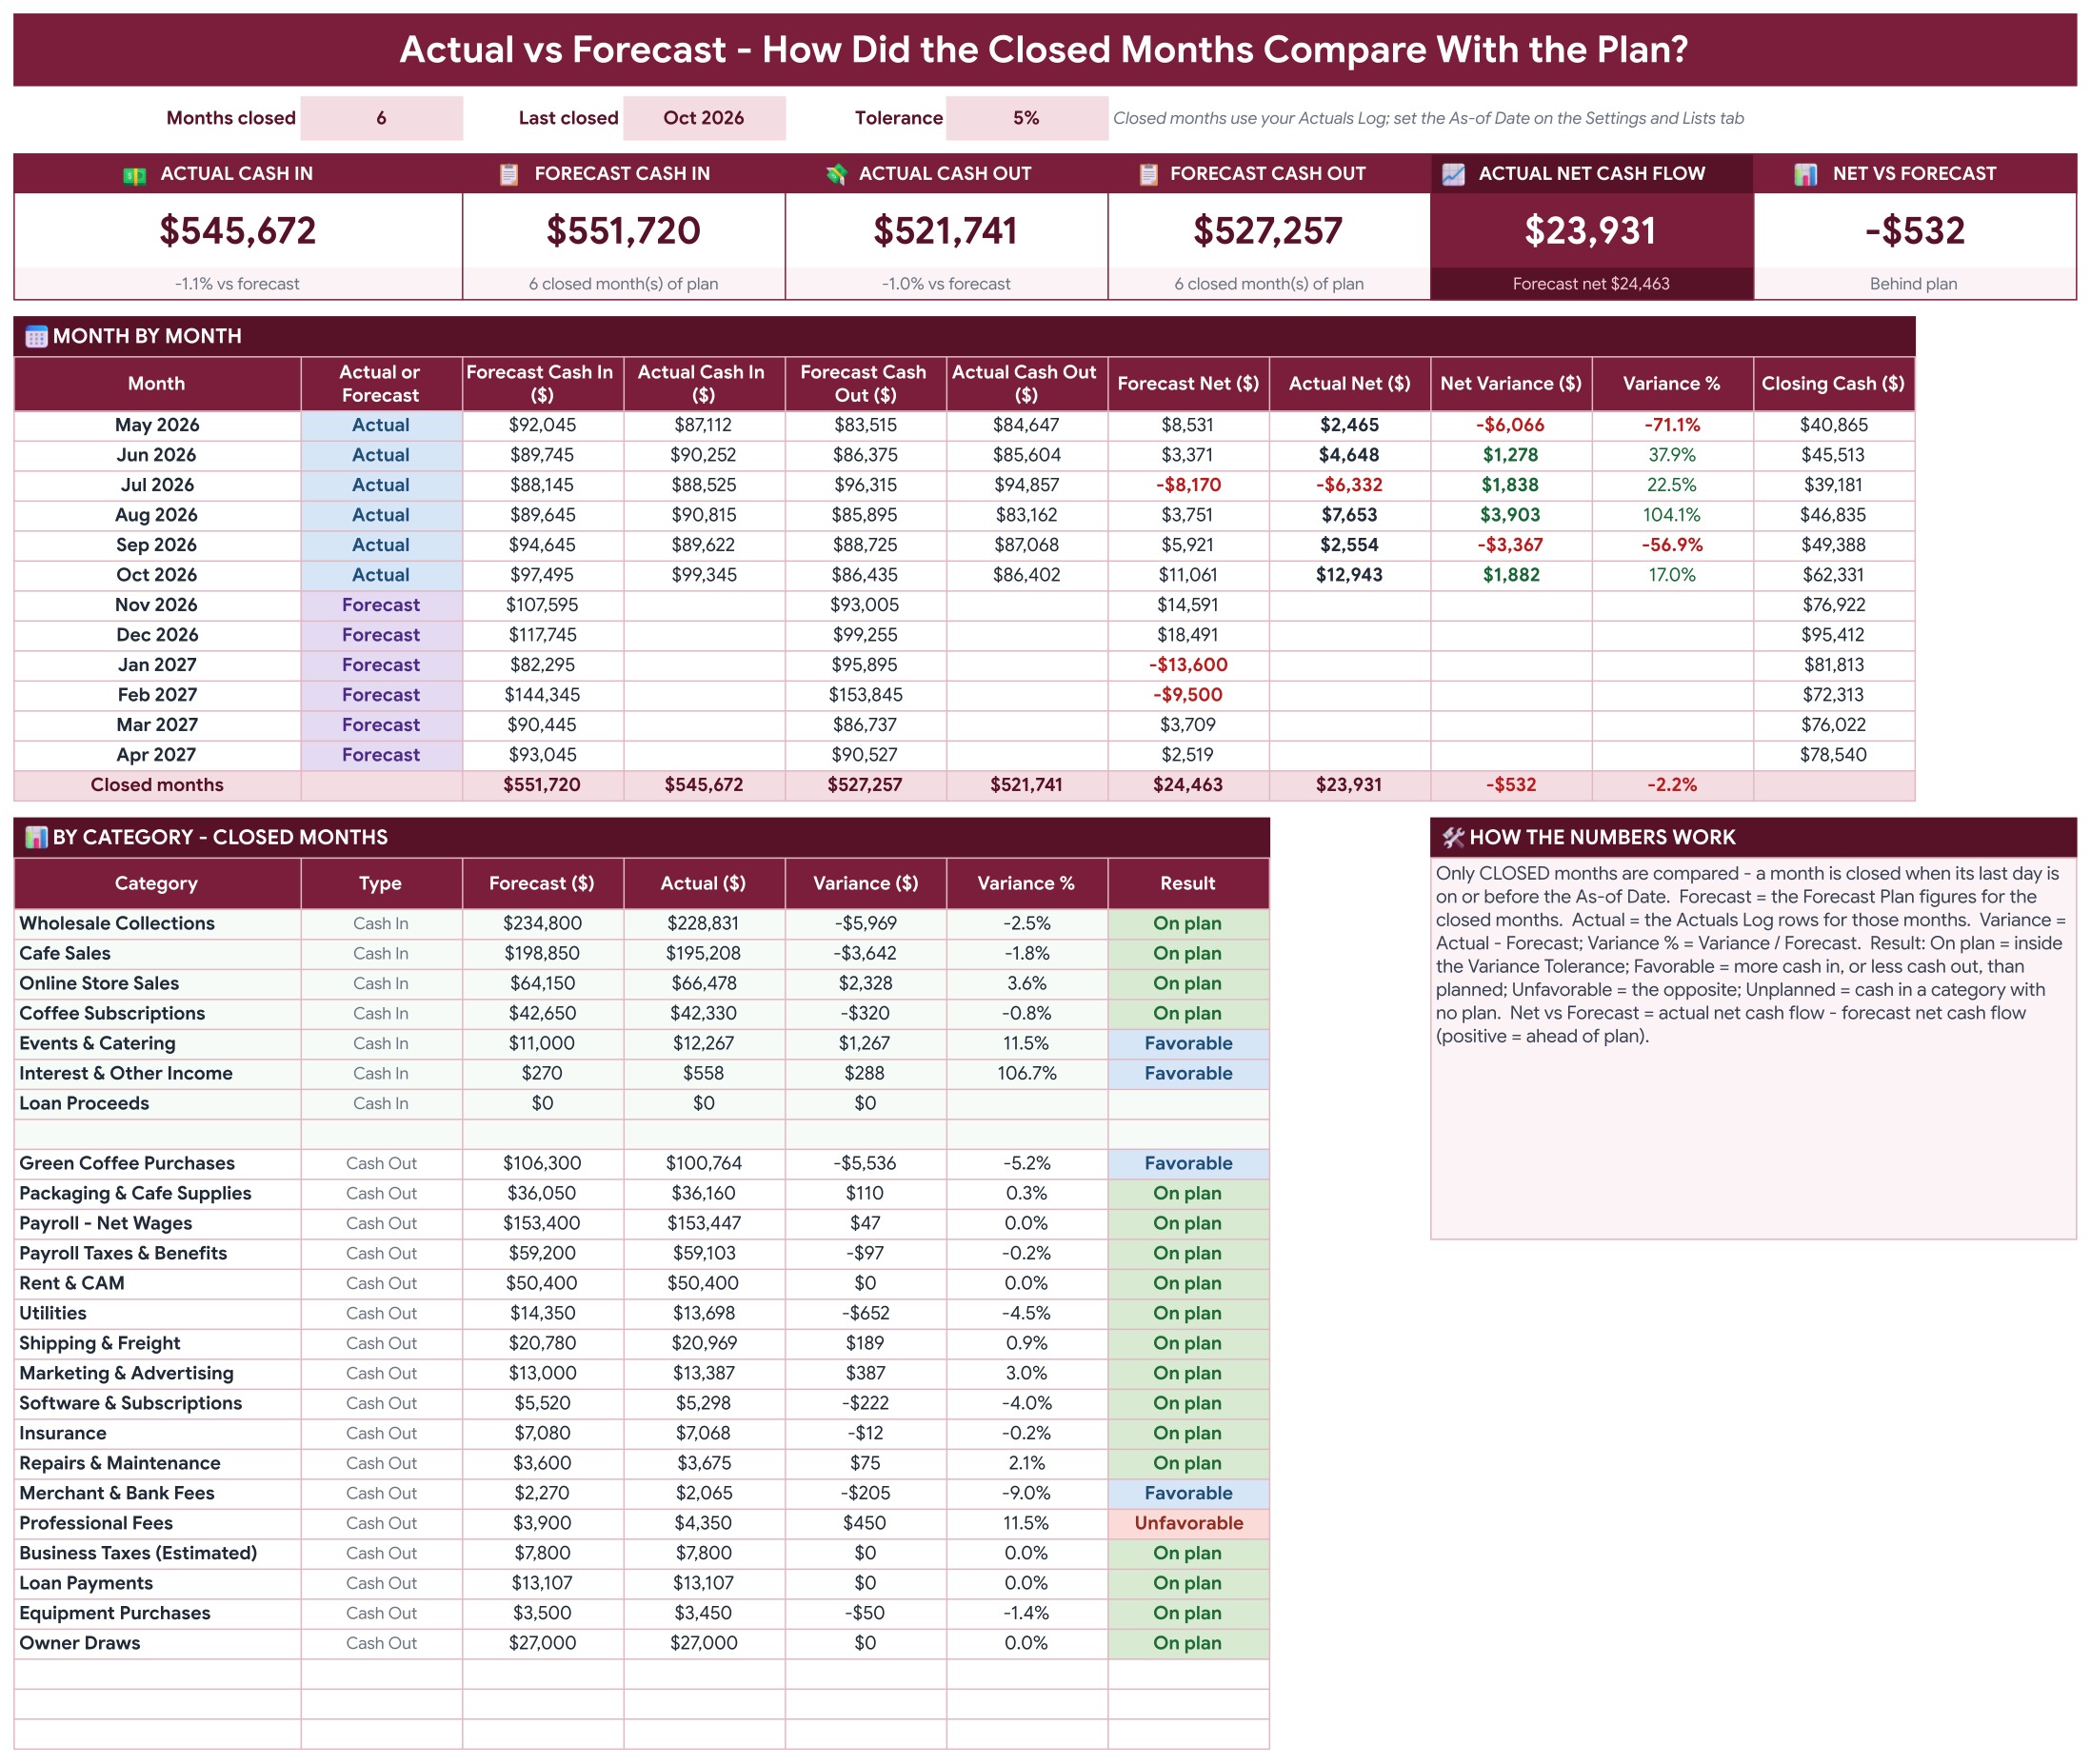
Six tiles compare actual and forecast cash in, cash out and net cash flow for the closed months. A month by month table shows forecast, actual and variance, and a category table marks every line On plan, Favorable, Unfavorable or Unplanned.
Settings and Lists (Google Sheets)
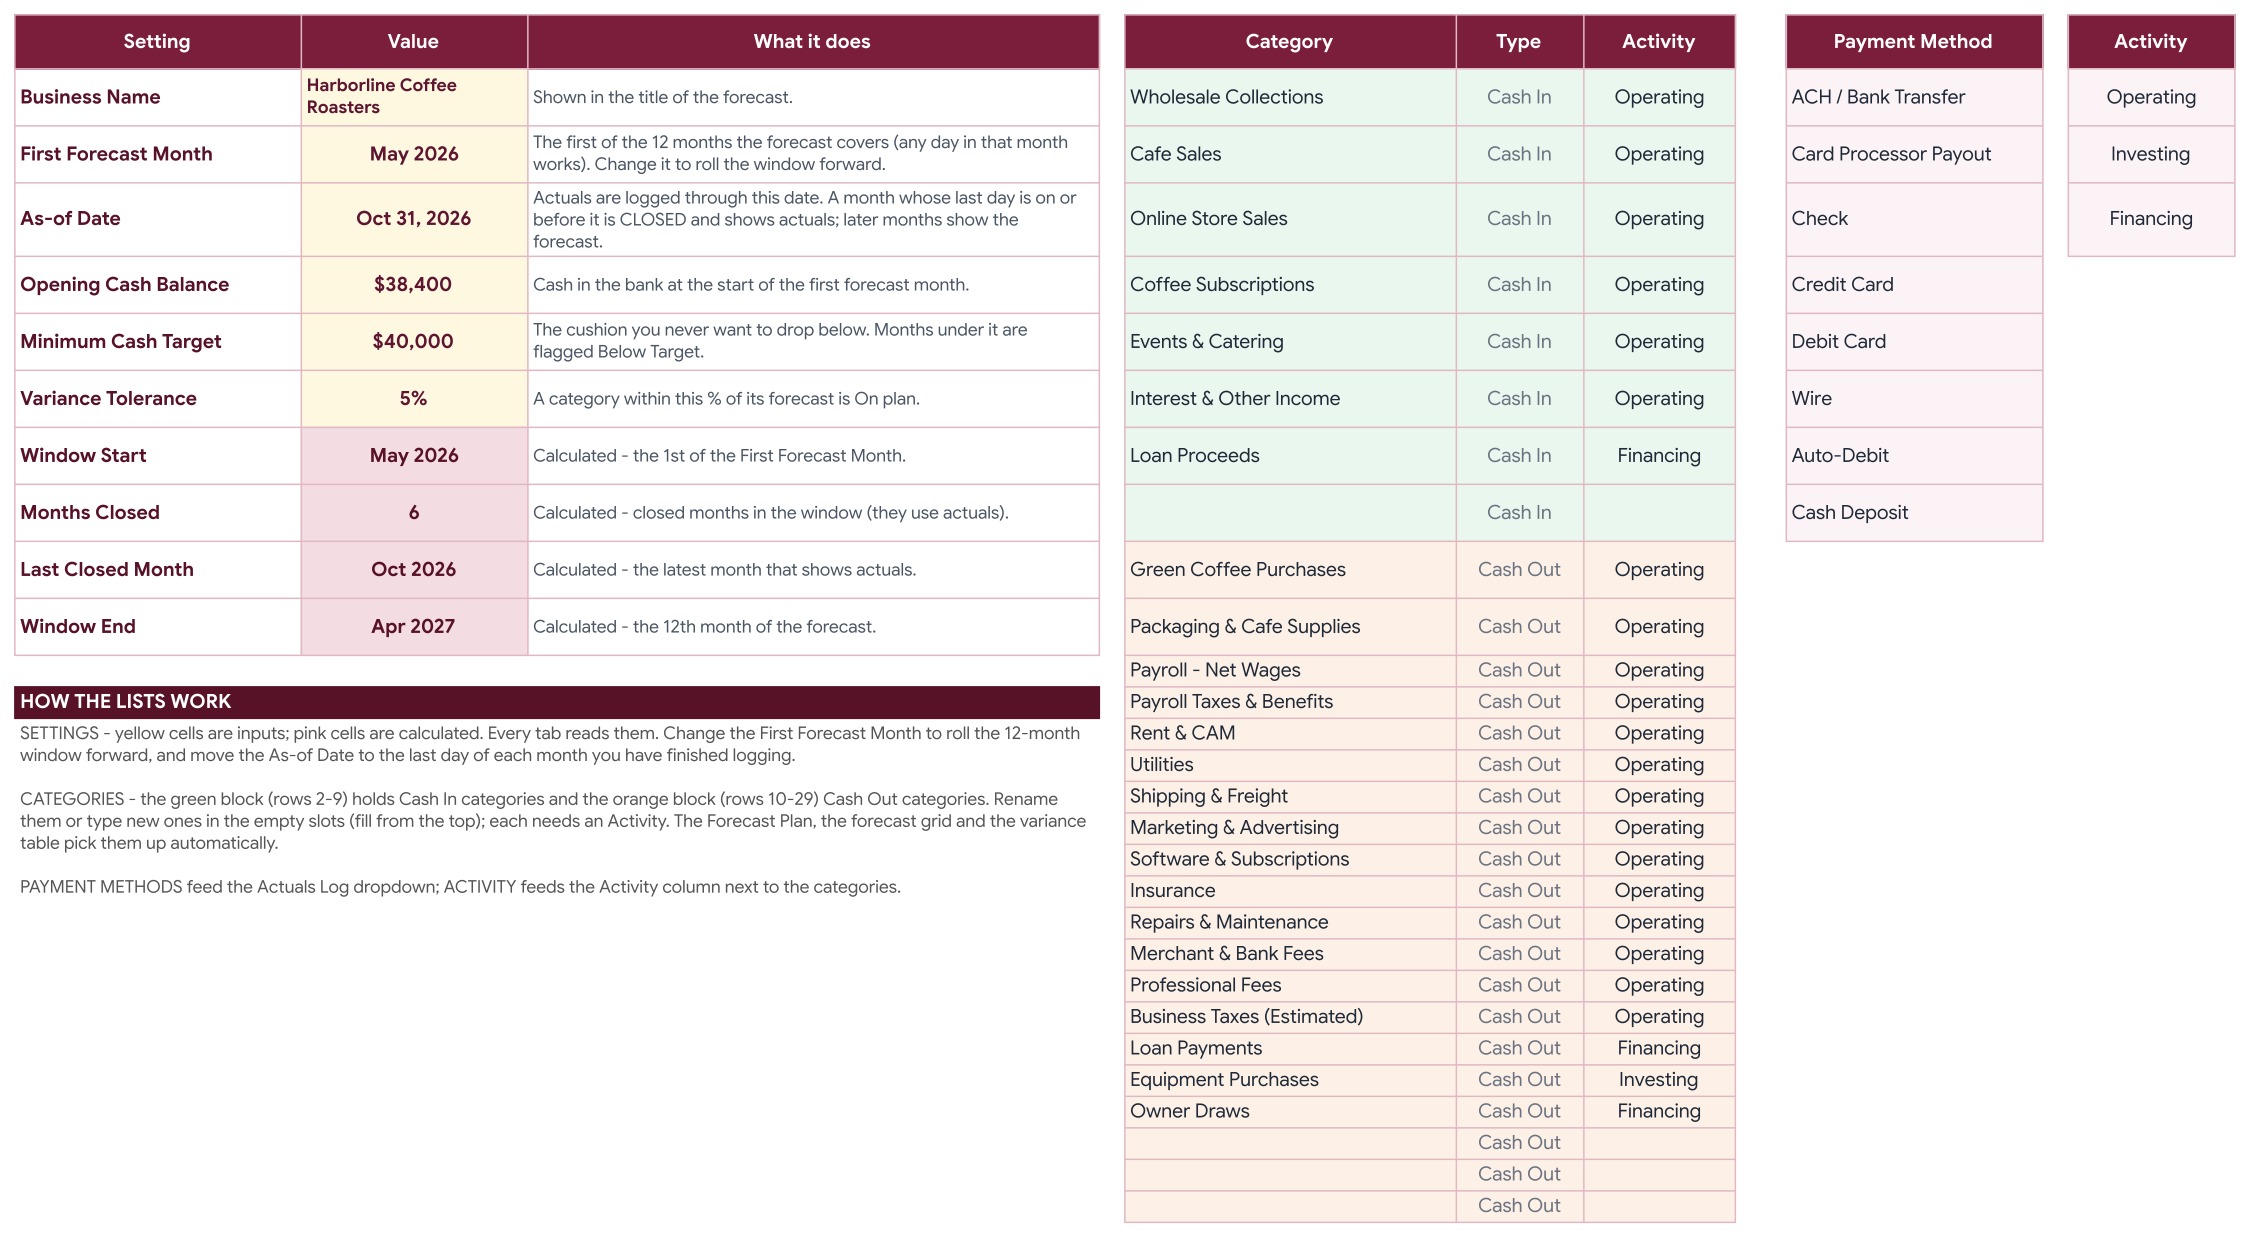
Set the business name, the first forecast month, the As-of Date, the opening cash balance, the minimum cash target and the variance tolerance. Rename the 8 cash in and 20 cash out categories and the payment methods; the whole workbook follows.
Instructions (Google Sheets)
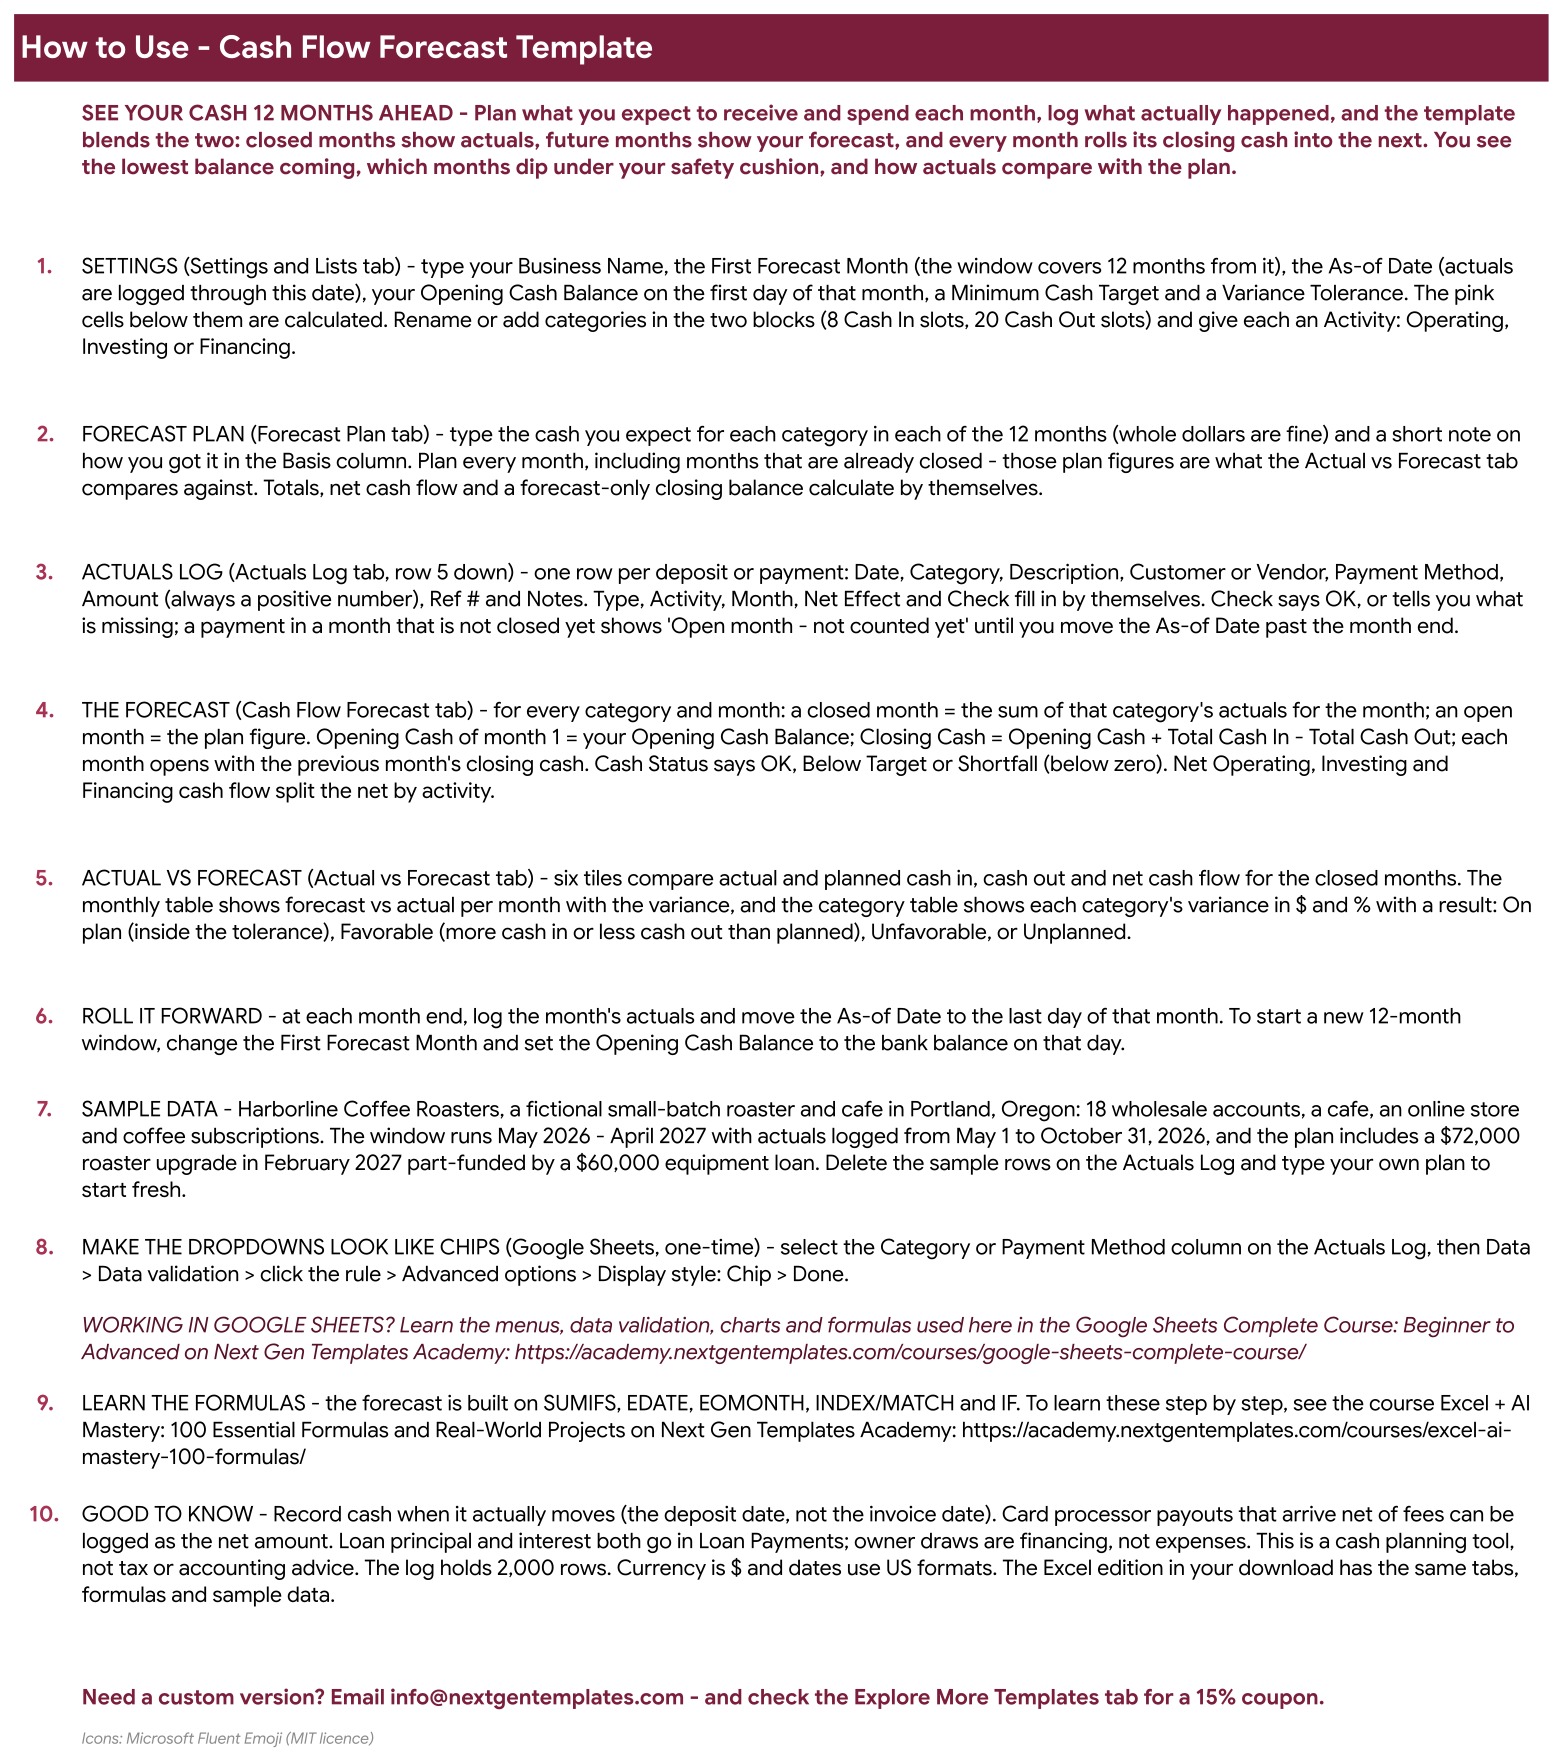
Step by step: set up the settings, plan the 12 months, log actuals, read the forecast and the variance tables, and roll the window forward each month.
Explore More Templates (Google Sheets)
Recommended templates and popular categories, plus a WELCOME15 coupon for 15% off your next purchase.
Cash Flow Forecast (Excel edition)
The same cards, four charts and 12-month statement in Microsoft Excel, with the same formulas and sample data.
Forecast Plan (Excel edition)
The 12-month plan in Excel: cash in and cash out by category, the Basis / Notes column, totals and the forecast-only closing cash.
Actual vs Forecast (Excel edition)
The closed-month comparison in Excel: six tiles, the month by month variance table and the category result table.
How a monthly cash review runs
Log the month. Add every deposit and payment to the Actuals Log. The Check column tells you if a row is missing a category or a date.
Move the As-of Date. Set it to the last day of the month you just closed. That month switches from plan to actual across the whole workbook.
Read the cards. Projected Ending Cash, Lowest Cash Balance and Months Below Target show at once whether the plan still holds.
Explain the gap. Open Actual vs Forecast and see which categories ran over or under plan, then raise cash in or delay spend before a Below Target month arrives.
Setting it up with your own numbers
Open the PDF guide from your download, click the link and choose File, then Make a copy for Google Sheets, or open the Excel file. On the Settings and Lists tab, enter your opening cash, your minimum cash target and your categories, then replace the sample plan and log rows with your own. A 12 month cash flow forecast template only helps if it matches the way you really spend, so rename every category to match your business.
If you also want to plan a personal or household budget the same way, the Zero-Based Budget Template in Excel and Google Sheets is a good companion.
Cash Flow Forecast Template vs. a spreadsheet vs. accounting software
| Feature | This template | Blank spreadsheet | Accounting software |
|---|---|---|---|
| Cost | $6.99 one-time ✅ | Free, but you build it | Monthly subscription |
| 12-month forecast with actuals for closed months | Yes ✅ | Build it yourself | Often an add-on |
| Minimum cash target flag | Yes ✅ | Build it yourself | Varies |
| Bank import | No | No | Often yes |
Who it is for, and who it is not for
The U.S. Small Business Administration explains why cash planning matters in its guide to managing your finances. A cash flow projection template turns that advice into a monthly habit. It suits small business owners, freelancers and finance managers who want to see their cash 12 months ahead. It does not suit teams that need automatic bank import, bookkeeping, invoicing or a weekly 13-week view.
Related templates
- Cash Flow Analysis Pack: a closer look at cash coming in and going out.
- Profit and Loss (P&L) Template in Excel: the profit side of the same business.
- Free Profit and Loss Statement Template in Excel and Google Sheets: a simple statement to start with.
Frequently asked questions
What is a cash flow forecast?
A cash flow forecast estimates the cash coming in and going out of your business month by month, so you can see your expected bank balance and spot a shortfall before it happens.
Does it work in Google Sheets and Excel?
Yes. The ZIP holds an Excel edition (.xlsx, no macros) and a PDF guide with the Make a copy link for Google Sheets. Both have the same seven tabs and formulas.
Does it connect to my bank?
No. You type or paste each deposit and payment yourself.
What is the minimum cash target?
It is the cushion you want to keep in the bank. A month that closes below it is flagged Below Target, and a negative balance is flagged Shortfall.
Get the Cash Flow Forecast Template in Excel and Google Sheets
One-time payment, instant download, Excel and Google Sheets editions in one ZIP. Get the Cash Flow Forecast Template in Excel and Google Sheets.
📅 Last updated: November 2026